| Param | Original file | Final file |
|---|---|---|
| Filename | modeM0/AS1T05_064T01_9000005416_38908cztM0_level2.fits | modeM0/AS1T05_064T01_9000005416_38908cztM0_level2_quad_clean.evt |
| Size (bytes) | 371,059,200 | 94,034,880 |
| Size | 353.9 MB | 89.7 MB |
| Events in quadrant A | 2,866,797 | 647,685 |
| Events in quadrant B | 2,642,450 | 651,627 |
| Events in quadrant C | 2,670,511 | 626,790 |
| Events in quadrant D | 5,134,056 | 542,306 |
| Mode SS | |||
|---|---|---|---|
| Quadrant | BADHDUFLAG | Total packets | Discarded packets |
| A | 0 | 110 | 0 |
| B | 0 | 110 | 0 |
| C | 0 | 110 | 0 |
| D | 0 | 110 | 0 |
| Mode M9 | |||
|---|---|---|---|
| Quadrant | BADHDUFLAG | Total packets | Discarded packets |
| A | 0 | 20 | 0 |
| B | 0 | 20 | 0 |
| C | 0 | 20 | 0 |
| D | 0 | 21 | 0 |
| Mode M0 | |||
|---|---|---|---|
| Quadrant | BADHDUFLAG | Total packets | Discarded packets |
| A | 0 | 11930 | 3 |
| B | 0 | 11538 | 2 |
| C | 0 | 11251 | 2 |
| D | 0 | 19111 | 2 |
| Quadrant | Total seconds | Saturated seconds | Saturation percentage |
|---|---|---|---|
| A | 5416 | 17 | 0.313885% |
| B | 5416 | 46 | 0.849335% |
| C | 5416 | 14 | 0.258493% |
| D | 5416 | 500 | 9.231905% |
Noise dominated data is calculated using 1-second bins in cleaned event files. If a bin has >2000 counts, and if more than 50% of those come from <1% of pixels, then it is considered to be noise-dominated and hence unusable.
| Quadrant | # 1 sec bins | Bins with >0 counts | Bins with >2000 counts | High rate bins dominated by noise | Noise dominated (total time) | Noise dominated (detector-on time) | Marked lightcurve |
|---|---|---|---|---|---|---|---|
| A | 7209 | 5417 | 8 | 8 | 0.11% | 0.15% | 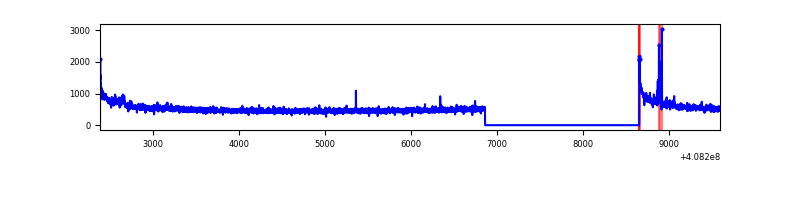 |
| B | 7209 | 5417 | 23 | 23 | 0.32% | 0.42% | 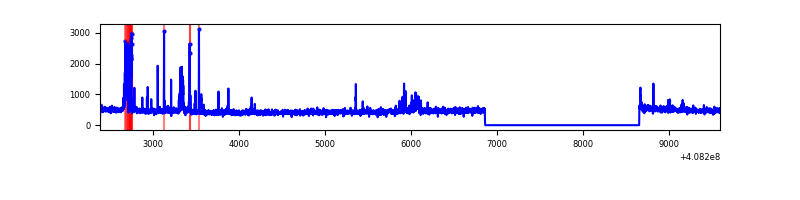 |
| C | 7209 | 5417 | 8 | 8 | 0.11% | 0.15% | 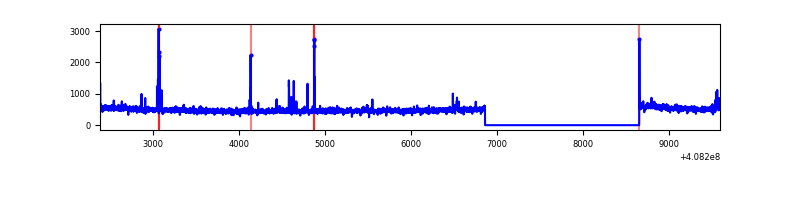 |
| D | 7209 | 5416 | 484 | 484 | 6.71% | 8.94% | 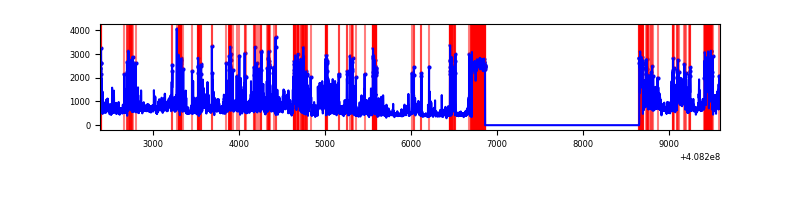 |
Top three noisy pixels from each quadrant. If the there are fewer than three noisy pixels in the level2.evt file, extra rows are filled as -1
| Pixel properties | Quadrant properties | ||||||
|---|---|---|---|---|---|---|---|
| Quadrant | DetID | PixID | Counts | Sigma | Mean | Median | Sigma |
| A | 10 | 83 | 441070 | 3562.73 | 611 | 598 | 123.6 |
| A | 13 | 248 | 33140 | 263.21 | 611 | 598 | 123.6 |
| A | 12 | 189 | 16712 | 130.34 | 611 | 598 | 123.6 |
| B | 5 | 184 | 177317 | 1530.61 | 605 | 588 | 115.5 |
| B | 5 | 172 | 20520 | 172.63 | 605 | 588 | 115.5 |
| B | 0 | 199 | 17169 | 143.6 | 605 | 588 | 115.5 |
| C | 15 | 214 | 238984 | 1721.0 | 599 | 603 | 138.5 |
| C | 14 | 254 | 77226 | 553.18 | 599 | 603 | 138.5 |
| C | 0 | 10 | 7928 | 52.88 | 599 | 603 | 138.5 |
| D | 12 | 227 | 985618 | 7121.95 | 573 | 557 | 138.3 |
| D | 12 | 235 | 589875 | 4260.74 | 573 | 557 | 138.3 |
| D | 2 | 249 | 531988 | 3842.22 | 573 | 557 | 138.3 |
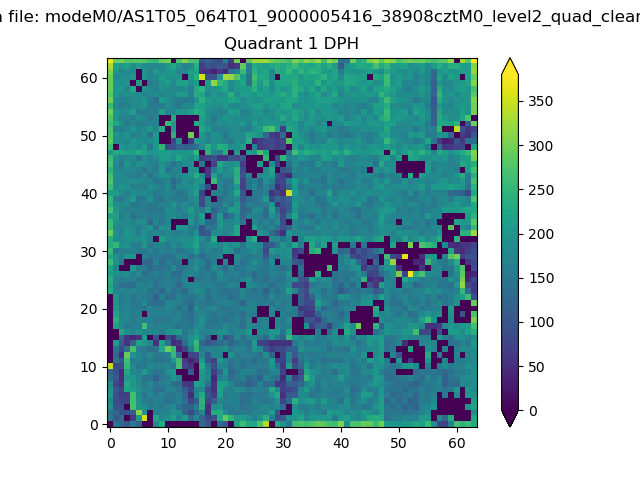
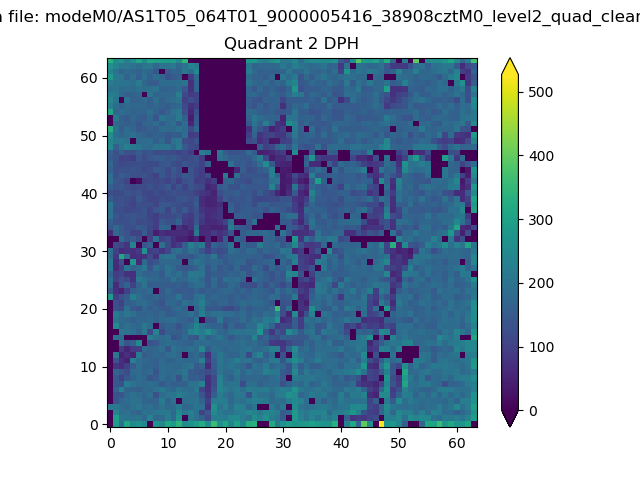
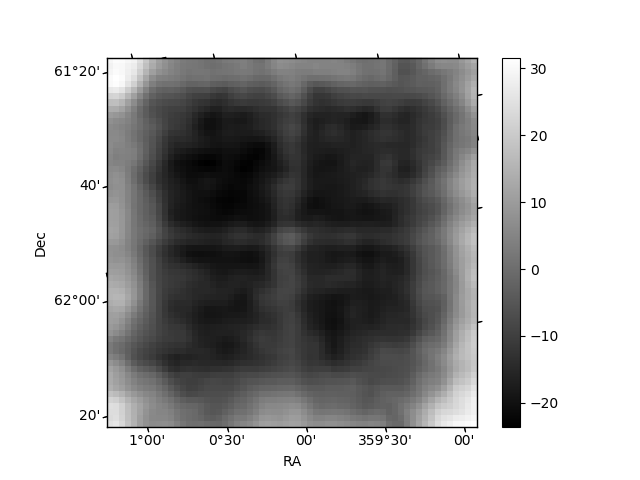
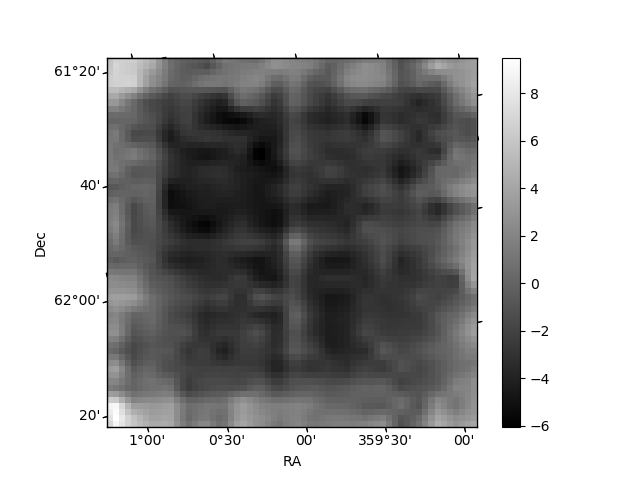
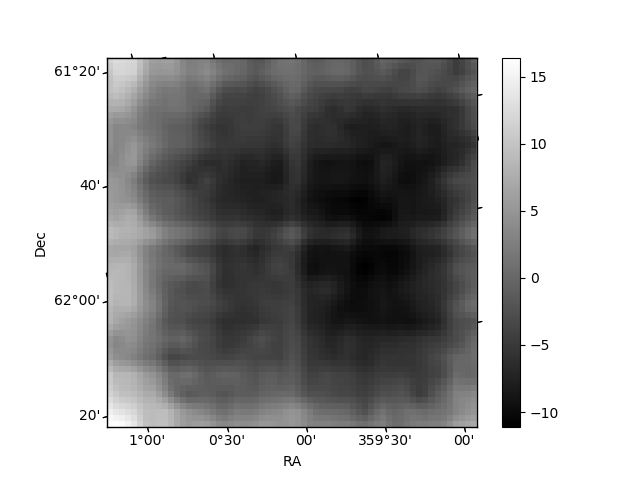
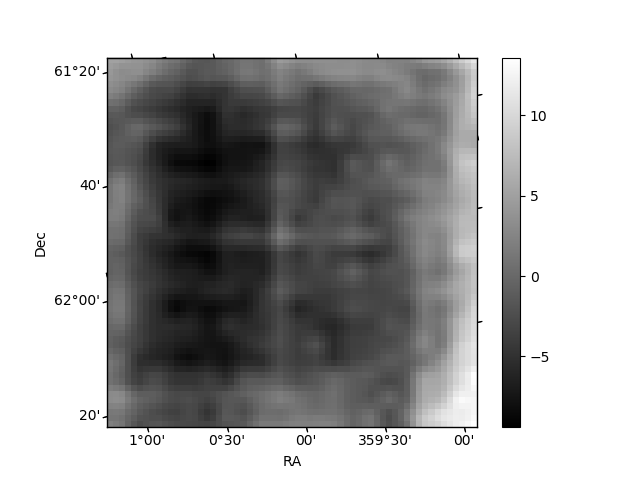
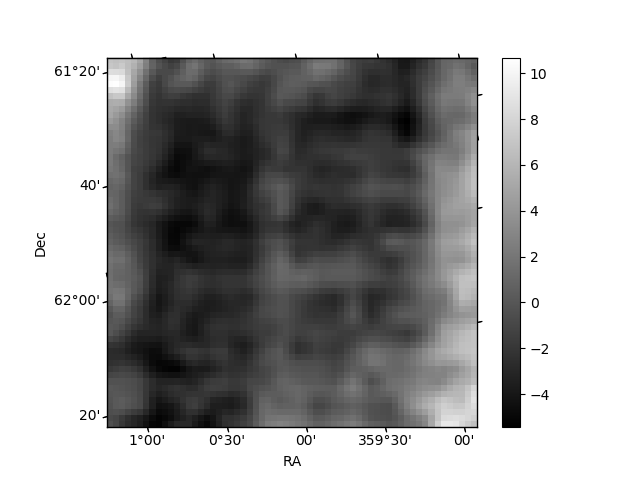
Histogram calculated using DETX and DETY for each event in the final _common_clean file
| Quadrant A |  |
 |
Quadrant B |
|---|---|---|---|
| Quadrant D | 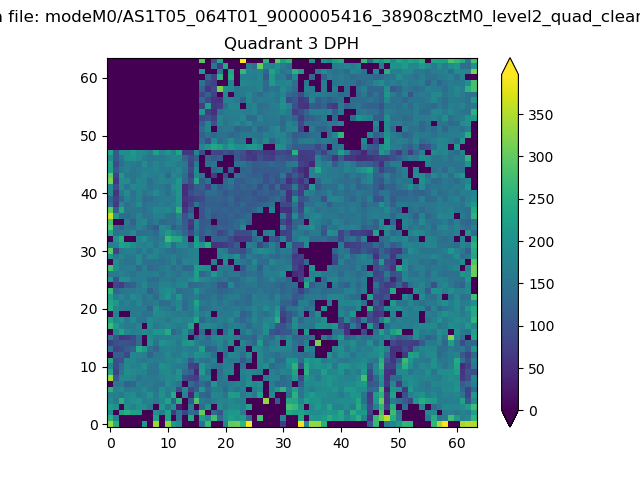 |
 |
Quadrant C |
| Plot type | Count rate plots | Images |
|---|---|---|
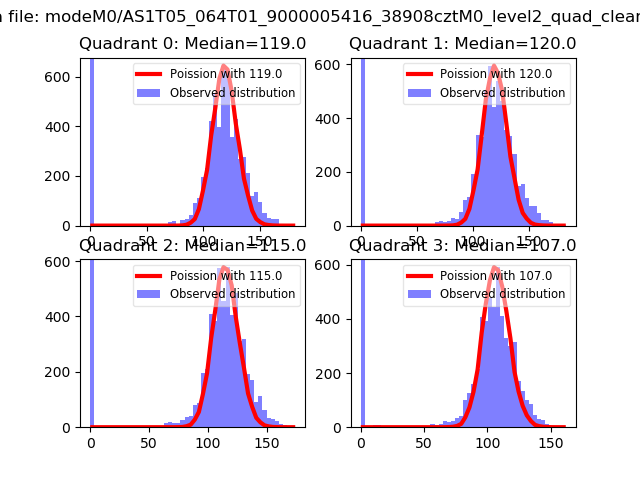
| Comparison with Poisson distribution Blue bars denote a histogram of data divided into 1 sec bins. Red curve is a Poisson curve with rate = median count rate of data. |
 |
 |
| Quadrant-wise count rates Data is divided into 100 sec bins |
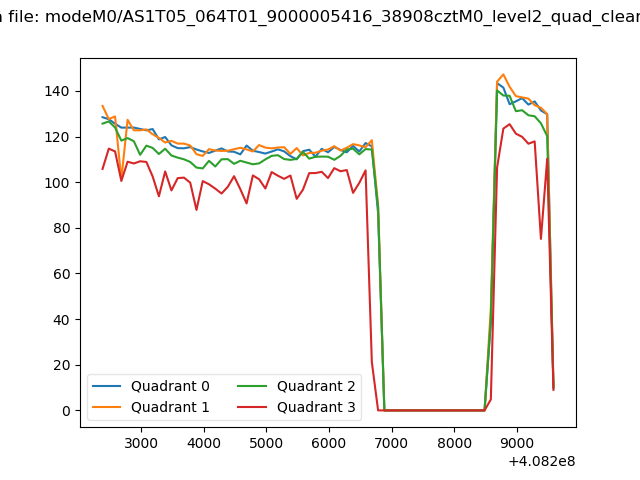 |
|
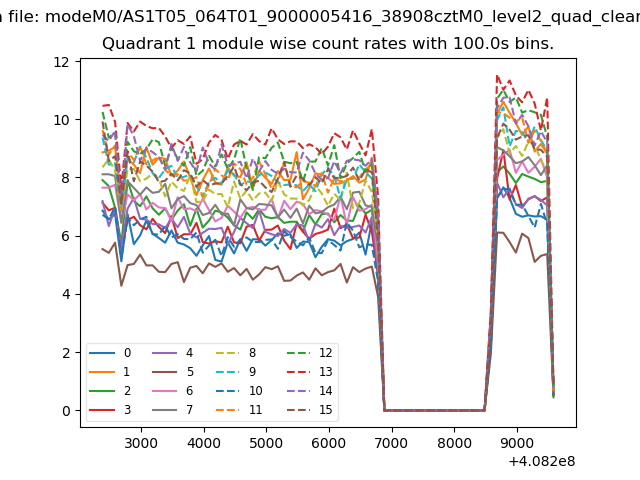
| Module-wise count rates for Quadrant A Data is divided into 100 sec bins |
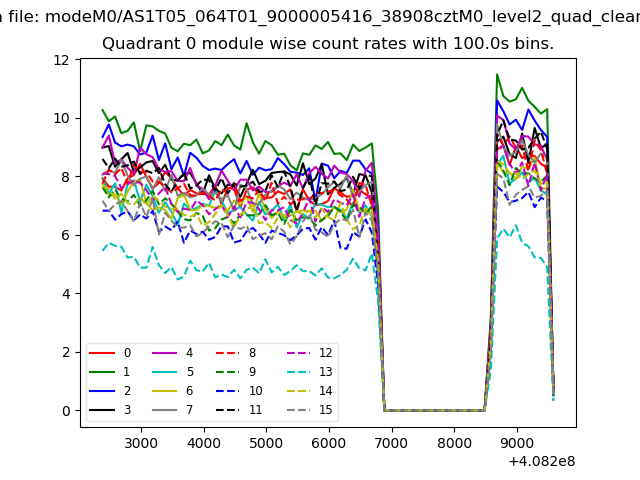 |
 |
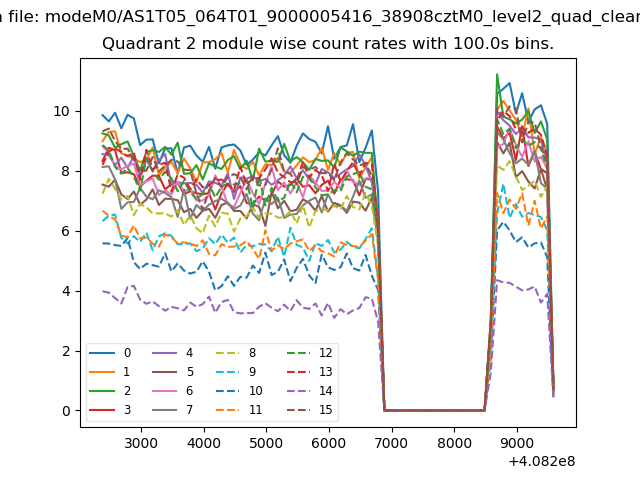
| Module-wise count rates for Quadrant B Data is divided into 100 sec bins |
 |
 |
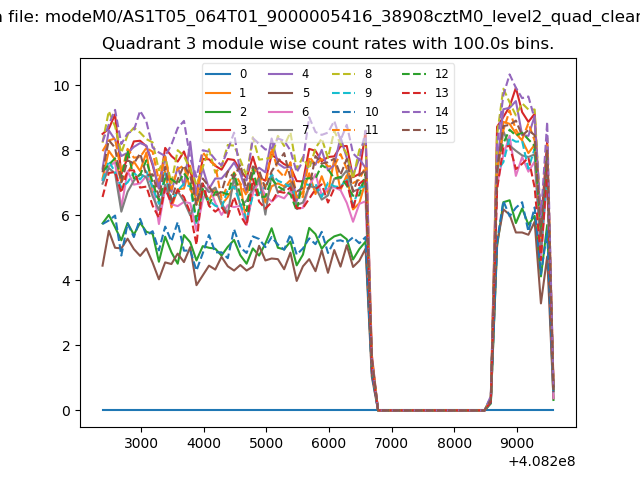
| Module-wise count rates for Quadrant C Data is divided into 100 sec bins |
 |
 |
| Module-wise count rates for Quadrant D Data is divided into 100 sec bins |
 |
 |
| Parameter | Plot |
|---|---|
| CZT HV Monitor |  |
| D_VDD | 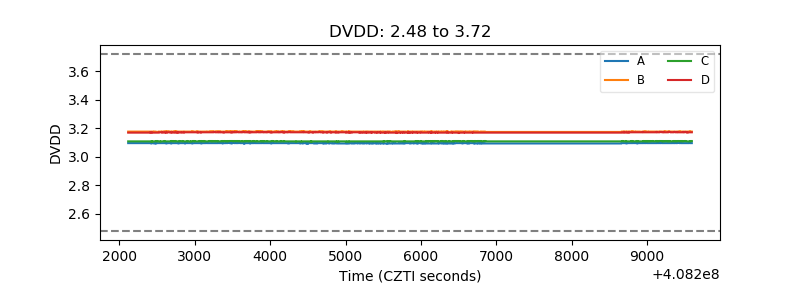 |
| Temperature 1 | 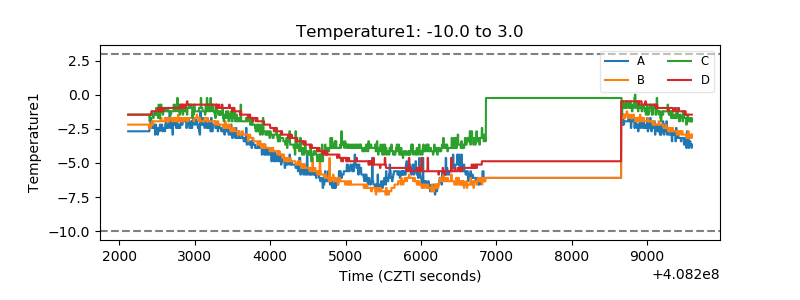 |
| Veto HV Monitor | 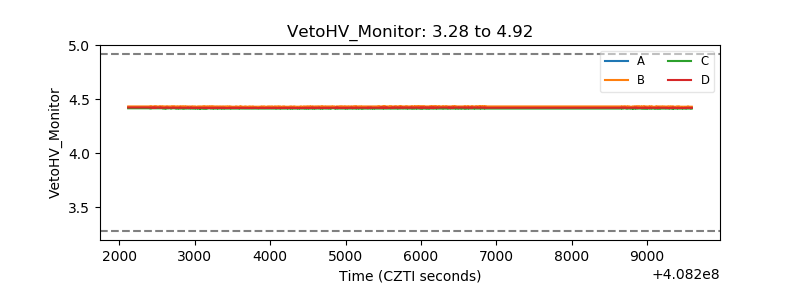 |
| Veto LLD | 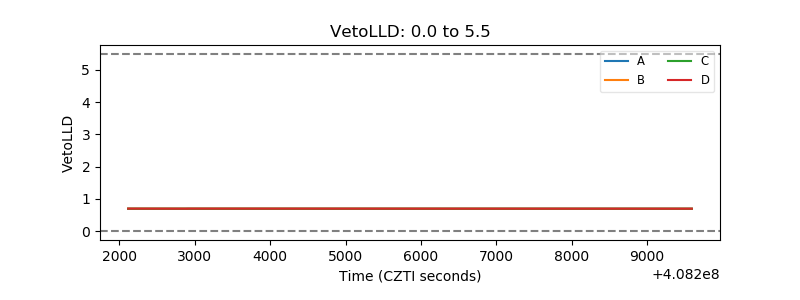 |
| Alpha Counter | 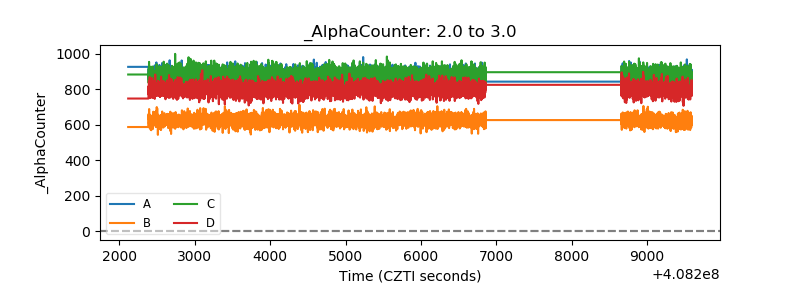 |
| _CPM_Rate | 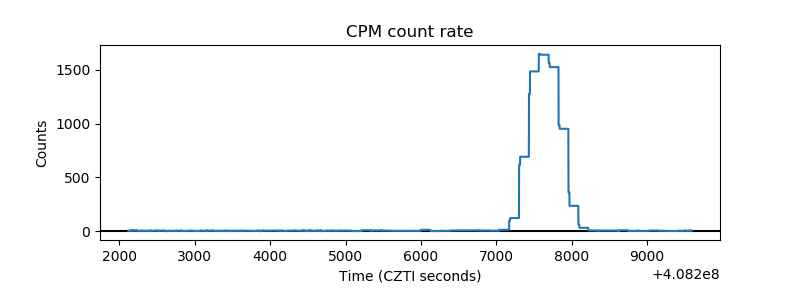 |
| CZT Counter | 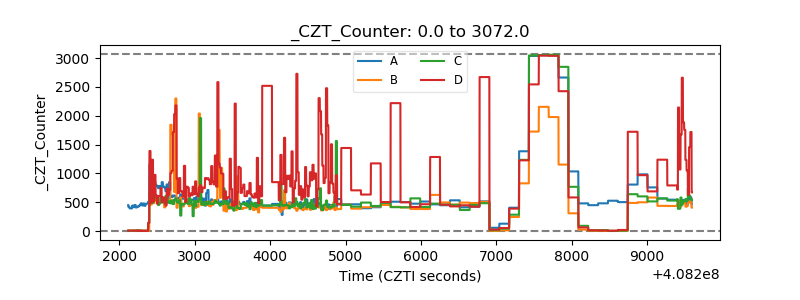 |
| +2.5 Volts monitor | 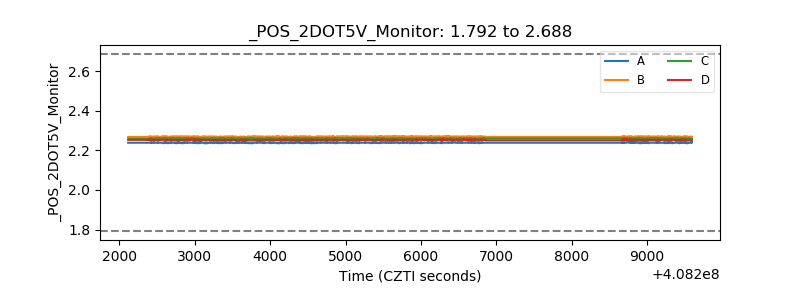 |
| +5 Volts monitor | 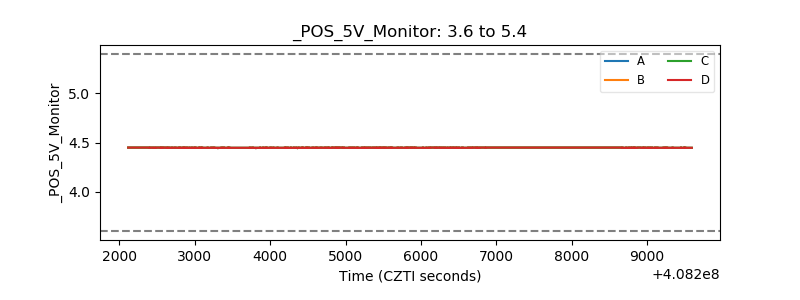 |
| _ROLL_ROT | 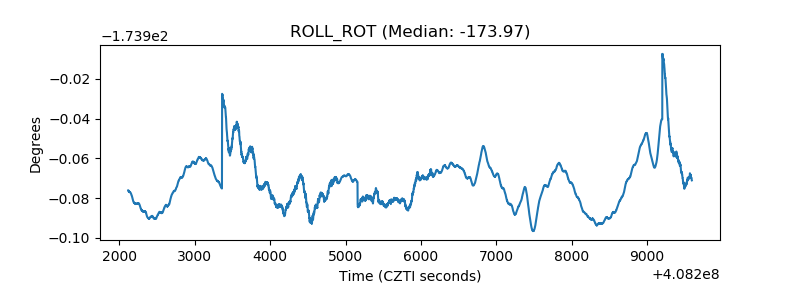 |
| _Roll_DEC | 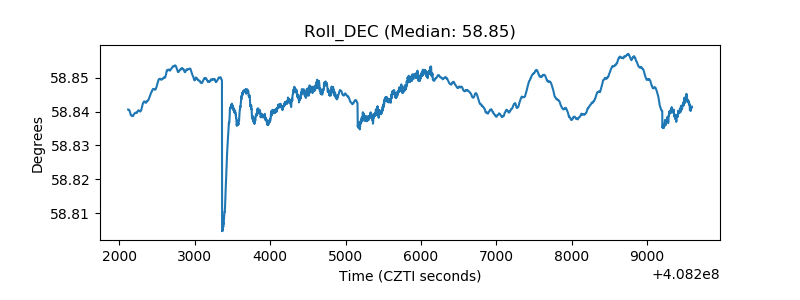 |
| _Roll_RA | 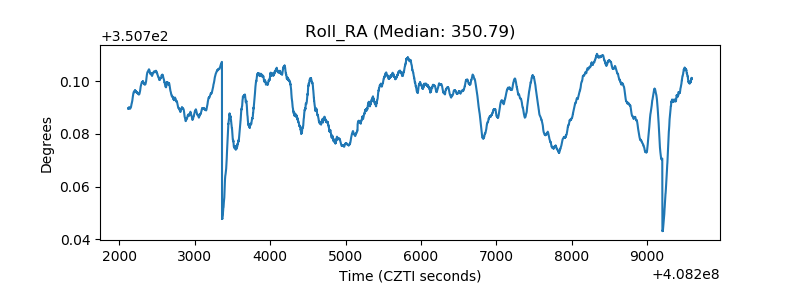 |
| Veto Counter | 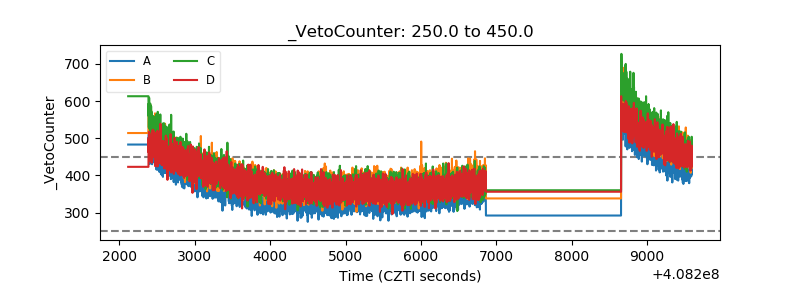 |