| Param | Original file | Final file |
|---|---|---|
| Filename | modeM0/AS1T05_064T01_9000005416_38909cztM0_level2.fits | modeM0/AS1T05_064T01_9000005416_38909cztM0_level2_quad_clean.evt |
| Size (bytes) | 366,756,480 | 97,130,880 |
| Size | 349.8 MB | 92.6 MB |
| Events in quadrant A | 3,013,300 | 662,806 |
| Events in quadrant B | 2,485,661 | 675,132 |
| Events in quadrant C | 2,968,048 | 651,589 |
| Events in quadrant D | 4,698,513 | 582,432 |
| Mode SS | |||
|---|---|---|---|
| Quadrant | BADHDUFLAG | Total packets | Discarded packets |
| A | 0 | 106 | 0 |
| B | 0 | 106 | 0 |
| C | 0 | 106 | 0 |
| D | 0 | 106 | 0 |
| Mode M9 | |||
|---|---|---|---|
| Quadrant | BADHDUFLAG | Total packets | Discarded packets |
| A | 0 | 20 | 0 |
| B | 0 | 20 | 0 |
| C | 0 | 20 | 0 |
| D | 0 | 20 | 0 |
| Mode M0 | |||
|---|---|---|---|
| Quadrant | BADHDUFLAG | Total packets | Discarded packets |
| A | 0 | 12278 | 3 |
| B | 0 | 10850 | 2 |
| C | 0 | 12105 | 2 |
| D | 0 | 17660 | 2 |
| Quadrant | Total seconds | Saturated seconds | Saturation percentage |
|---|---|---|---|
| A | 5279 | 38 | 0.719833% |
| B | 5279 | 14 | 0.265202% |
| C | 5279 | 18 | 0.340974% |
| D | 5279 | 281 | 5.322978% |
Noise dominated data is calculated using 1-second bins in cleaned event files. If a bin has >2000 counts, and if more than 50% of those come from <1% of pixels, then it is considered to be noise-dominated and hence unusable.
| Quadrant | # 1 sec bins | Bins with >0 counts | Bins with >2000 counts | High rate bins dominated by noise | Noise dominated (total time) | Noise dominated (detector-on time) | Marked lightcurve |
|---|---|---|---|---|---|---|---|
| A | 7222 | 5280 | 36 | 36 | 0.50% | 0.68% | 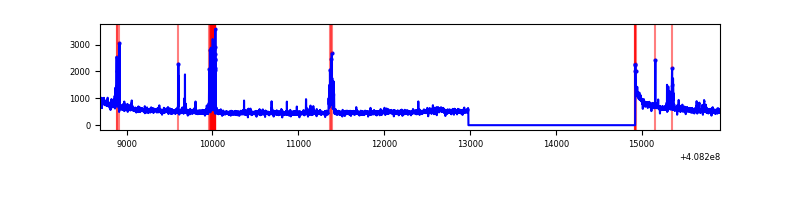 |
| B | 7222 | 5280 | 10 | 10 | 0.14% | 0.19% | 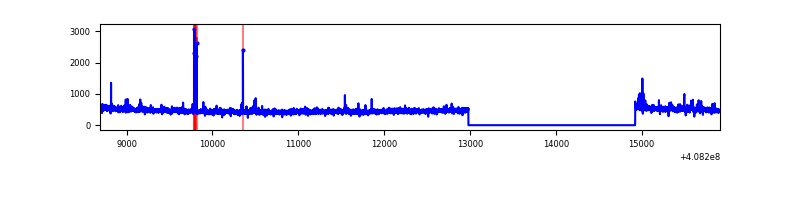 |
| C | 7222 | 5280 | 11 | 11 | 0.15% | 0.21% | 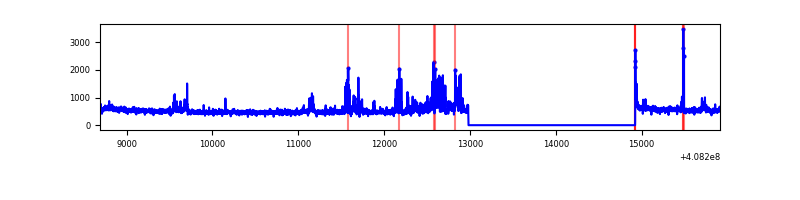 |
| D | 7222 | 5280 | 286 | 286 | 3.96% | 5.42% | 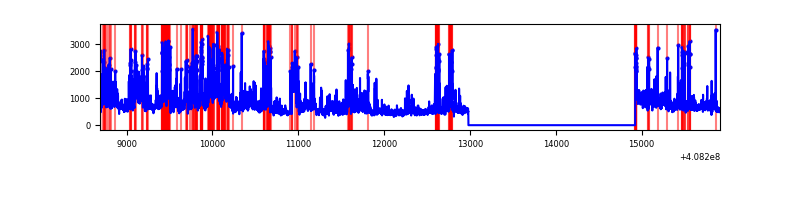 |
Top three noisy pixels from each quadrant. If the there are fewer than three noisy pixels in the level2.evt file, extra rows are filled as -1
| Pixel properties | Quadrant properties | ||||||
|---|---|---|---|---|---|---|---|
| Quadrant | DetID | PixID | Counts | Sigma | Mean | Median | Sigma |
| A | 10 | 83 | 416313 | 3414.93 | 607 | 593 | 121.7 |
| A | 13 | 248 | 199226 | 1631.67 | 607 | 593 | 121.7 |
| A | 12 | 16 | 24387 | 195.46 | 607 | 593 | 121.7 |
| B | 5 | 172 | 38413 | 332.47 | 606 | 590 | 113.8 |
| B | 0 | 155 | 15146 | 127.95 | 606 | 590 | 113.8 |
| B | 12 | 111 | 13529 | 113.74 | 606 | 590 | 113.8 |
| C | 14 | 254 | 350544 | 2510.9 | 603 | 608 | 139.4 |
| C | 15 | 214 | 231323 | 1655.45 | 603 | 608 | 139.4 |
| C | 0 | 10 | 12700 | 86.76 | 603 | 608 | 139.4 |
| D | 12 | 227 | 592752 | 4180.15 | 593 | 576 | 141.7 |
| D | 12 | 235 | 560198 | 3950.36 | 593 | 576 | 141.7 |
| D | 2 | 249 | 260153 | 1832.35 | 593 | 576 | 141.7 |
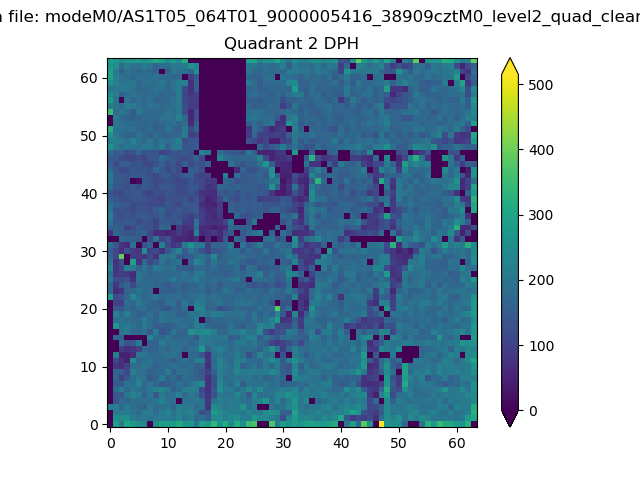
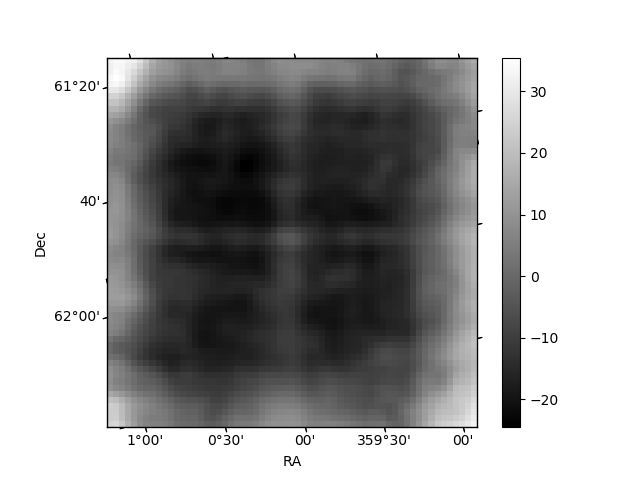
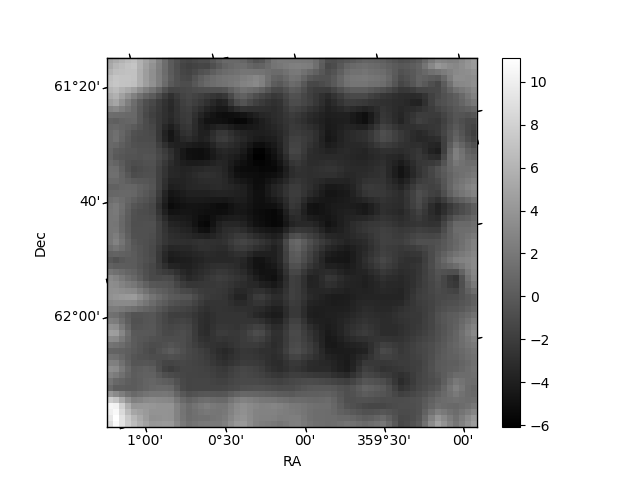
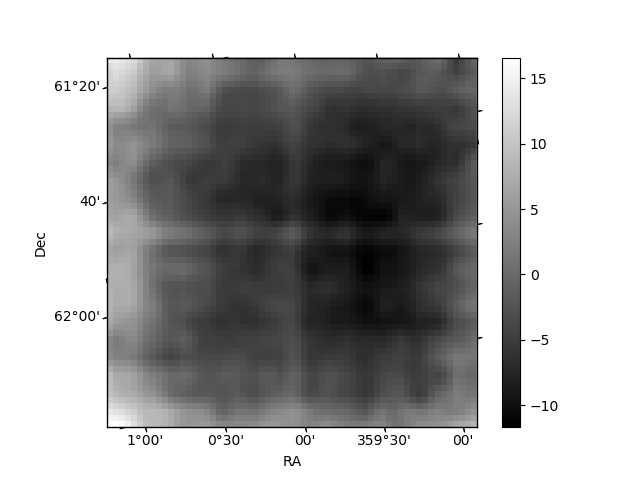
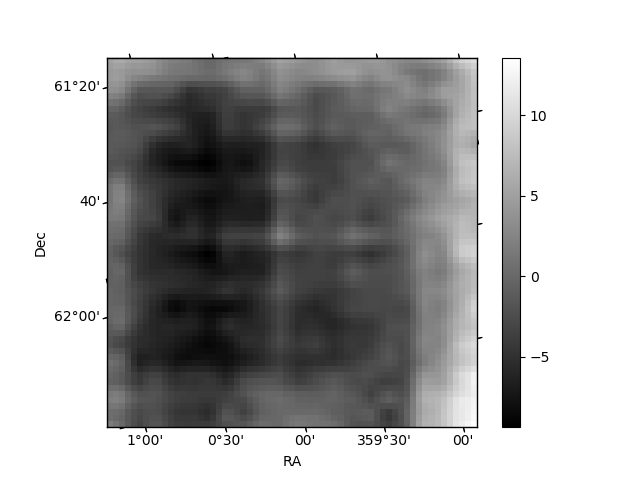
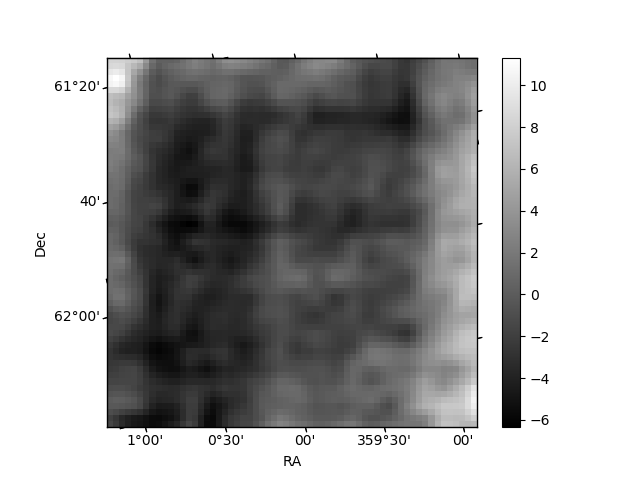
Histogram calculated using DETX and DETY for each event in the final _common_clean file
| Quadrant A | 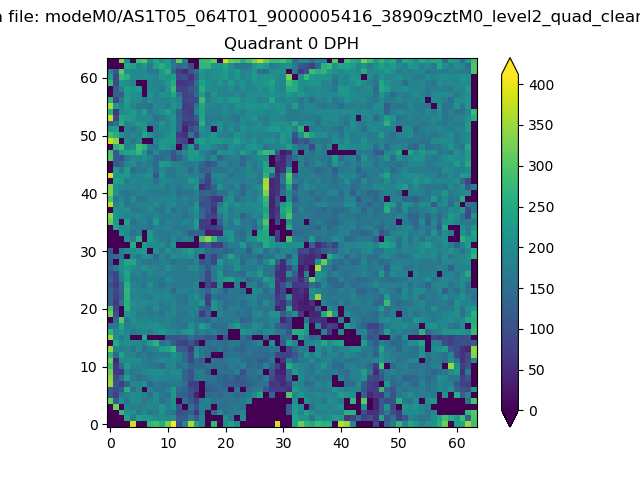 |
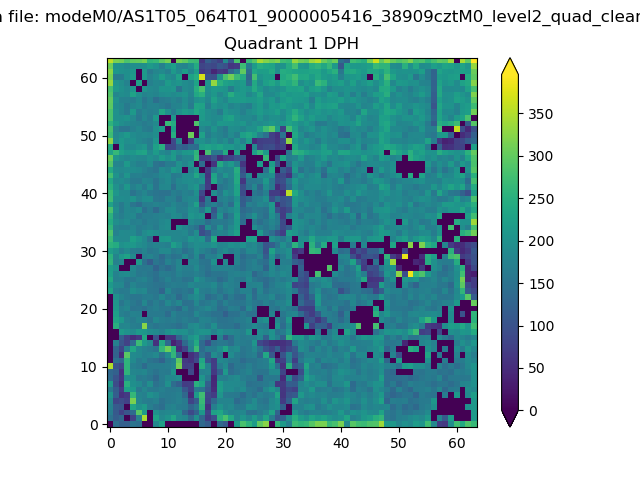 |
Quadrant B |
|---|---|---|---|
| Quadrant D | 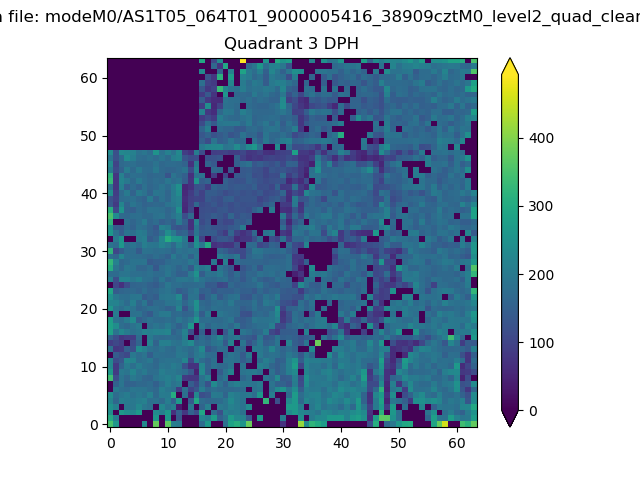 |
 |
Quadrant C |
| Plot type | Count rate plots | Images |
|---|---|---|
| Comparison with Poisson distribution Blue bars denote a histogram of data divided into 1 sec bins. Red curve is a Poisson curve with rate = median count rate of data. |
 |
 |
| Quadrant-wise count rates Data is divided into 100 sec bins |
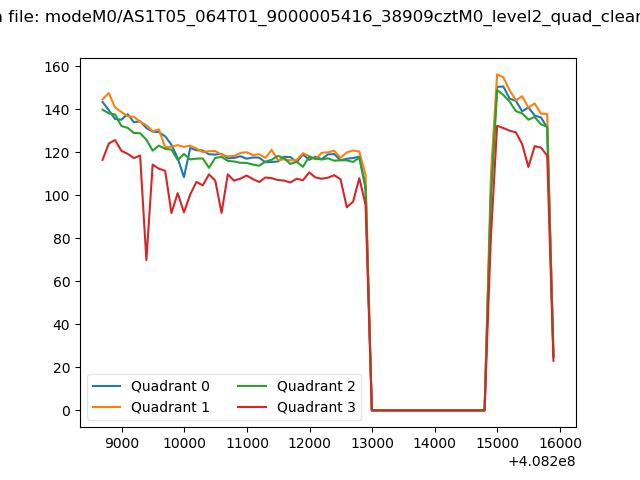 |
|
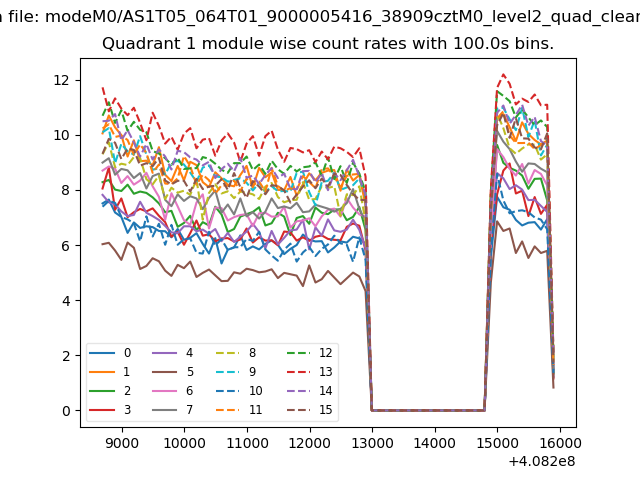
| Module-wise count rates for Quadrant A Data is divided into 100 sec bins |
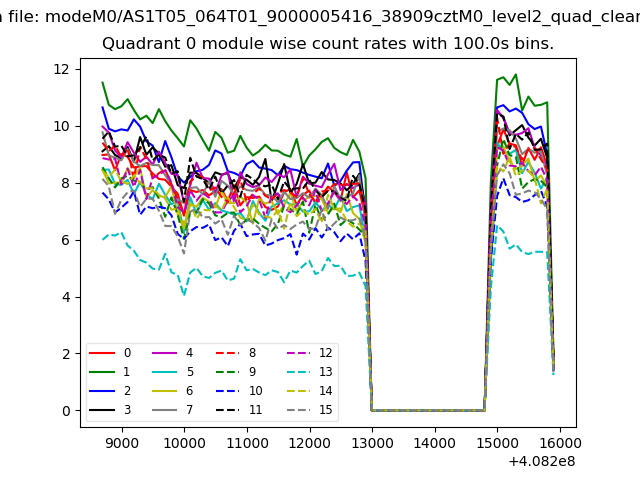 |
 |
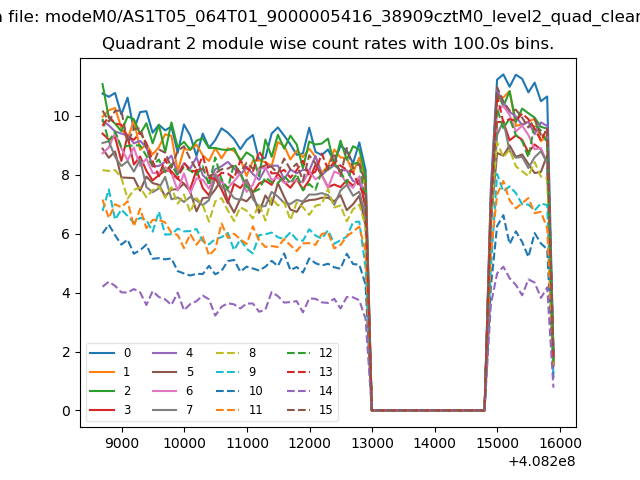
| Module-wise count rates for Quadrant B Data is divided into 100 sec bins |
 |
 |
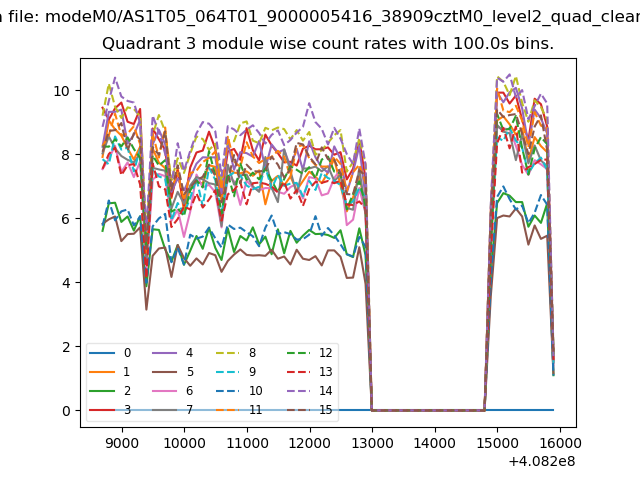
| Module-wise count rates for Quadrant C Data is divided into 100 sec bins |
 |
 |
| Module-wise count rates for Quadrant D Data is divided into 100 sec bins |
 |
 |
| Parameter | Plot |
|---|---|
| CZT HV Monitor | 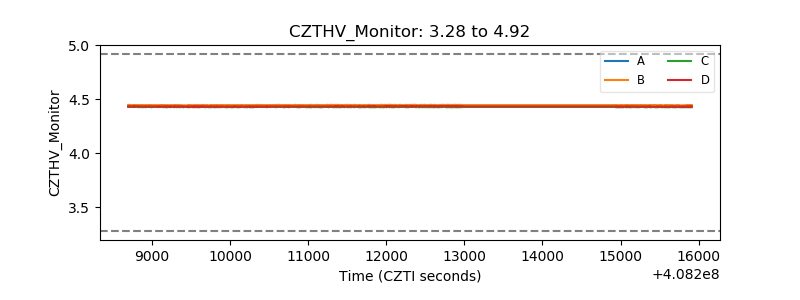 |
| D_VDD | 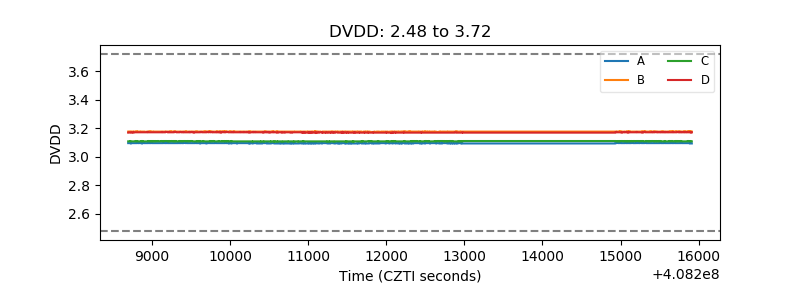 |
| Temperature 1 | 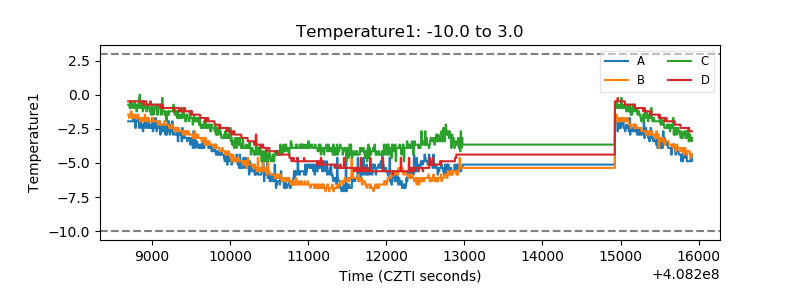 |
| Veto HV Monitor | 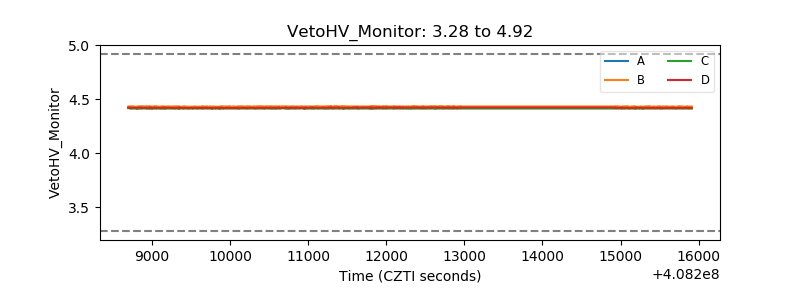 |
| Veto LLD | 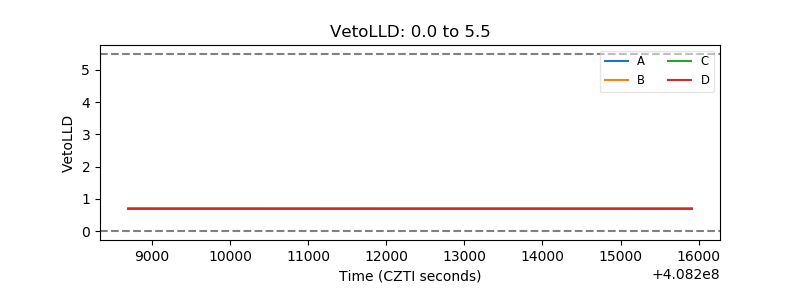 |
| Alpha Counter | 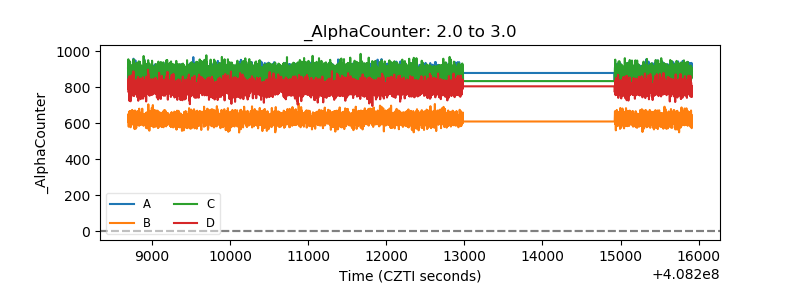 |
| _CPM_Rate | 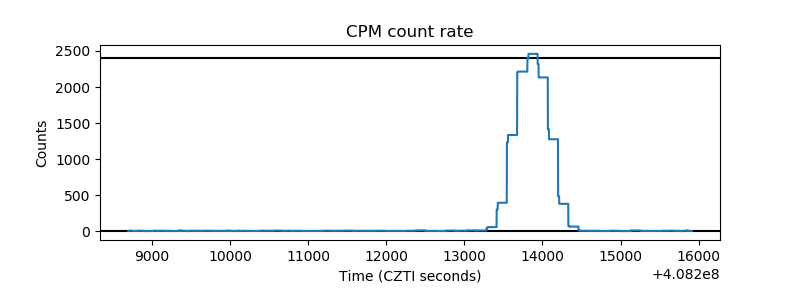 |
| CZT Counter | 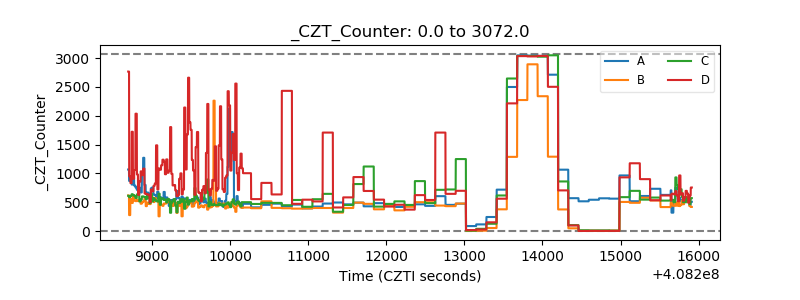 |
| +2.5 Volts monitor | 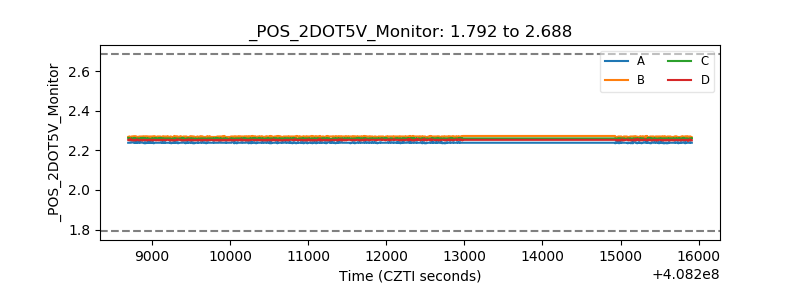 |
| +5 Volts monitor | 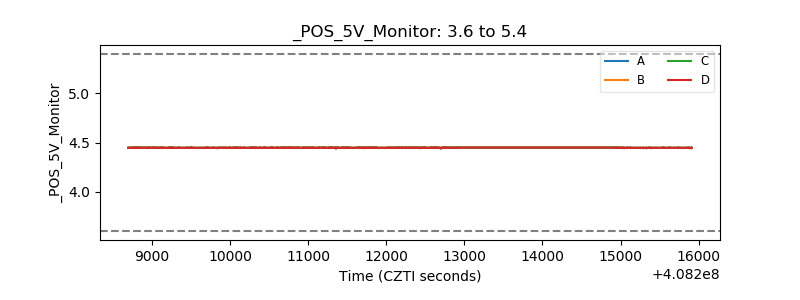 |
| _ROLL_ROT | 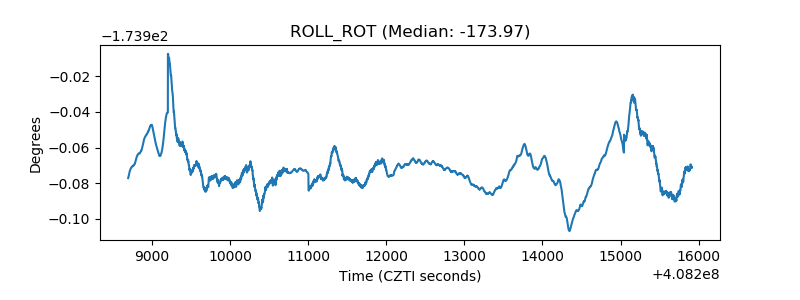 |
| _Roll_DEC | 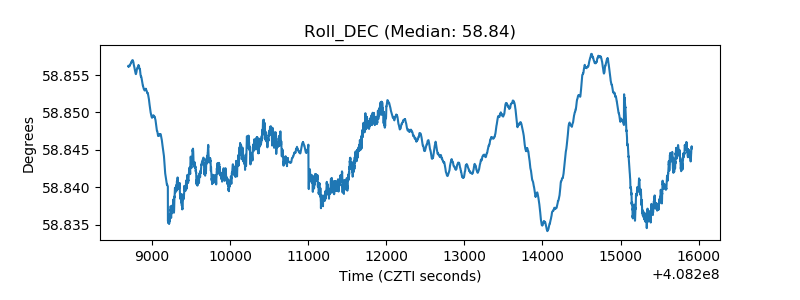 |
| _Roll_RA | 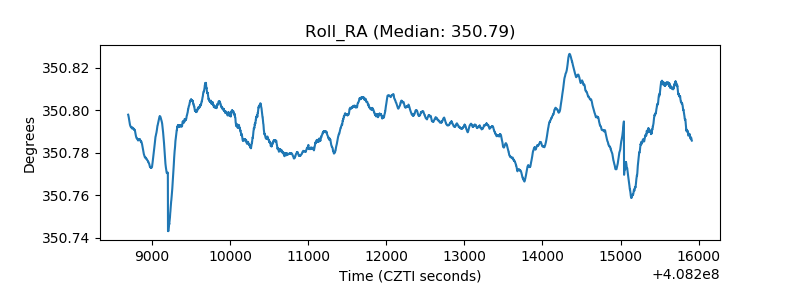 |
| Veto Counter | 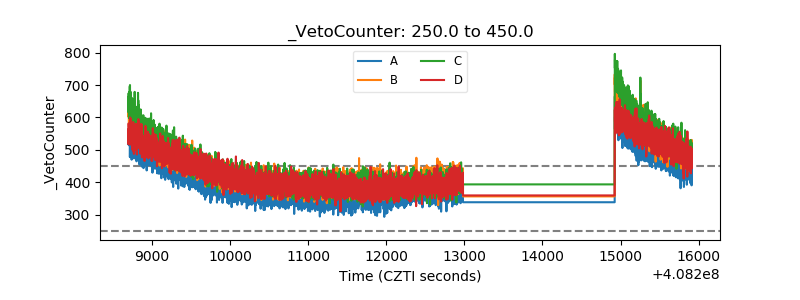 |