| Param | Original file | Final file |
|---|---|---|
| Filename | modeM0/AS1T05_064T01_9000005416_38910cztM0_level2.fits | modeM0/AS1T05_064T01_9000005416_38910cztM0_level2_quad_clean.evt |
| Size (bytes) | 345,182,400 | 95,837,760 |
| Size | 329.2 MB | 91.4 MB |
| Events in quadrant A | 3,285,989 | 652,769 |
| Events in quadrant B | 2,422,816 | 672,234 |
| Events in quadrant C | 2,651,481 | 649,259 |
| Events in quadrant D | 4,022,952 | 572,844 |
| Mode SS | |||
|---|---|---|---|
| Quadrant | BADHDUFLAG | Total packets | Discarded packets |
| A | 0 | 104 | 0 |
| B | 0 | 104 | 0 |
| C | 0 | 104 | 0 |
| D | 0 | 104 | 0 |
| Mode M9 | |||
|---|---|---|---|
| Quadrant | BADHDUFLAG | Total packets | Discarded packets |
| A | 0 | 25 | 0 |
| B | 0 | 25 | 0 |
| C | 0 | 25 | 0 |
| D | 0 | 26 | 0 |
| Mode M0 | |||
|---|---|---|---|
| Quadrant | BADHDUFLAG | Total packets | Discarded packets |
| A | 0 | 12991 | 3 |
| B | 0 | 10369 | 2 |
| C | 0 | 10859 | 2 |
| D | 0 | 15446 | 2 |
| Quadrant | Total seconds | Saturated seconds | Saturation percentage |
|---|---|---|---|
| A | 5066 | 31 | 0.611923% |
| B | 5066 | 7 | 0.138176% |
| C | 5066 | 21 | 0.414528% |
| D | 5066 | 262 | 5.171733% |
Noise dominated data is calculated using 1-second bins in cleaned event files. If a bin has >2000 counts, and if more than 50% of those come from <1% of pixels, then it is considered to be noise-dominated and hence unusable.
| Quadrant | # 1 sec bins | Bins with >0 counts | Bins with >2000 counts | High rate bins dominated by noise | Noise dominated (total time) | Noise dominated (detector-on time) | Marked lightcurve |
|---|---|---|---|---|---|---|---|
| A | 7098 | 5067 | 19 | 19 | 0.27% | 0.37% | 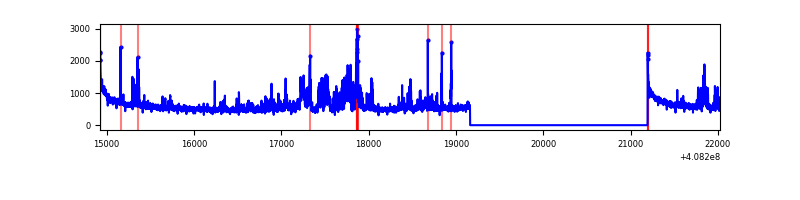 |
| B | 7098 | 5067 | 0 | 0 | 0.00% | 0.00% | 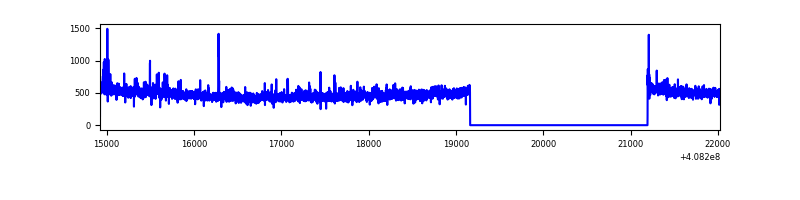 |
| C | 7098 | 5067 | 11 | 11 | 0.15% | 0.22% | 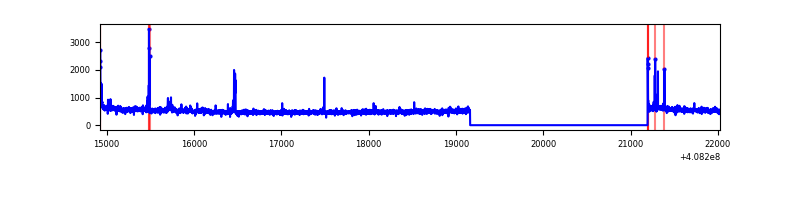 |
| D | 7098 | 5067 | 243 | 243 | 3.42% | 4.80% | 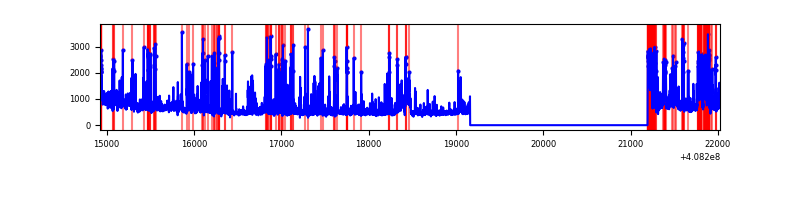 |
Top three noisy pixels from each quadrant. If the there are fewer than three noisy pixels in the level2.evt file, extra rows are filled as -1
| Pixel properties | Quadrant properties | ||||||
|---|---|---|---|---|---|---|---|
| Quadrant | DetID | PixID | Counts | Sigma | Mean | Median | Sigma |
| A | 10 | 83 | 424995 | 3566.53 | 592 | 580 | 119.0 |
| A | 12 | 16 | 348021 | 2919.68 | 592 | 580 | 119.0 |
| A | 13 | 248 | 118736 | 992.91 | 592 | 580 | 119.0 |
| B | 0 | 230 | 43284 | 386.55 | 594 | 580 | 110.5 |
| B | 0 | 155 | 17384 | 152.11 | 594 | 580 | 110.5 |
| B | 12 | 111 | 13021 | 112.61 | 594 | 580 | 110.5 |
| C | 15 | 214 | 223814 | 1629.08 | 593 | 599 | 137.0 |
| C | 14 | 254 | 68942 | 498.78 | 593 | 599 | 137.0 |
| C | 0 | 10 | 21001 | 148.9 | 593 | 599 | 137.0 |
| D | 2 | 249 | 467632 | 3383.23 | 576 | 560 | 138.1 |
| D | 12 | 235 | 379629 | 2745.79 | 576 | 560 | 138.1 |
| D | 2 | 250 | 320714 | 2319.03 | 576 | 560 | 138.1 |
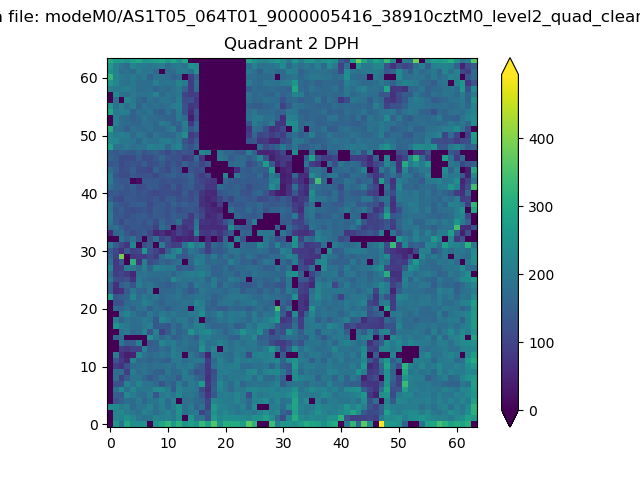
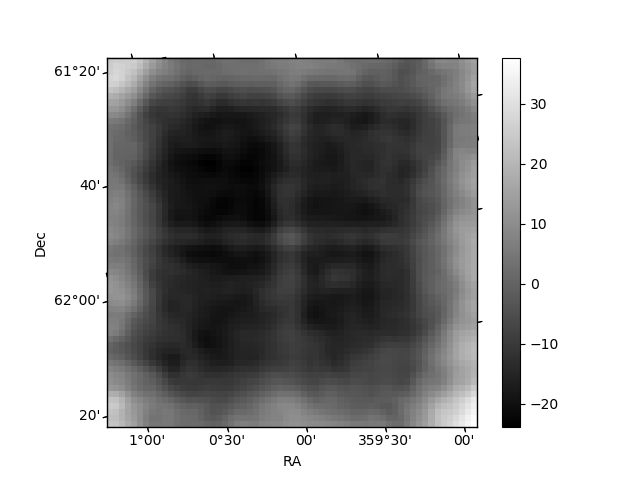
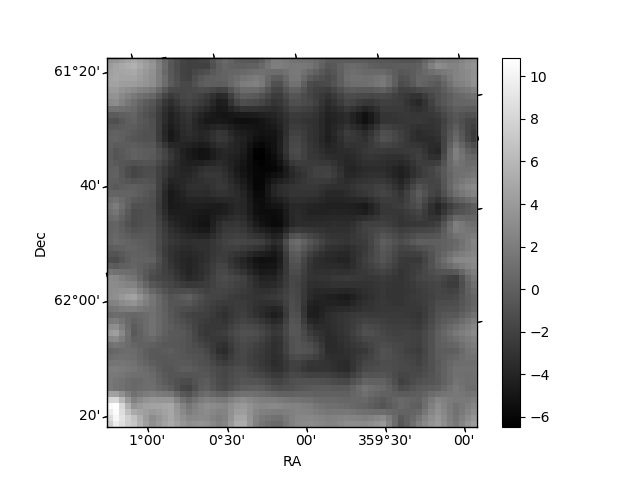
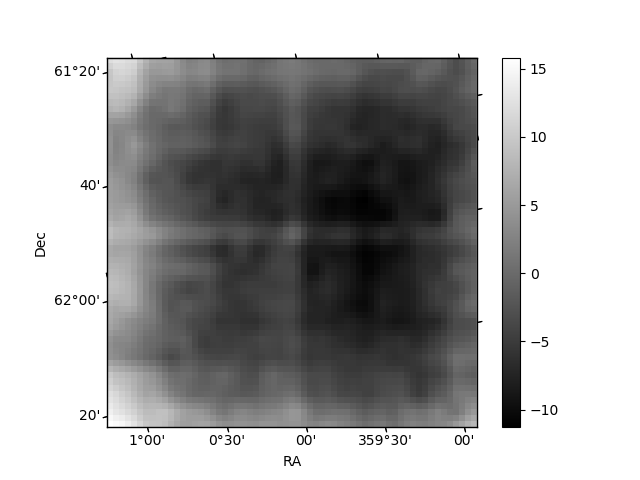
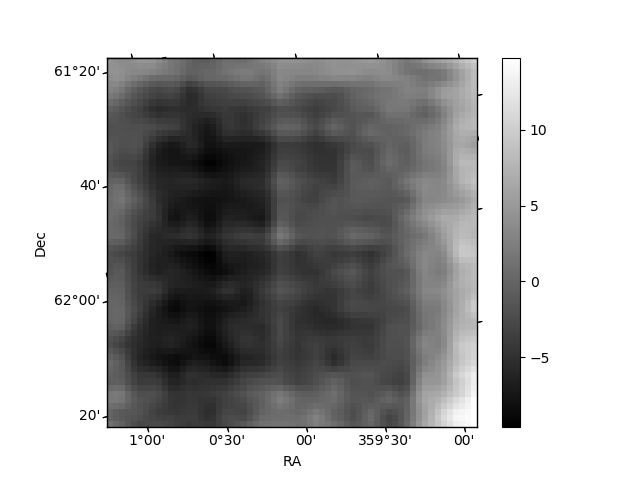
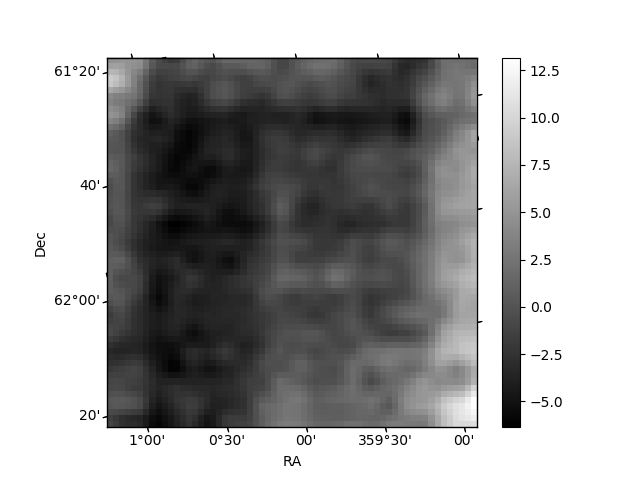
Histogram calculated using DETX and DETY for each event in the final _common_clean file
| Quadrant A | 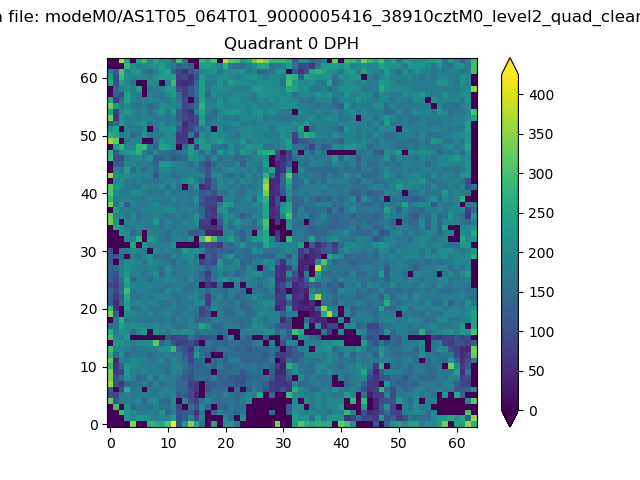 |
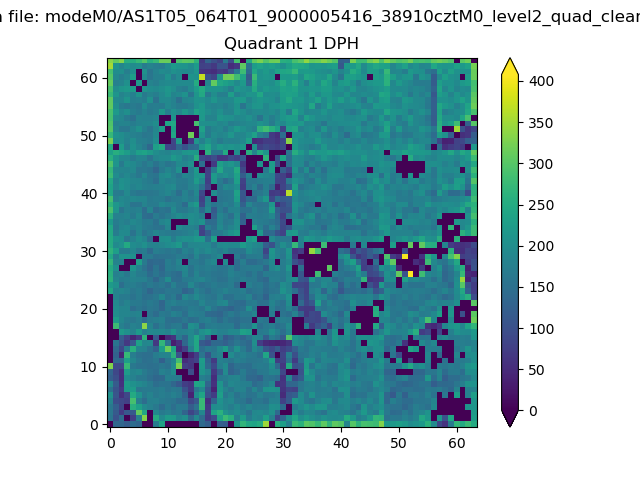 |
Quadrant B |
|---|---|---|---|
| Quadrant D | 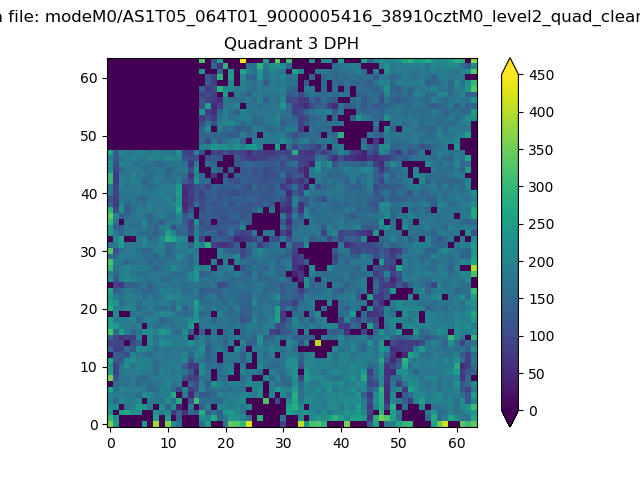 |
 |
Quadrant C |
| Plot type | Count rate plots | Images |
|---|---|---|
| Comparison with Poisson distribution Blue bars denote a histogram of data divided into 1 sec bins. Red curve is a Poisson curve with rate = median count rate of data. |
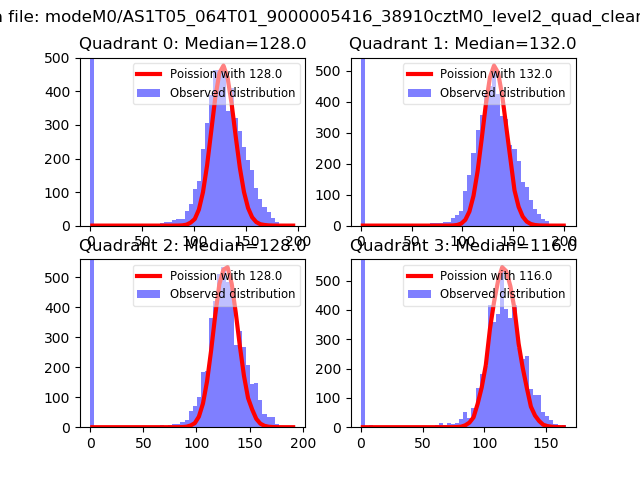 |
 |
| Quadrant-wise count rates Data is divided into 100 sec bins |
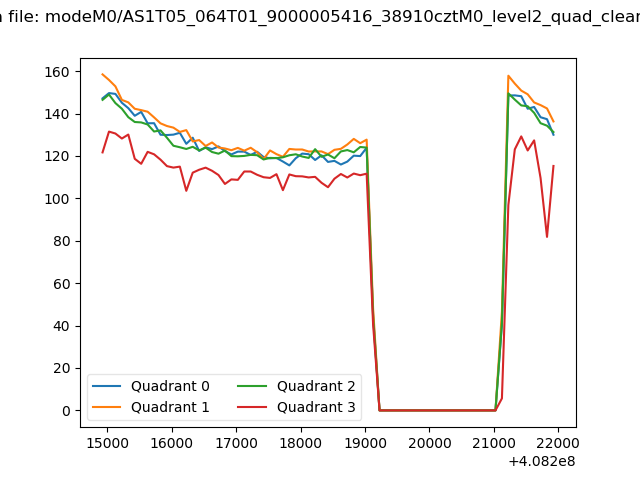 |
|
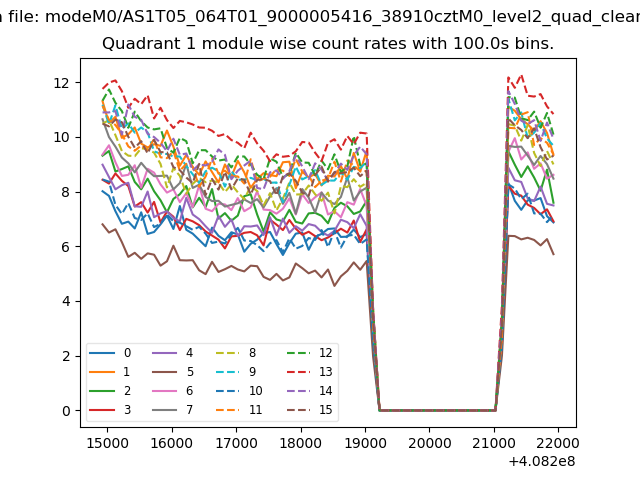
| Module-wise count rates for Quadrant A Data is divided into 100 sec bins |
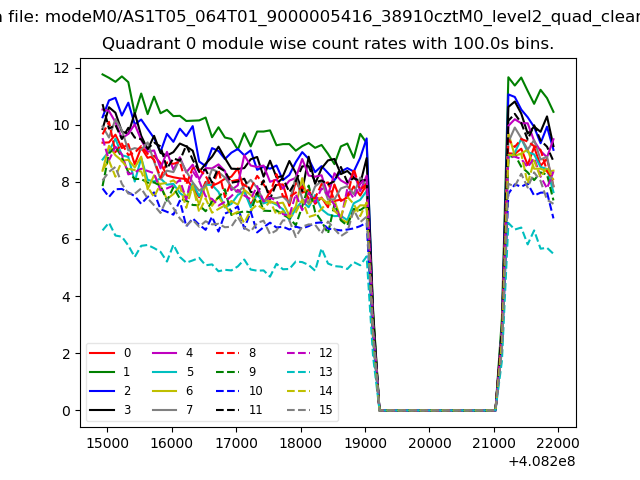 |
 |
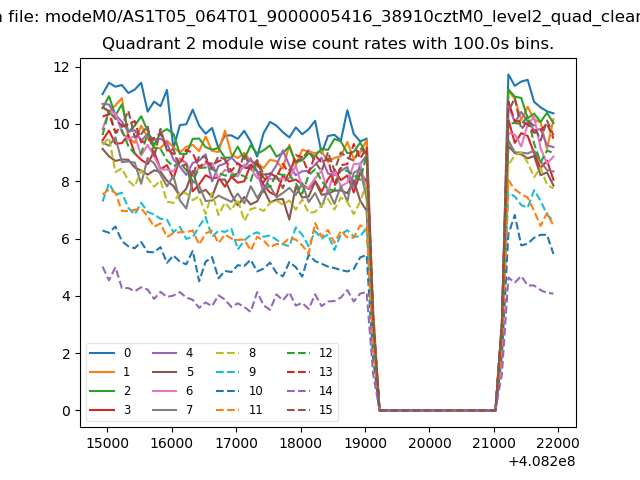
| Module-wise count rates for Quadrant B Data is divided into 100 sec bins |
 |
 |
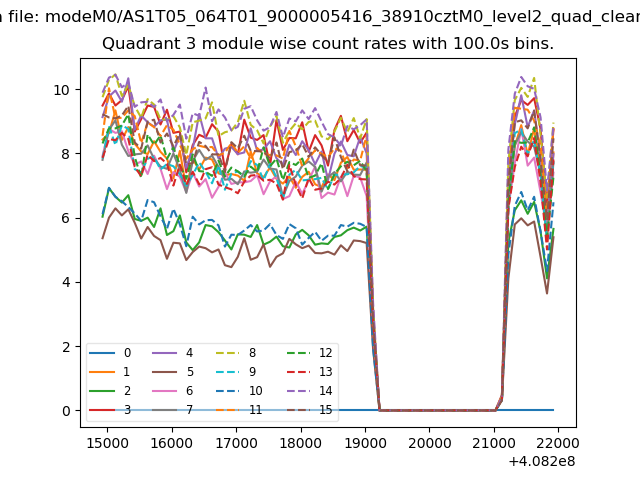
| Module-wise count rates for Quadrant C Data is divided into 100 sec bins |
 |
 |
| Module-wise count rates for Quadrant D Data is divided into 100 sec bins |
 |
 |
| Parameter | Plot |
|---|---|
| CZT HV Monitor | 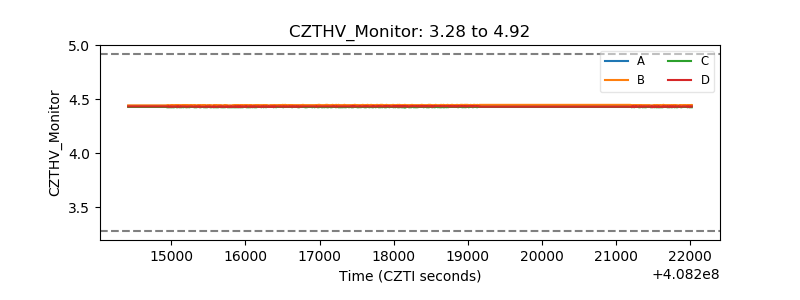 |
| D_VDD | 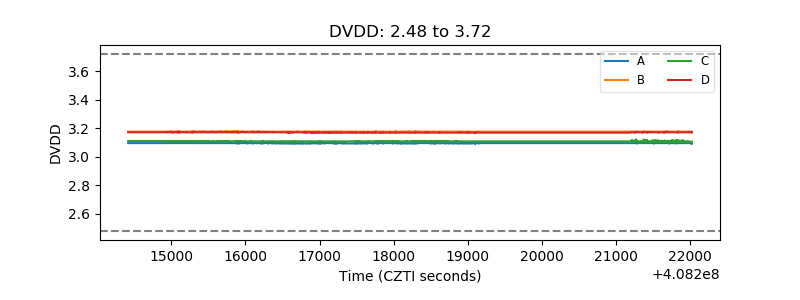 |
| Temperature 1 | 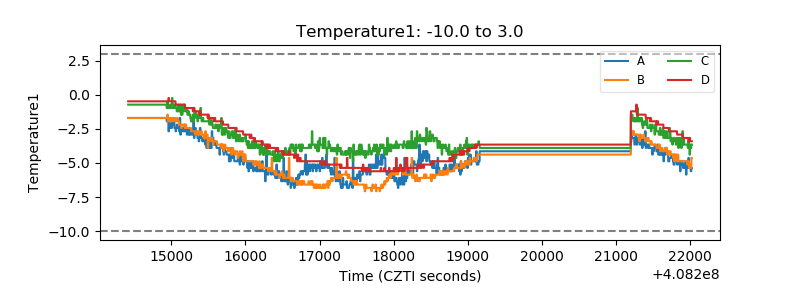 |
| Veto HV Monitor | 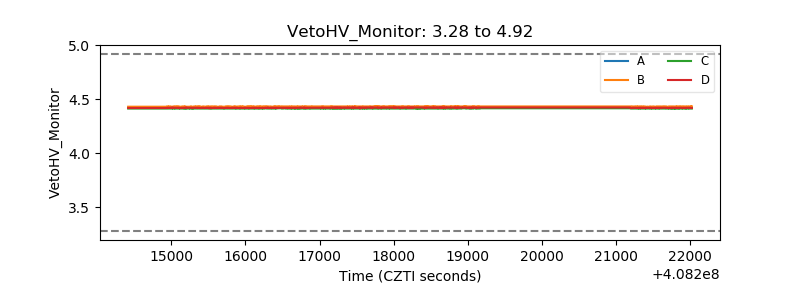 |
| Veto LLD | 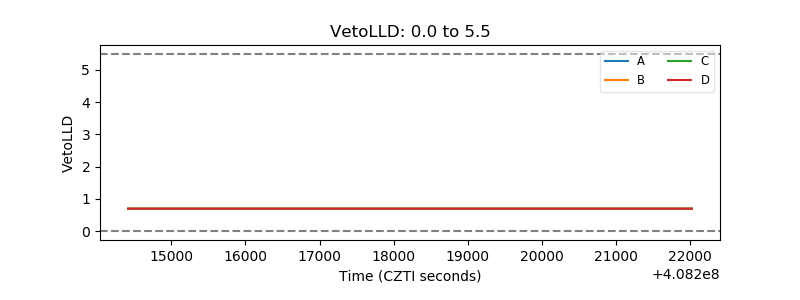 |
| Alpha Counter | 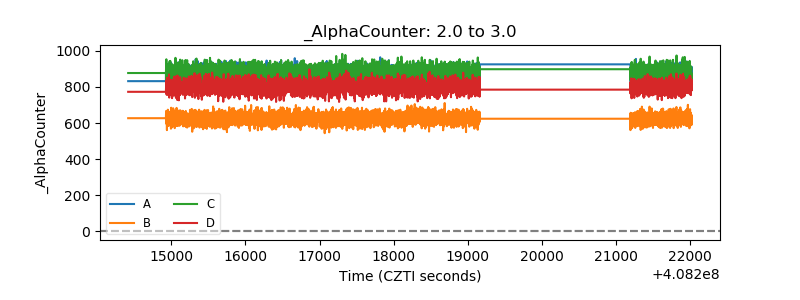 |
| _CPM_Rate | 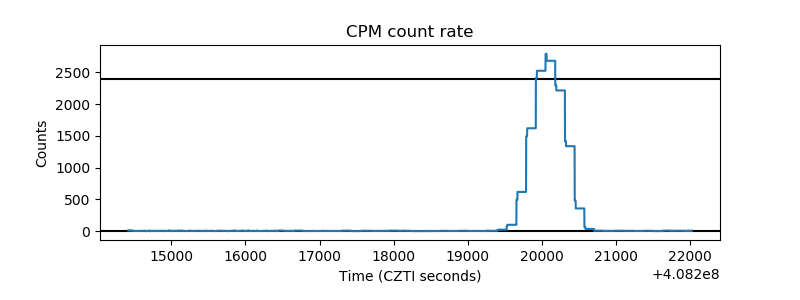 |
| CZT Counter | 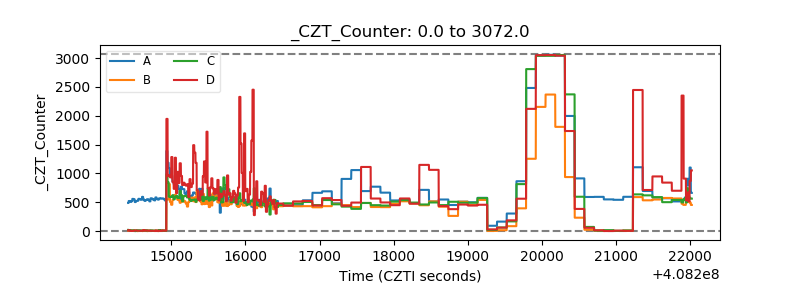 |
| +2.5 Volts monitor | 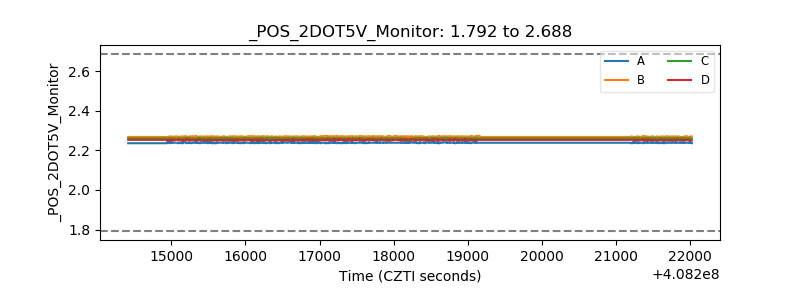 |
| +5 Volts monitor | 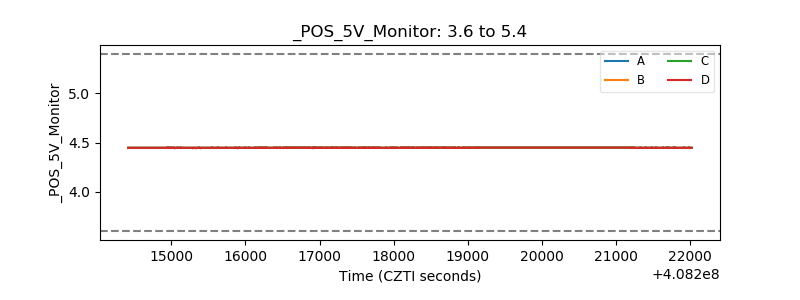 |
| _ROLL_ROT | 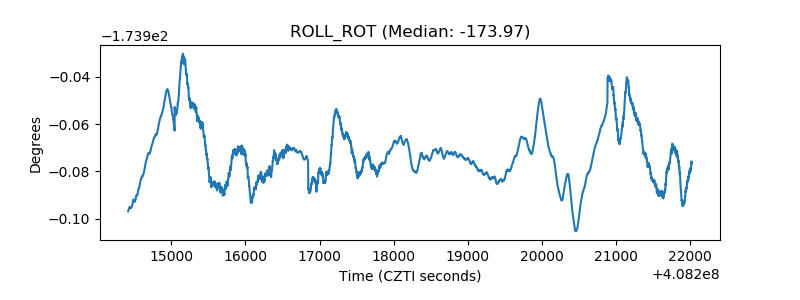 |
| _Roll_DEC | 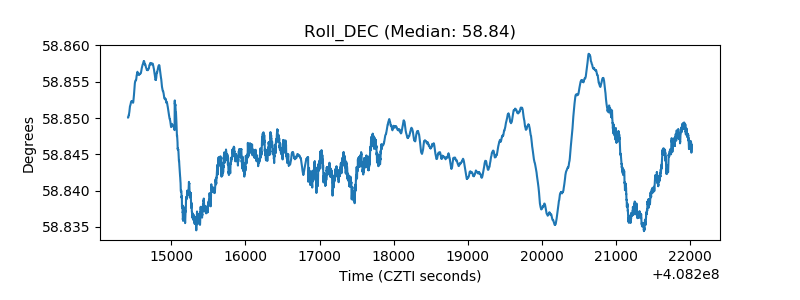 |
| _Roll_RA | 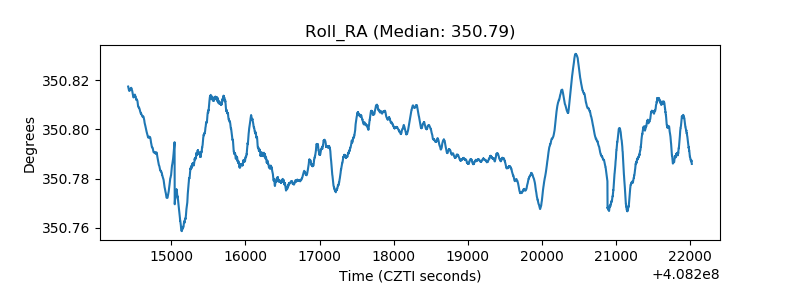 |
| Veto Counter | 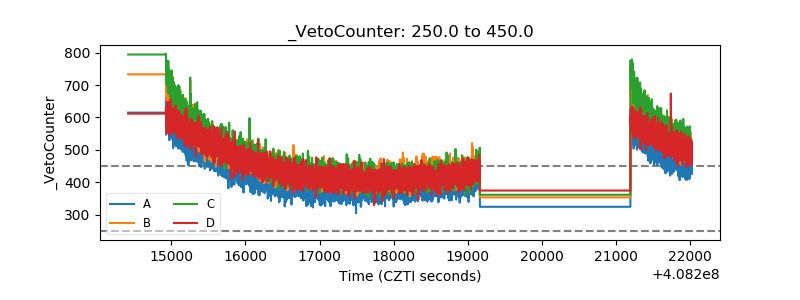 |