| Param | Original file | Final file |
|---|---|---|
| Filename | modeM0/AS1T05_064T01_9000005416_38911cztM0_level2.fits | modeM0/AS1T05_064T01_9000005416_38911cztM0_level2_quad_clean.evt |
| Size (bytes) | 335,525,760 | 90,239,040 |
| Size | 320.0 MB | 86.1 MB |
| Events in quadrant A | 3,062,335 | 608,407 |
| Events in quadrant B | 2,254,009 | 636,157 |
| Events in quadrant C | 2,447,796 | 615,003 |
| Events in quadrant D | 4,281,179 | 535,124 |
| Mode SS | |||
|---|---|---|---|
| Quadrant | BADHDUFLAG | Total packets | Discarded packets |
| A | 0 | 100 | 0 |
| B | 0 | 100 | 0 |
| C | 0 | 100 | 0 |
| D | 0 | 100 | 0 |
| Mode M9 | |||
|---|---|---|---|
| Quadrant | BADHDUFLAG | Total packets | Discarded packets |
| A | 0 | 31 | 0 |
| B | 0 | 31 | 0 |
| C | 0 | 31 | 0 |
| D | 0 | 32 | 0 |
| Mode M0 | |||
|---|---|---|---|
| Quadrant | BADHDUFLAG | Total packets | Discarded packets |
| A | 0 | 12145 | 3 |
| B | 0 | 9764 | 2 |
| C | 0 | 10037 | 2 |
| D | 0 | 16027 | 2 |
| Quadrant | Total seconds | Saturated seconds | Saturation percentage |
|---|---|---|---|
| A | 4811 | 61 | 1.267928% |
| B | 4811 | 5 | 0.103928% |
| C | 4811 | 14 | 0.291000% |
| D | 4811 | 329 | 6.838495% |
Noise dominated data is calculated using 1-second bins in cleaned event files. If a bin has >2000 counts, and if more than 50% of those come from <1% of pixels, then it is considered to be noise-dominated and hence unusable.
| Quadrant | # 1 sec bins | Bins with >0 counts | Bins with >2000 counts | High rate bins dominated by noise | Noise dominated (total time) | Noise dominated (detector-on time) | Marked lightcurve |
|---|---|---|---|---|---|---|---|
| A | 6934 | 4812 | 47 | 47 | 0.68% | 0.98% | 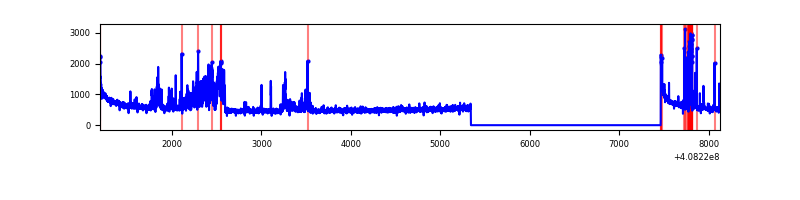 |
| B | 6934 | 4812 | 0 | 0 | 0.00% | 0.00% | 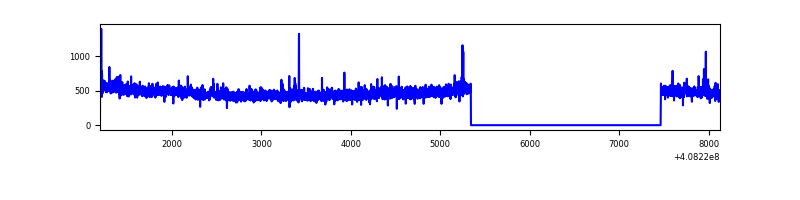 |
| C | 6934 | 4812 | 8 | 8 | 0.12% | 0.17% | 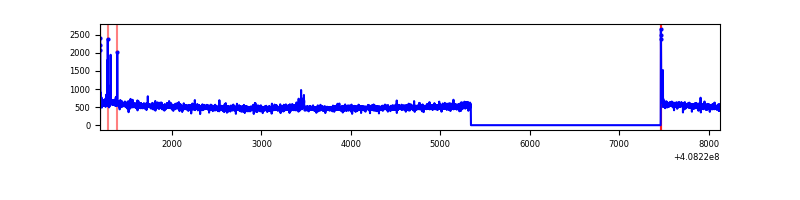 |
| D | 6934 | 4812 | 302 | 302 | 4.36% | 6.28% | 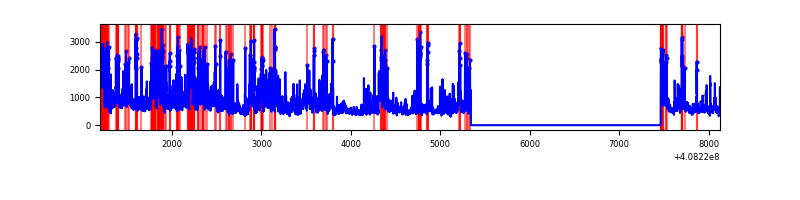 |
Top three noisy pixels from each quadrant. If the there are fewer than three noisy pixels in the level2.evt file, extra rows are filled as -1
| Pixel properties | Quadrant properties | ||||||
|---|---|---|---|---|---|---|---|
| Quadrant | DetID | PixID | Counts | Sigma | Mean | Median | Sigma |
| A | 10 | 83 | 390079 | 3523.24 | 553 | 543 | 110.6 |
| A | 12 | 16 | 327288 | 2955.31 | 553 | 543 | 110.6 |
| A | 9 | 143 | 119021 | 1071.6 | 553 | 543 | 110.6 |
| B | 0 | 230 | 42066 | 394.17 | 560 | 546 | 105.3 |
| B | 12 | 111 | 12338 | 111.95 | 560 | 546 | 105.3 |
| B | 11 | 111 | 11403 | 103.07 | 560 | 546 | 105.3 |
| C | 15 | 214 | 213995 | 1654.12 | 559 | 564 | 129.0 |
| C | 0 | 10 | 25429 | 192.71 | 559 | 564 | 129.0 |
| C | 0 | 207 | 12512 | 92.6 | 559 | 564 | 129.0 |
| D | 12 | 227 | 560772 | 4320.1 | 535 | 520 | 129.7 |
| D | 2 | 249 | 473489 | 3647.06 | 535 | 520 | 129.7 |
| D | 12 | 235 | 308007 | 2371.03 | 535 | 520 | 129.7 |
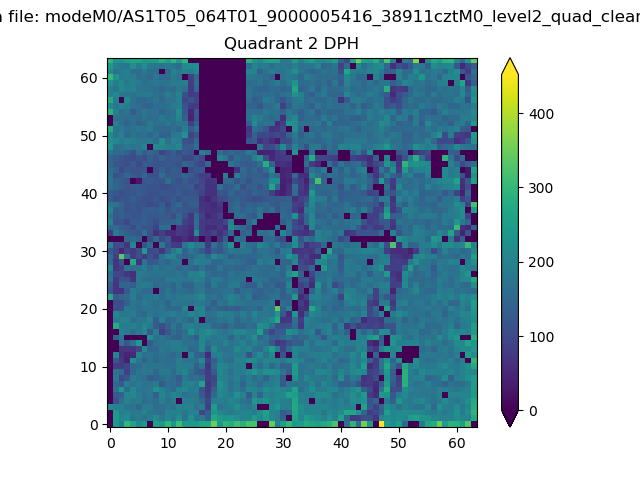
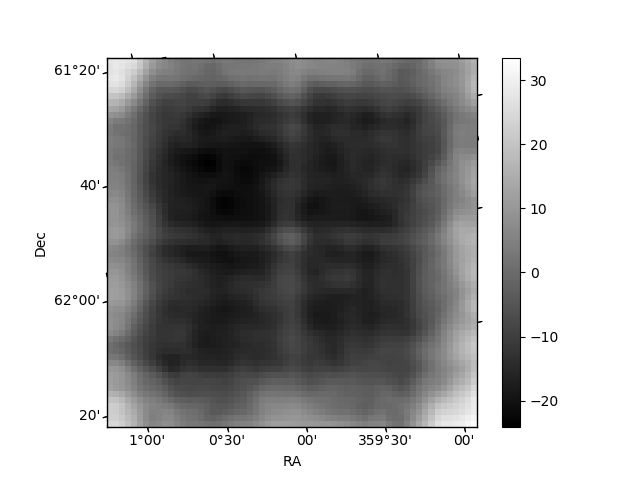
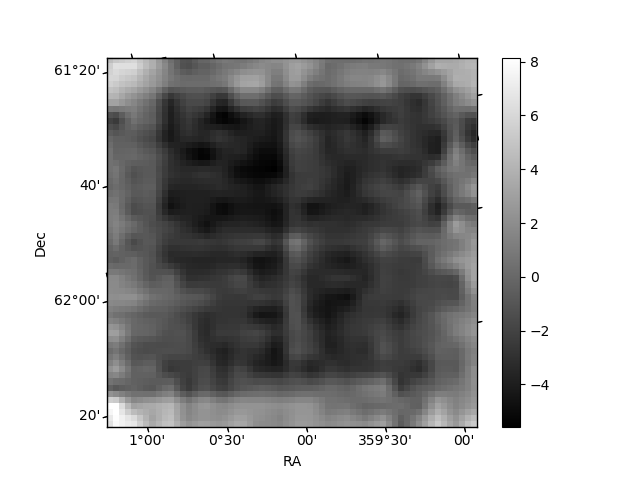
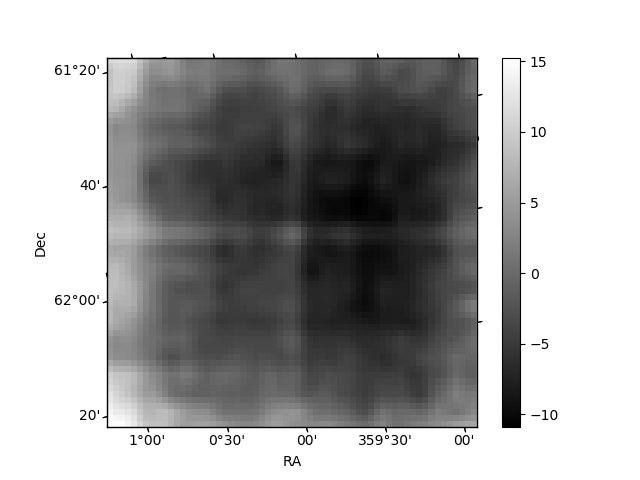
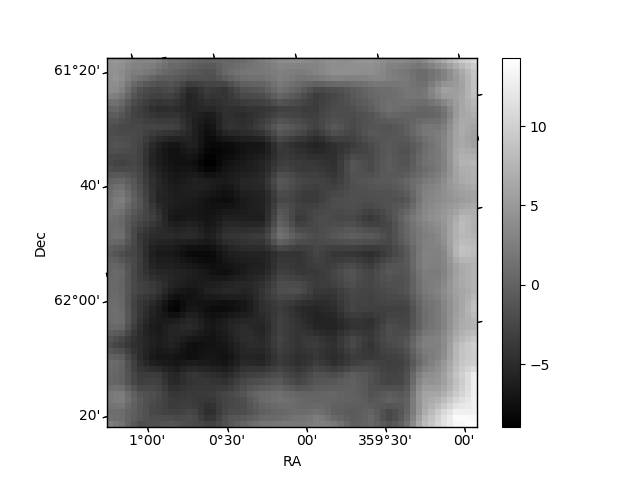
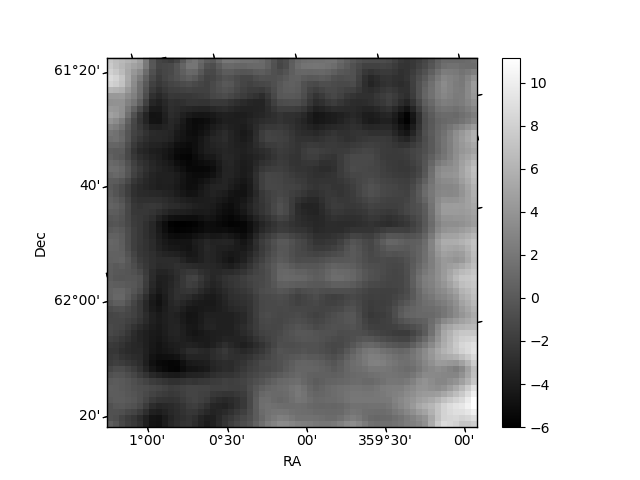
Histogram calculated using DETX and DETY for each event in the final _common_clean file
| Quadrant A | 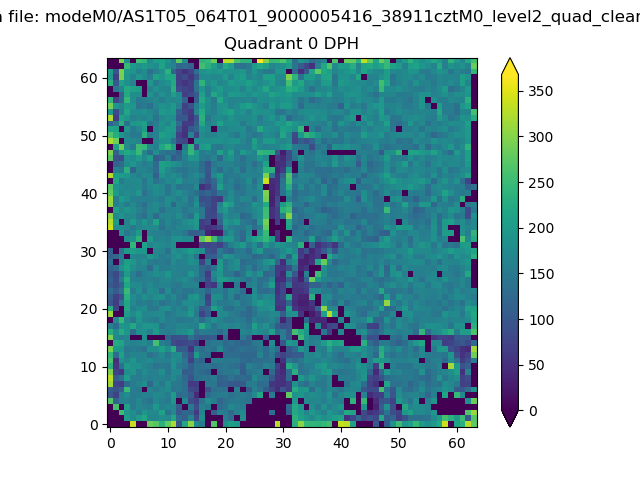 |
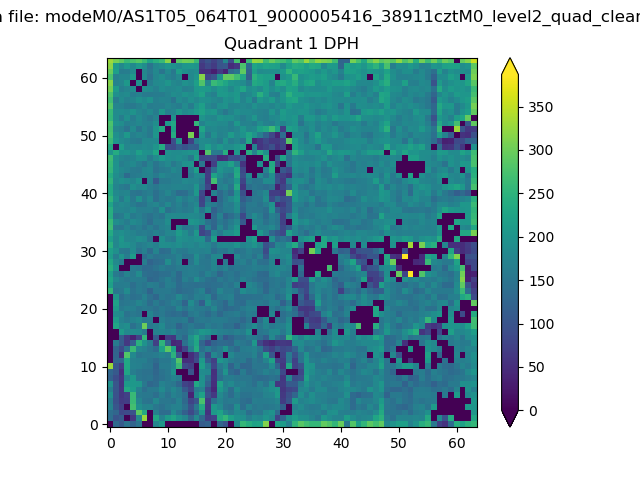 |
Quadrant B |
|---|---|---|---|
| Quadrant D | 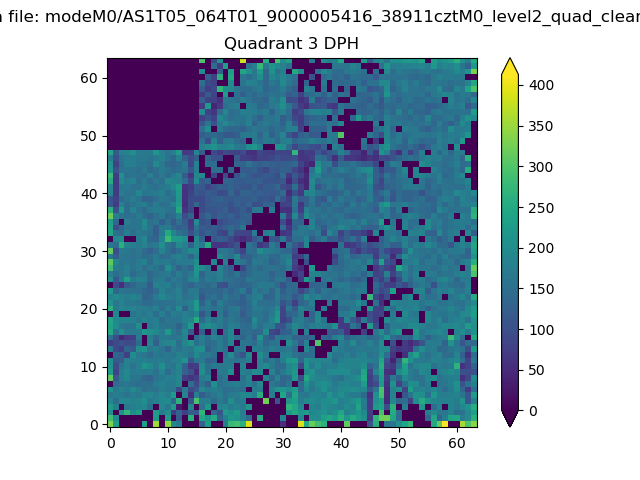 |
 |
Quadrant C |
| Plot type | Count rate plots | Images |
|---|---|---|
| Comparison with Poisson distribution Blue bars denote a histogram of data divided into 1 sec bins. Red curve is a Poisson curve with rate = median count rate of data. |
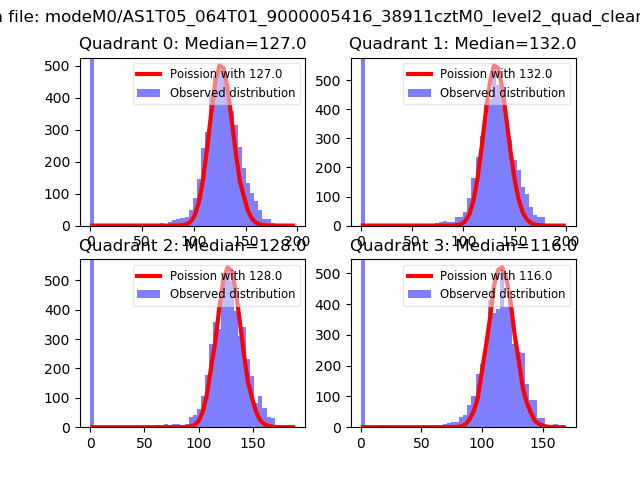 |
 |
| Quadrant-wise count rates Data is divided into 100 sec bins |
 |
|
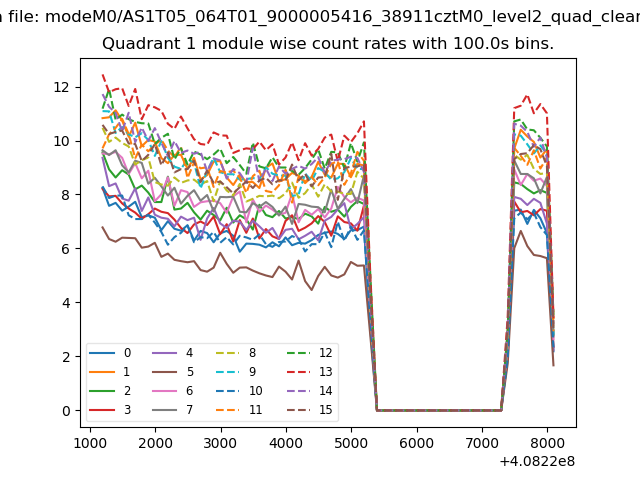
| Module-wise count rates for Quadrant A Data is divided into 100 sec bins |
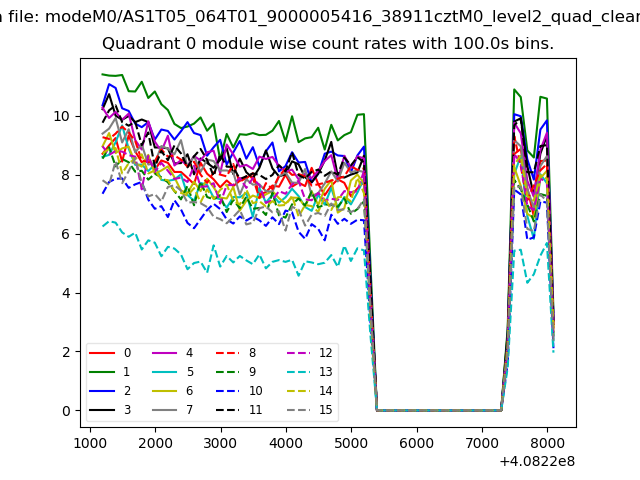 |
 |
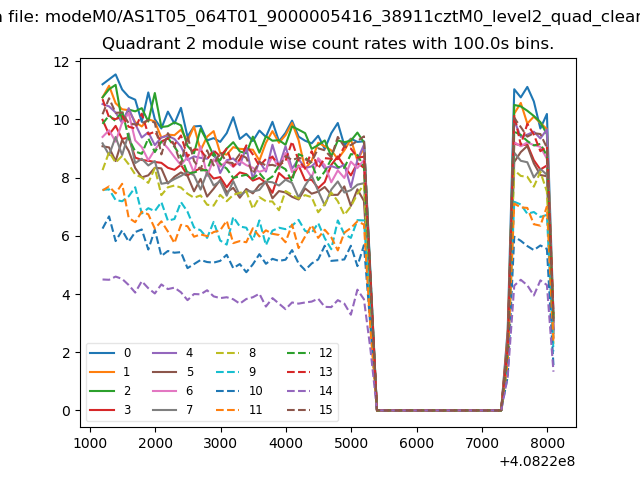
| Module-wise count rates for Quadrant B Data is divided into 100 sec bins |
 |
 |
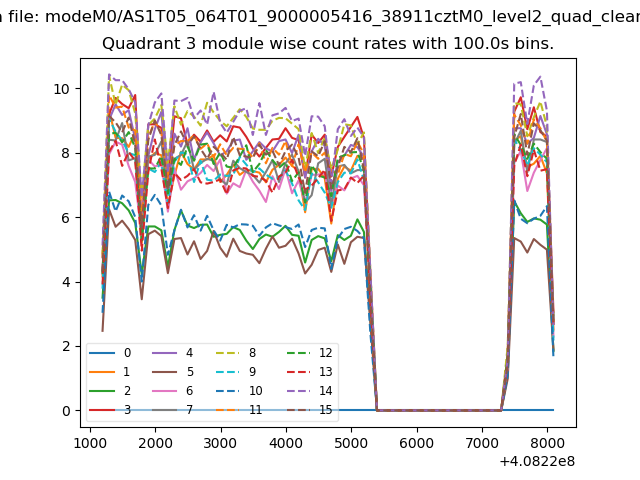
| Module-wise count rates for Quadrant C Data is divided into 100 sec bins |
 |
 |
| Module-wise count rates for Quadrant D Data is divided into 100 sec bins |
 |
 |
| Parameter | Plot |
|---|---|
| CZT HV Monitor | 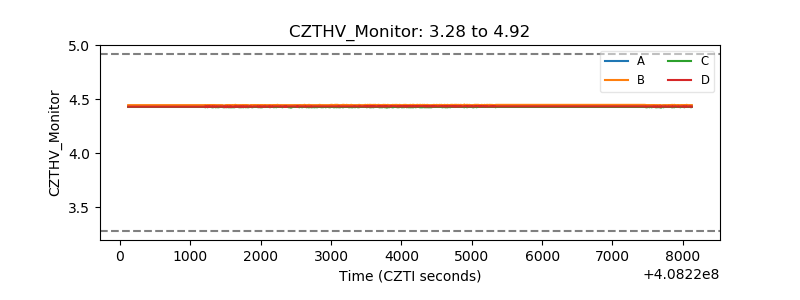 |
| D_VDD | 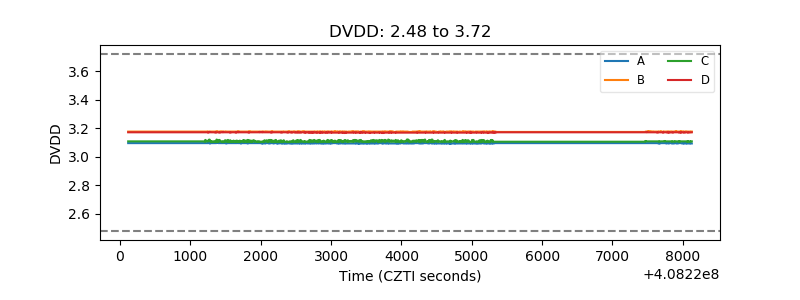 |
| Temperature 1 | 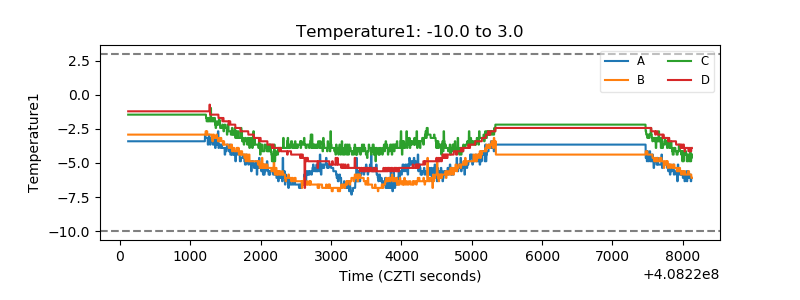 |
| Veto HV Monitor | 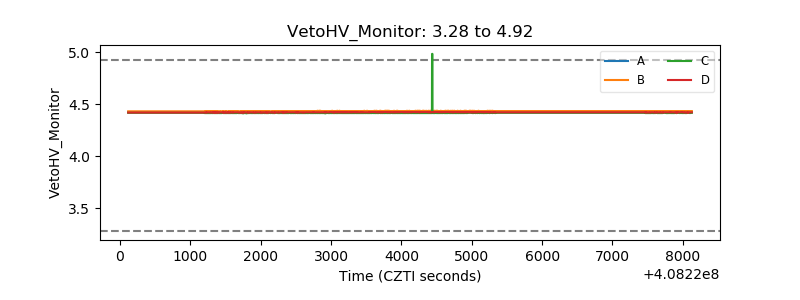 |
| Veto LLD | 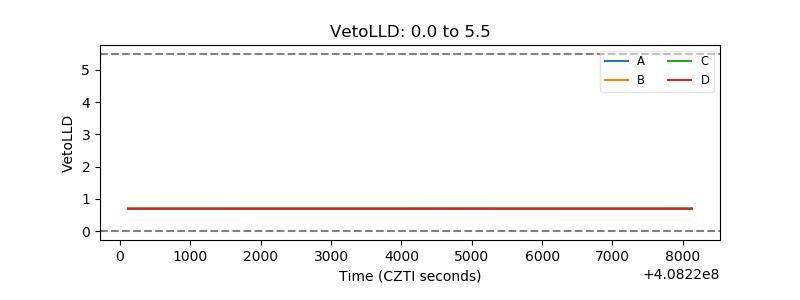 |
| Alpha Counter | 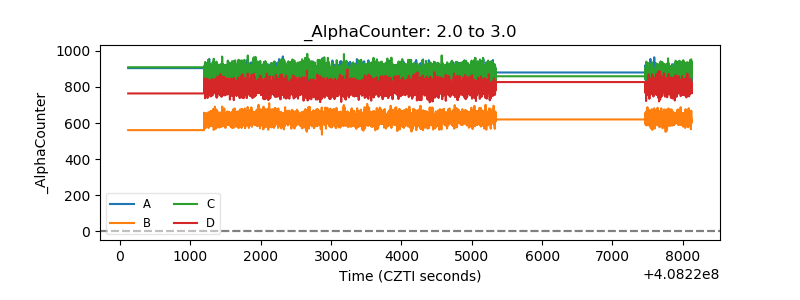 |
| _CPM_Rate | 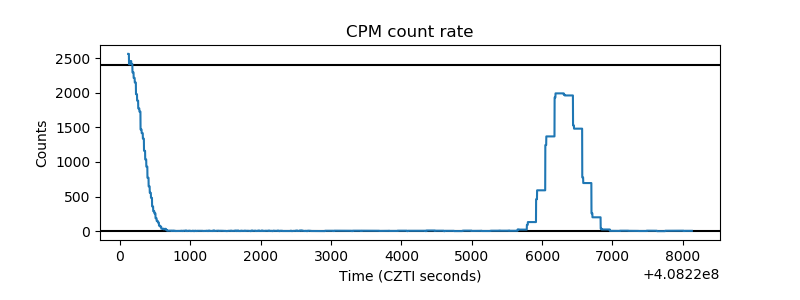 |
| CZT Counter | 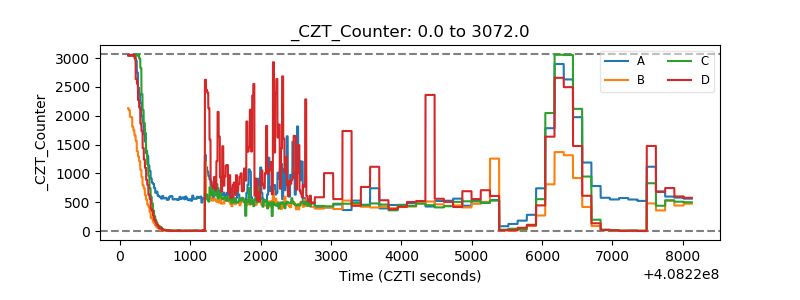 |
| +2.5 Volts monitor | 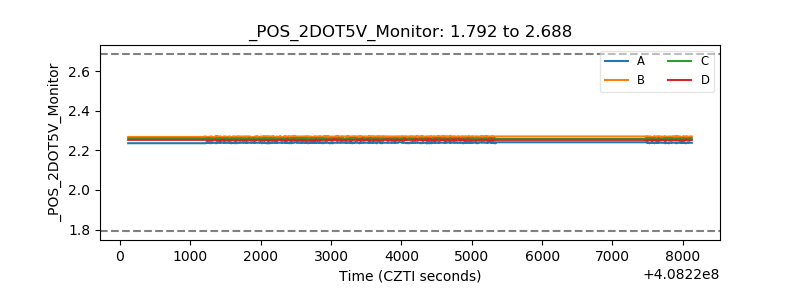 |
| +5 Volts monitor | 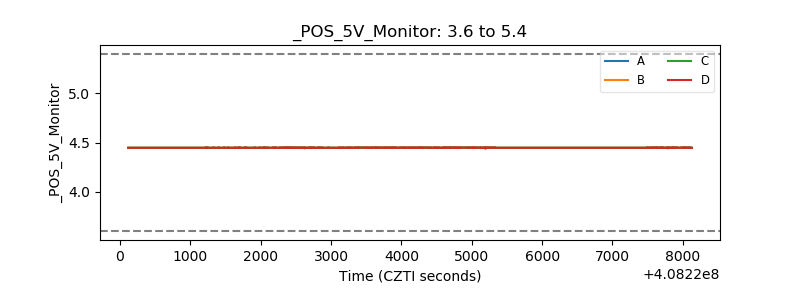 |
| _ROLL_ROT | 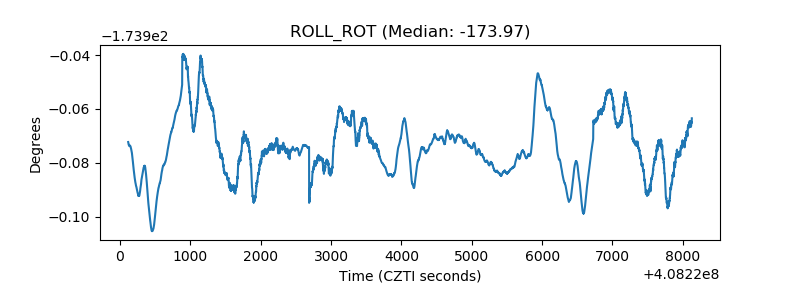 |
| _Roll_DEC | 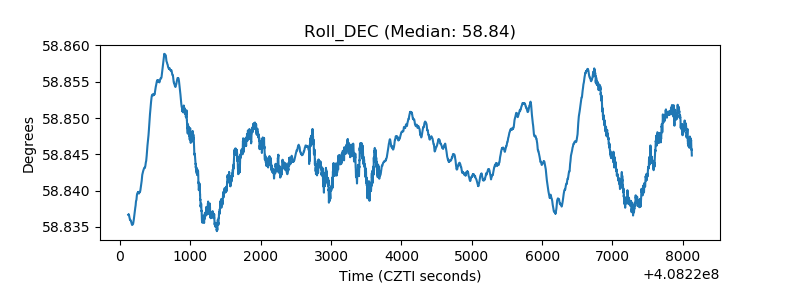 |
| _Roll_RA | 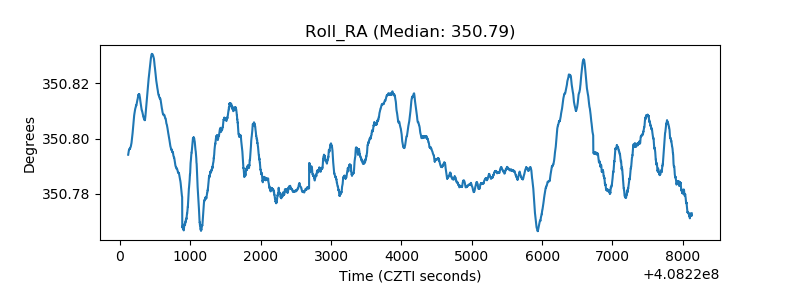 |
| Veto Counter | 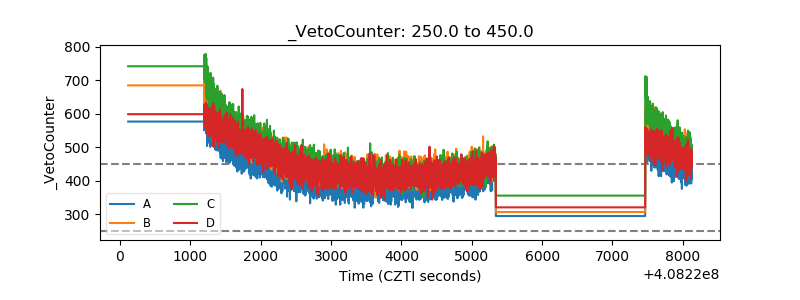 |