| Param | Original file | Final file |
|---|---|---|
| Filename | modeM0/AS1T05_064T01_9000005416_38912cztM0_level2.fits | modeM0/AS1T05_064T01_9000005416_38912cztM0_level2_quad_clean.evt |
| Size (bytes) | 298,782,720 | 88,678,080 |
| Size | 284.9 MB | 84.6 MB |
| Events in quadrant A | 2,882,959 | 589,291 |
| Events in quadrant B | 2,246,865 | 618,758 |
| Events in quadrant C | 2,390,549 | 598,905 |
| Events in quadrant D | 3,157,094 | 534,305 |
| Mode SS | |||
|---|---|---|---|
| Quadrant | BADHDUFLAG | Total packets | Discarded packets |
| A | 0 | 100 | 0 |
| B | 0 | 100 | 0 |
| C | 0 | 100 | 0 |
| D | 0 | 100 | 0 |
| Mode M9 | |||
|---|---|---|---|
| Quadrant | BADHDUFLAG | Total packets | Discarded packets |
| A | 0 | 38 | 0 |
| B | 0 | 38 | 0 |
| C | 0 | 38 | 0 |
| D | 0 | 39 | 0 |
| Mode M0 | |||
|---|---|---|---|
| Quadrant | BADHDUFLAG | Total packets | Discarded packets |
| A | 0 | 11616 | 3 |
| B | 0 | 9957 | 2 |
| C | 0 | 10000 | 2 |
| D | 0 | 12670 | 2 |
| Quadrant | Total seconds | Saturated seconds | Saturation percentage |
|---|---|---|---|
| A | 4904 | 67 | 1.366232% |
| B | 4904 | 8 | 0.163132% |
| C | 4904 | 12 | 0.244698% |
| D | 4904 | 166 | 3.384992% |
Noise dominated data is calculated using 1-second bins in cleaned event files. If a bin has >2000 counts, and if more than 50% of those come from <1% of pixels, then it is considered to be noise-dominated and hence unusable.
| Quadrant | # 1 sec bins | Bins with >0 counts | Bins with >2000 counts | High rate bins dominated by noise | Noise dominated (total time) | Noise dominated (detector-on time) | Marked lightcurve |
|---|---|---|---|---|---|---|---|
| A | 7057 | 4905 | 47 | 47 | 0.67% | 0.96% | 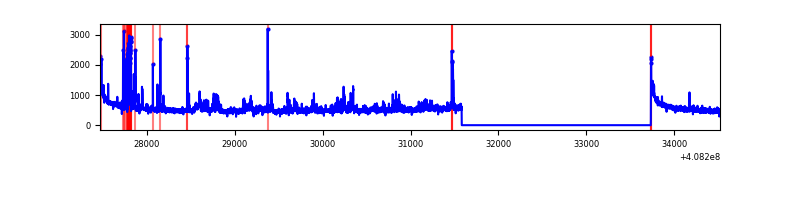 |
| B | 7057 | 4905 | 2 | 2 | 0.03% | 0.04% | 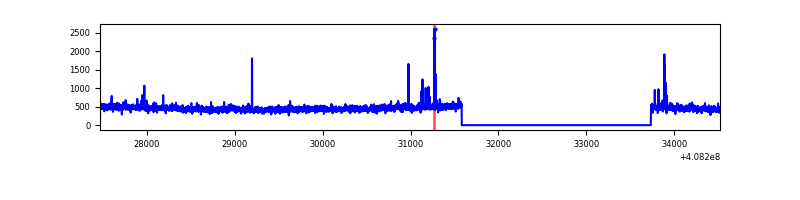 |
| C | 7057 | 4905 | 5 | 5 | 0.07% | 0.10% | 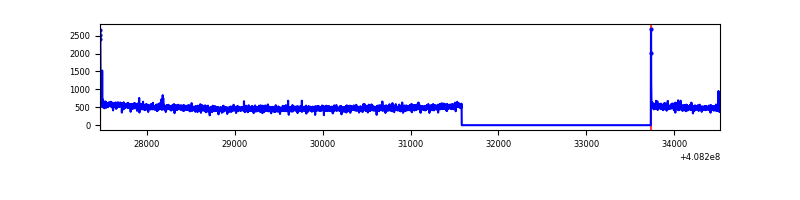 |
| D | 7057 | 4905 | 141 | 141 | 2.00% | 2.87% | 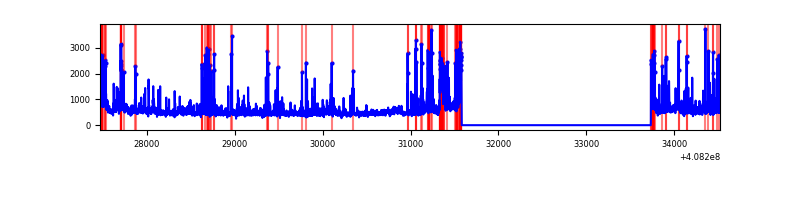 |
Top three noisy pixels from each quadrant. If the there are fewer than three noisy pixels in the level2.evt file, extra rows are filled as -1
| Pixel properties | Quadrant properties | ||||||
|---|---|---|---|---|---|---|---|
| Quadrant | DetID | PixID | Counts | Sigma | Mean | Median | Sigma |
| A | 10 | 83 | 383828 | 3481.86 | 544 | 533 | 110.1 |
| A | 12 | 16 | 162552 | 1471.78 | 544 | 533 | 110.1 |
| A | 9 | 143 | 127575 | 1154.05 | 544 | 533 | 110.1 |
| B | 5 | 172 | 38713 | 361.87 | 554 | 538 | 105.5 |
| B | 0 | 230 | 17648 | 162.19 | 554 | 538 | 105.5 |
| B | 12 | 111 | 12778 | 116.03 | 554 | 538 | 105.5 |
| C | 15 | 214 | 215569 | 1676.72 | 552 | 555 | 128.2 |
| C | 0 | 10 | 23554 | 179.35 | 552 | 555 | 128.2 |
| C | 13 | 61 | 3643 | 24.08 | 552 | 555 | 128.2 |
| D | 12 | 235 | 243560 | 1886.54 | 533 | 518 | 128.8 |
| D | 10 | 118 | 182741 | 1414.45 | 533 | 518 | 128.8 |
| D | 12 | 227 | 178164 | 1378.92 | 533 | 518 | 128.8 |
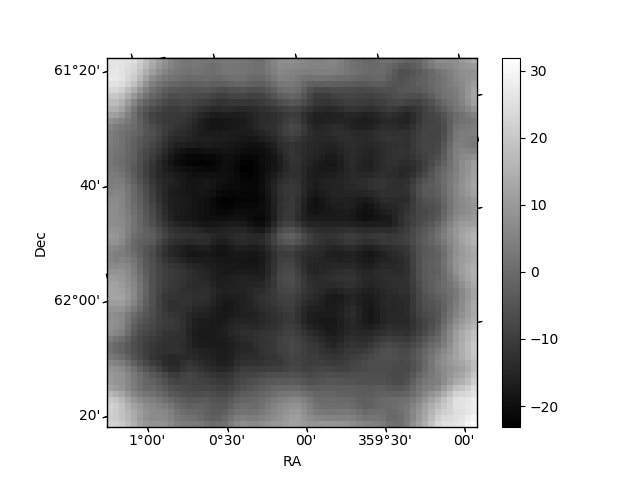
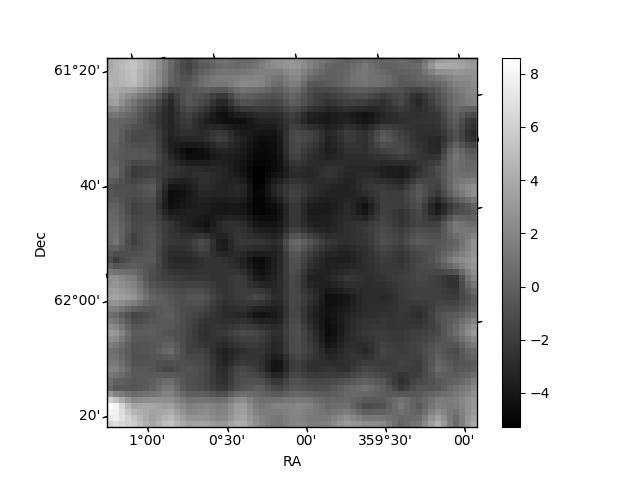
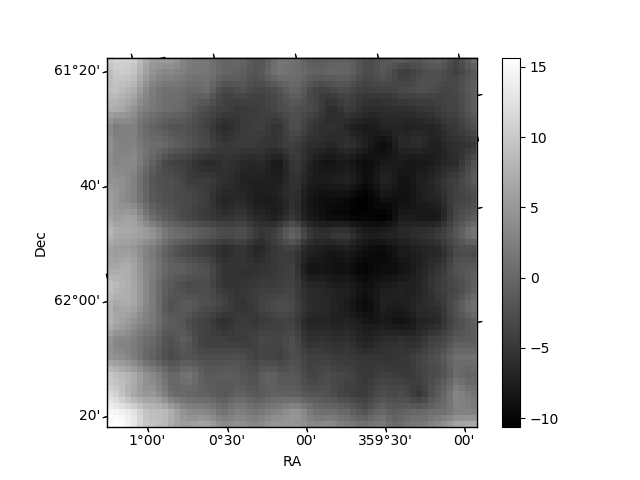
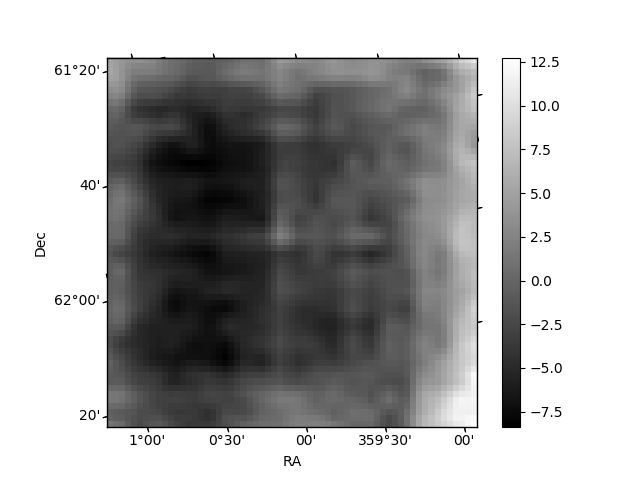
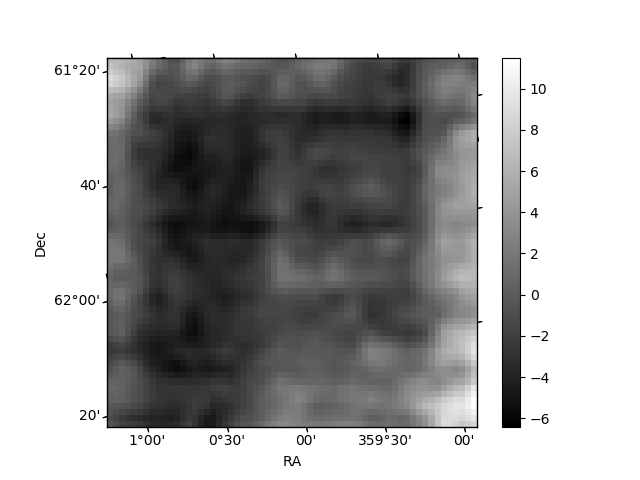
Histogram calculated using DETX and DETY for each event in the final _common_clean file
| Quadrant A | 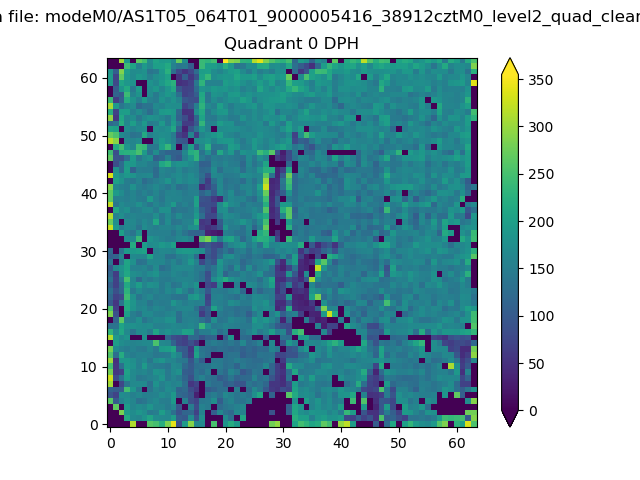 |
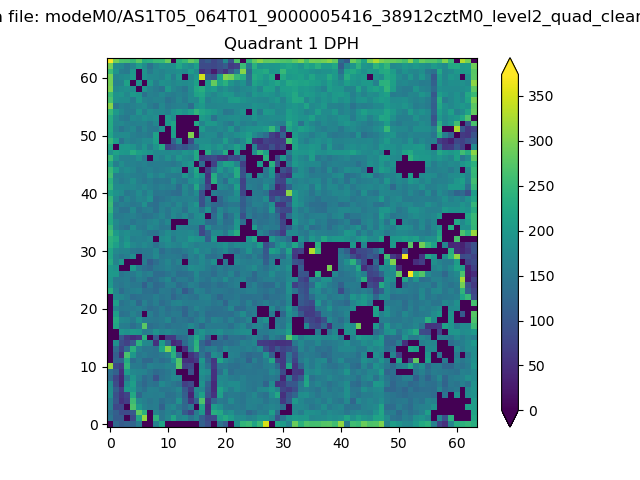 |
Quadrant B |
|---|---|---|---|
| Quadrant D | 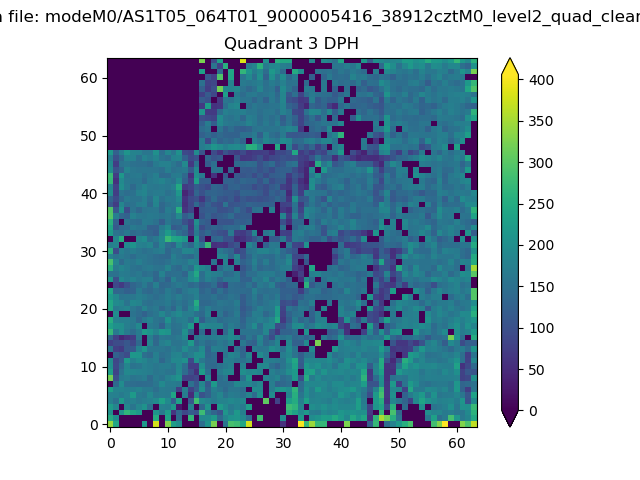 |
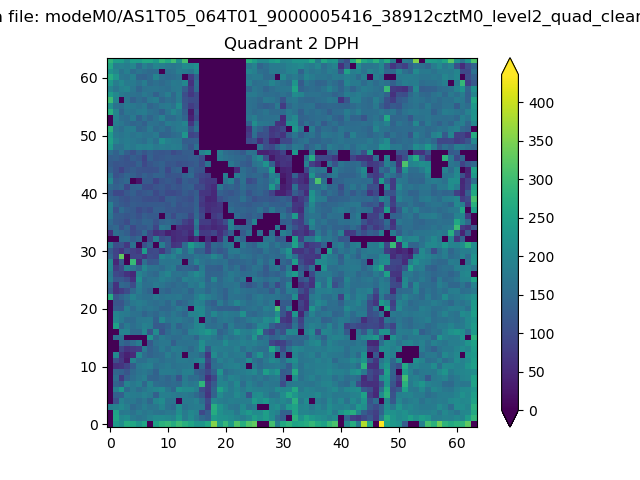 |
Quadrant C |
| Plot type | Count rate plots | Images |
|---|---|---|
| Comparison with Poisson distribution Blue bars denote a histogram of data divided into 1 sec bins. Red curve is a Poisson curve with rate = median count rate of data. |
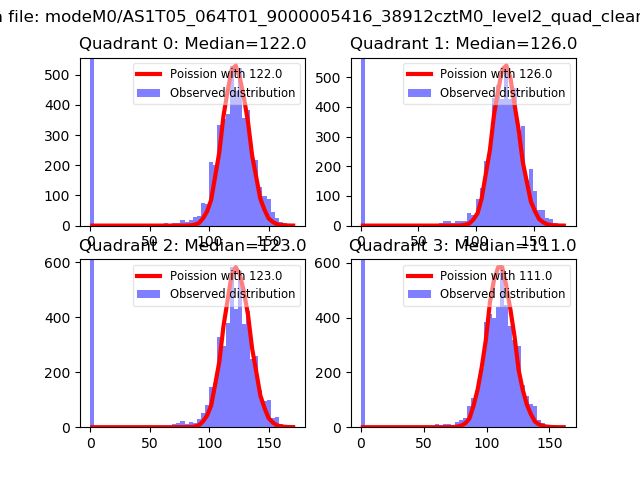 |
 |
| Quadrant-wise count rates Data is divided into 100 sec bins |
 |
|
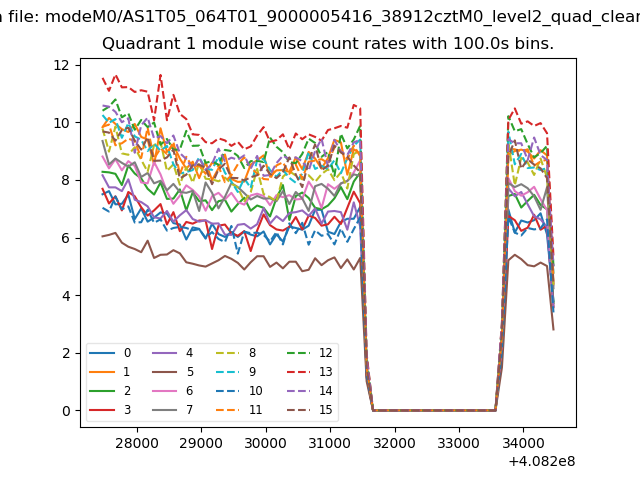
| Module-wise count rates for Quadrant A Data is divided into 100 sec bins |
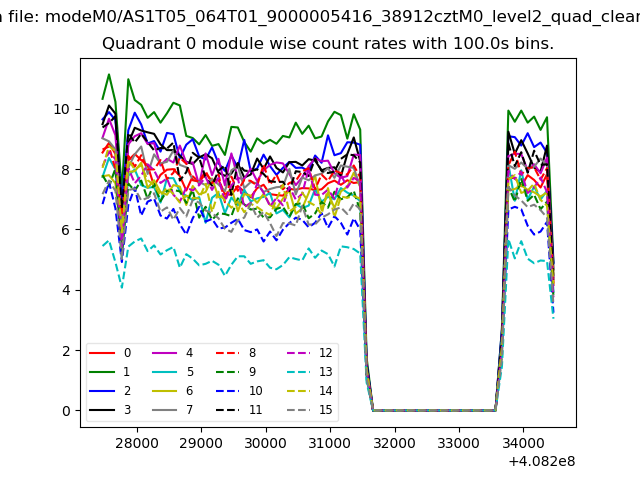 |
 |
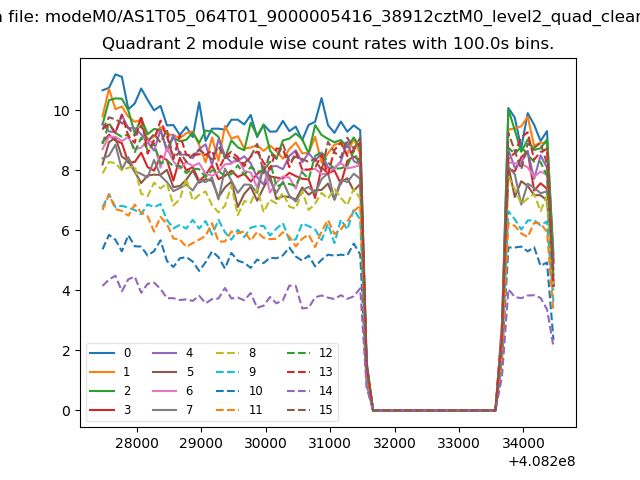
| Module-wise count rates for Quadrant B Data is divided into 100 sec bins |
 |
 |
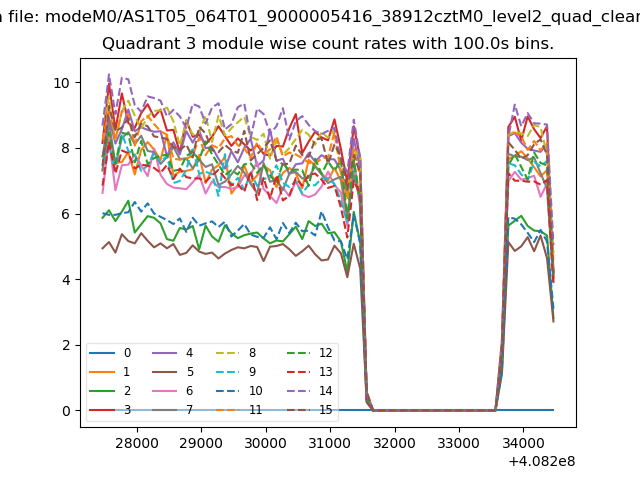
| Module-wise count rates for Quadrant C Data is divided into 100 sec bins |
 |
 |
| Module-wise count rates for Quadrant D Data is divided into 100 sec bins |
 |
 |
| Parameter | Plot |
|---|---|
| CZT HV Monitor | 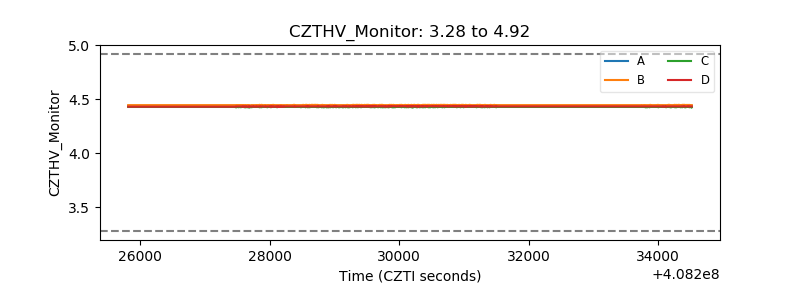 |
| D_VDD | 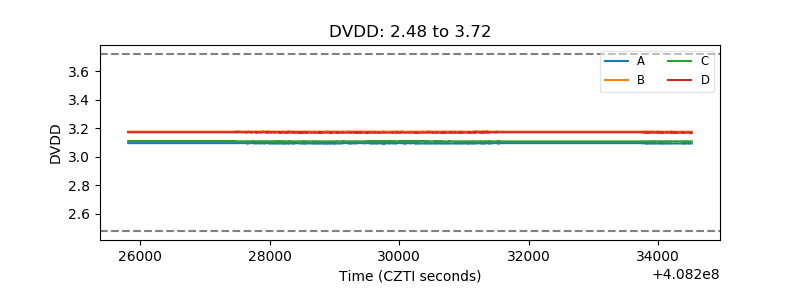 |
| Temperature 1 | 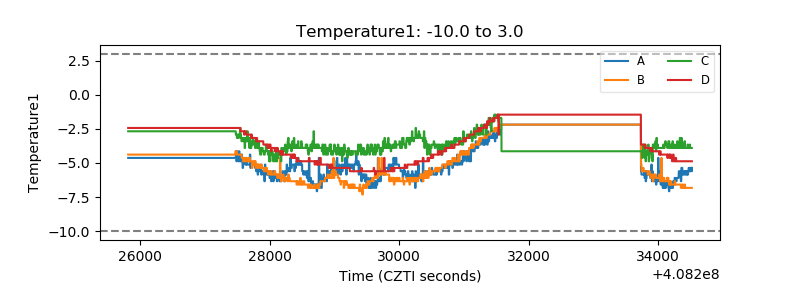 |
| Veto HV Monitor |  |
| Veto LLD | 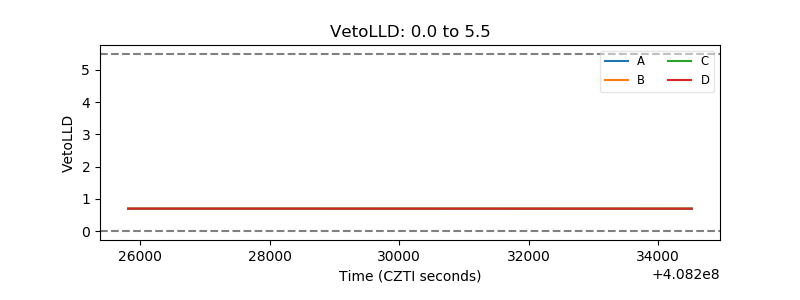 |
| Alpha Counter | 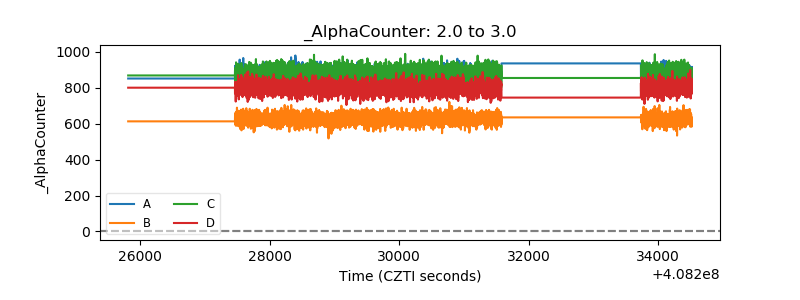 |
| _CPM_Rate | 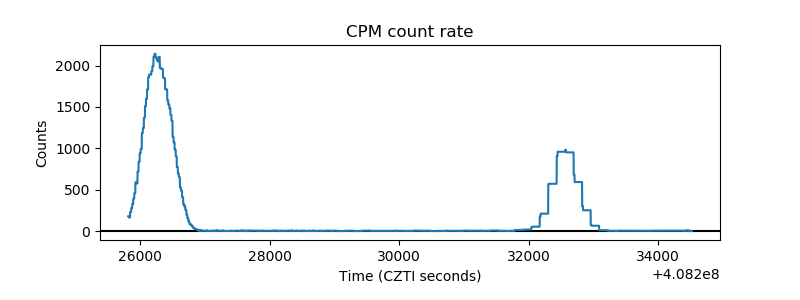 |
| CZT Counter | 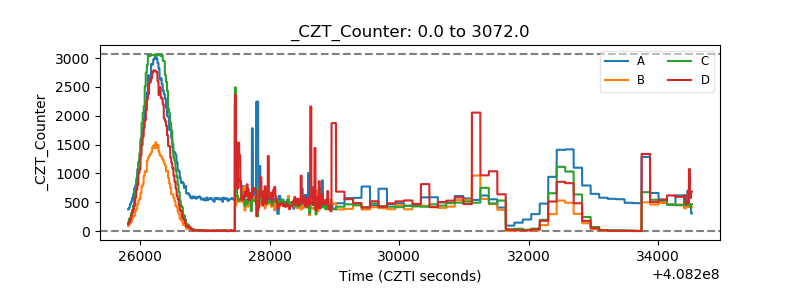 |
| +2.5 Volts monitor | 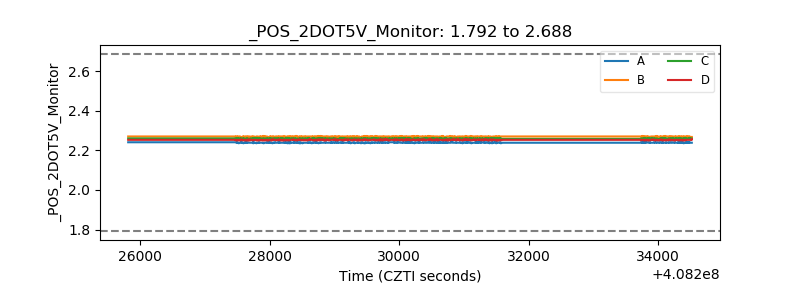 |
| +5 Volts monitor | 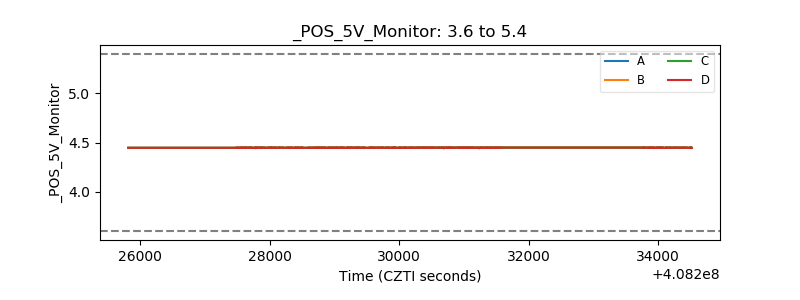 |
| _ROLL_ROT | 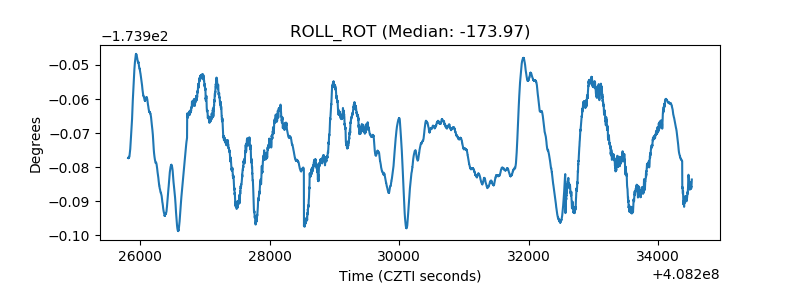 |
| _Roll_DEC | 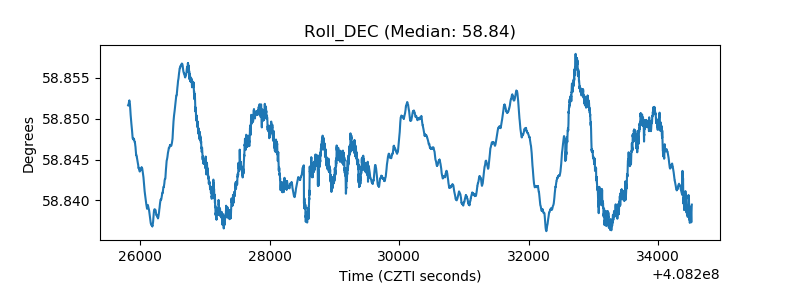 |
| _Roll_RA | 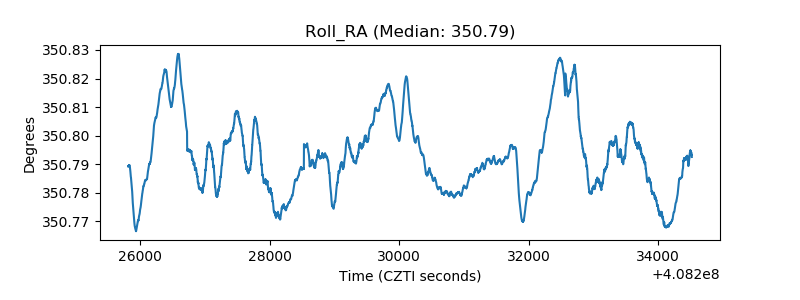 |
| Veto Counter | 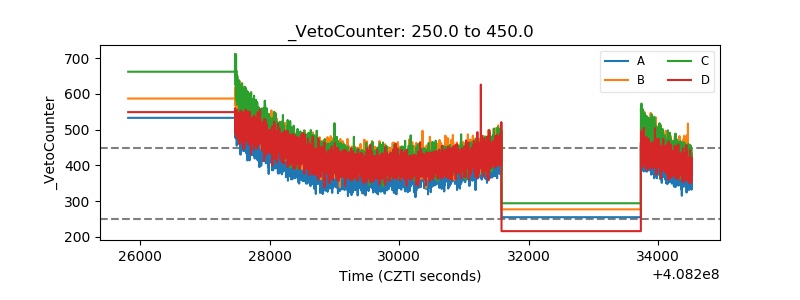 |