| Param | Original file | Final file |
|---|---|---|
| Filename | modeM0/AS1T05_064T01_9000005416_38913cztM0_level2.fits | modeM0/AS1T05_064T01_9000005416_38913cztM0_level2_quad_clean.evt |
| Size (bytes) | 291,306,240 | 84,697,920 |
| Size | 277.8 MB | 80.8 MB |
| Events in quadrant A | 2,657,132 | 564,115 |
| Events in quadrant B | 2,228,538 | 582,016 |
| Events in quadrant C | 2,338,690 | 566,503 |
| Events in quadrant D | 3,176,258 | 508,247 |
| Mode SS | |||
|---|---|---|---|
| Quadrant | BADHDUFLAG | Total packets | Discarded packets |
| A | 0 | 100 | 0 |
| B | 0 | 100 | 0 |
| C | 0 | 100 | 0 |
| D | 0 | 100 | 0 |
| Mode M9 | |||
|---|---|---|---|
| Quadrant | BADHDUFLAG | Total packets | Discarded packets |
| A | 0 | 40 | 0 |
| B | 0 | 40 | 0 |
| C | 0 | 40 | 0 |
| D | 0 | 41 | 0 |
| Mode M0 | |||
|---|---|---|---|
| Quadrant | BADHDUFLAG | Total packets | Discarded packets |
| A | 0 | 11048 | 3 |
| B | 0 | 10037 | 2 |
| C | 0 | 9991 | 2 |
| D | 0 | 12846 | 2 |
| Quadrant | Total seconds | Saturated seconds | Saturation percentage |
|---|---|---|---|
| A | 4903 | 20 | 0.407914% |
| B | 4903 | 13 | 0.265144% |
| C | 4903 | 8 | 0.163165% |
| D | 4903 | 148 | 3.018560% |
Noise dominated data is calculated using 1-second bins in cleaned event files. If a bin has >2000 counts, and if more than 50% of those come from <1% of pixels, then it is considered to be noise-dominated and hence unusable.
| Quadrant | # 1 sec bins | Bins with >0 counts | Bins with >2000 counts | High rate bins dominated by noise | Noise dominated (total time) | Noise dominated (detector-on time) | Marked lightcurve |
|---|---|---|---|---|---|---|---|
| A | 6966 | 4904 | 13 | 13 | 0.19% | 0.27% | 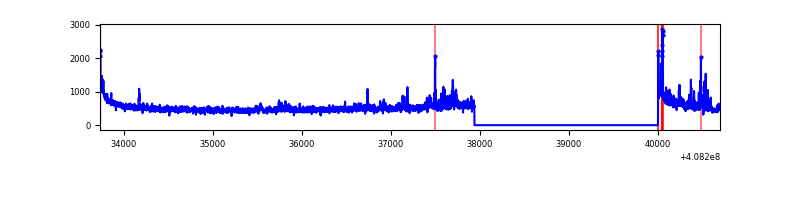 |
| B | 6966 | 4904 | 6 | 6 | 0.09% | 0.12% |  |
| C | 6966 | 4904 | 3 | 3 | 0.04% | 0.06% | 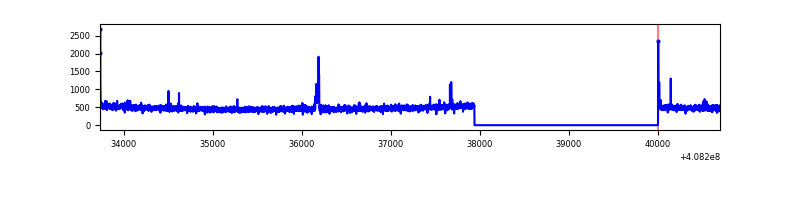 |
| D | 6966 | 4904 | 146 | 146 | 2.10% | 2.98% | 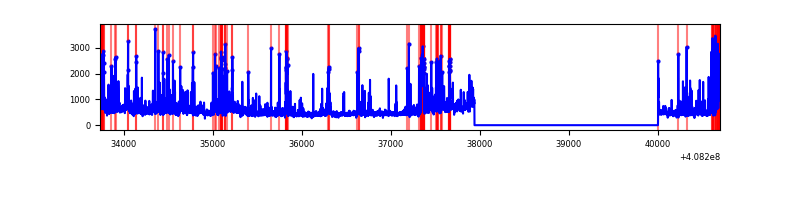 |
Top three noisy pixels from each quadrant. If the there are fewer than three noisy pixels in the level2.evt file, extra rows are filled as -1
| Pixel properties | Quadrant properties | ||||||
|---|---|---|---|---|---|---|---|
| Quadrant | DetID | PixID | Counts | Sigma | Mean | Median | Sigma |
| A | 10 | 83 | 384388 | 3507.78 | 534 | 522 | 109.4 |
| A | 12 | 16 | 140310 | 1277.38 | 534 | 522 | 109.4 |
| A | 12 | 194 | 25275 | 226.19 | 534 | 522 | 109.4 |
| B | 5 | 172 | 76081 | 739.79 | 537 | 522 | 102.1 |
| B | 0 | 230 | 15124 | 142.97 | 537 | 522 | 102.1 |
| B | 12 | 111 | 12814 | 120.35 | 537 | 522 | 102.1 |
| C | 15 | 214 | 215445 | 1743.71 | 531 | 536 | 123.2 |
| C | 12 | 249 | 31869 | 254.23 | 531 | 536 | 123.2 |
| C | 0 | 10 | 11359 | 87.81 | 531 | 536 | 123.2 |
| D | 12 | 235 | 272954 | 2189.68 | 517 | 502 | 124.4 |
| D | 2 | 250 | 199446 | 1598.9 | 517 | 502 | 124.4 |
| D | 10 | 118 | 170887 | 1369.37 | 517 | 502 | 124.4 |
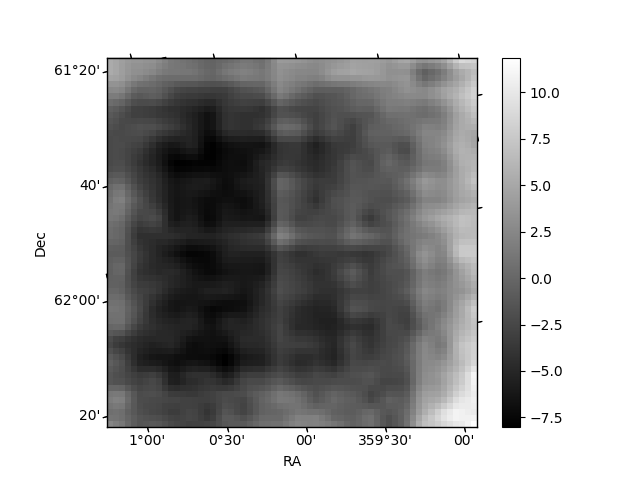
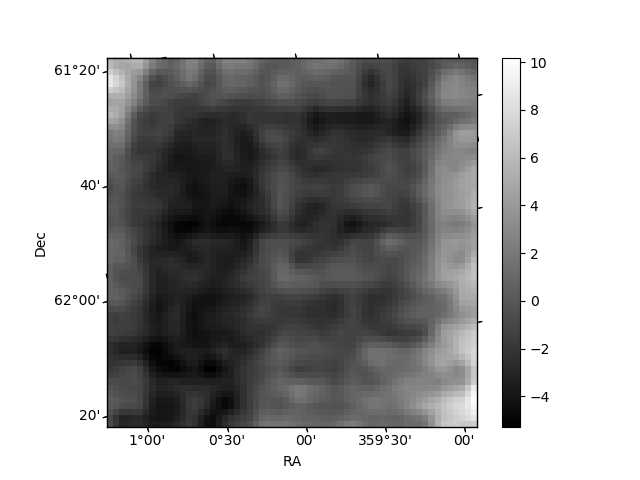
Histogram calculated using DETX and DETY for each event in the final _common_clean file
| Quadrant A | 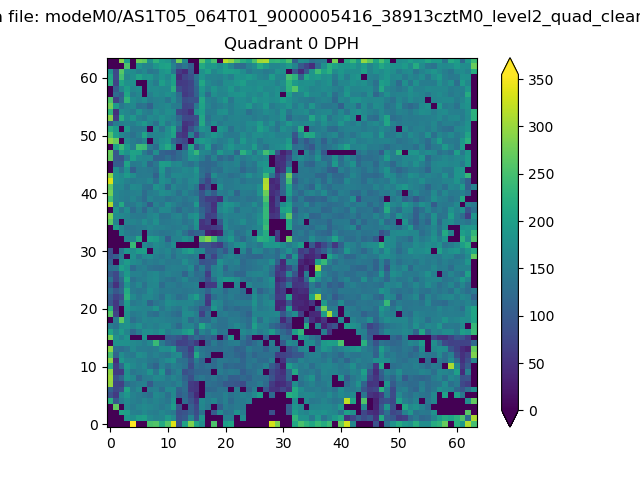 |
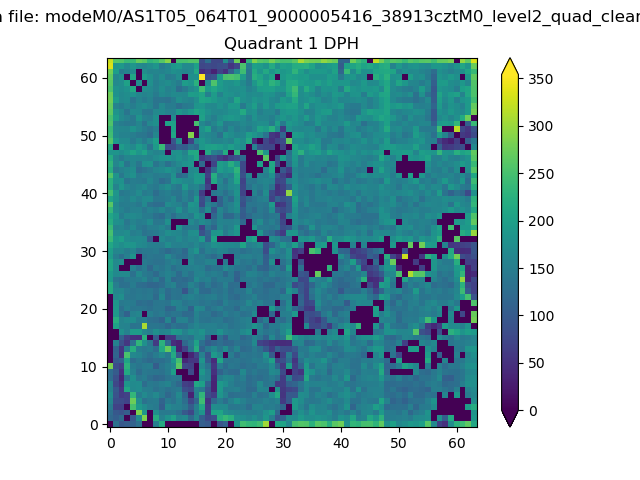 |
Quadrant B |
|---|---|---|---|
| Quadrant D | 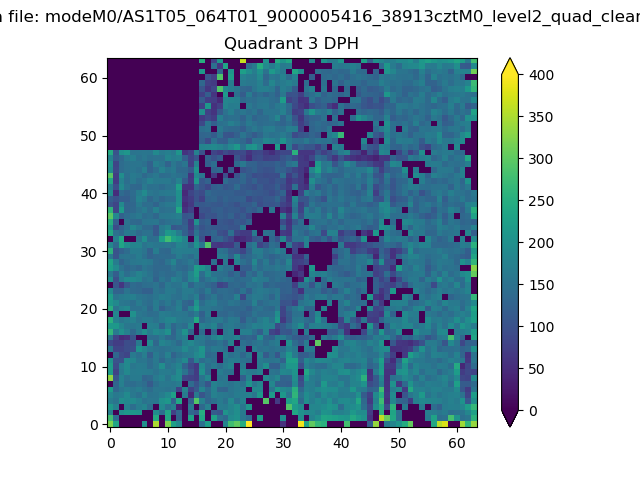 |
 |
Quadrant C |
| Plot type | Count rate plots | Images |
|---|---|---|
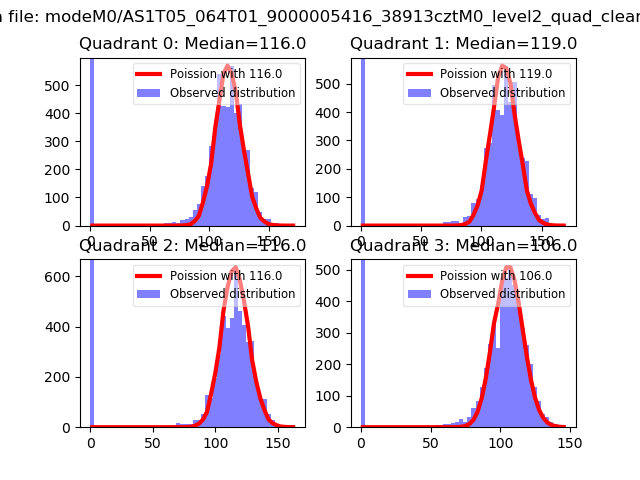
| Comparison with Poisson distribution Blue bars denote a histogram of data divided into 1 sec bins. Red curve is a Poisson curve with rate = median count rate of data. |
 |
 |
| Quadrant-wise count rates Data is divided into 100 sec bins |
 |
|
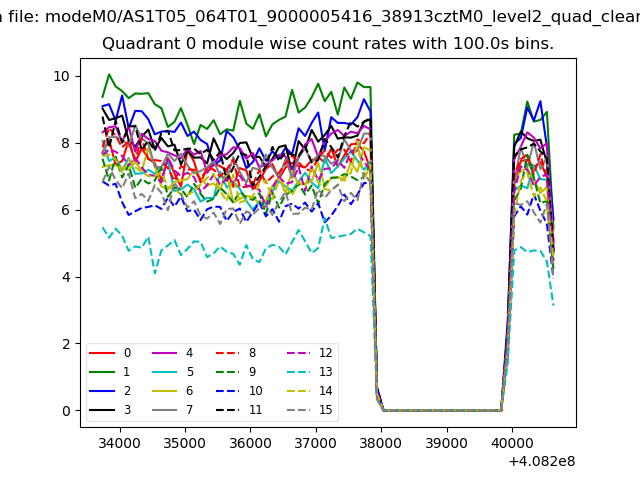
| Module-wise count rates for Quadrant A Data is divided into 100 sec bins |
 |
 |
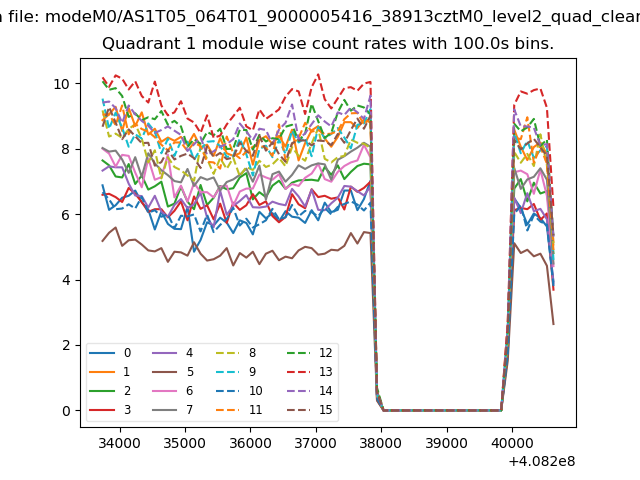
| Module-wise count rates for Quadrant B Data is divided into 100 sec bins |
 |
 |
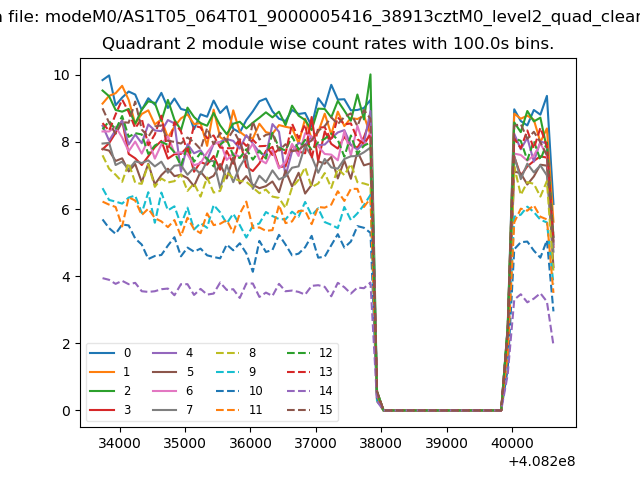
| Module-wise count rates for Quadrant C Data is divided into 100 sec bins |
 |
 |
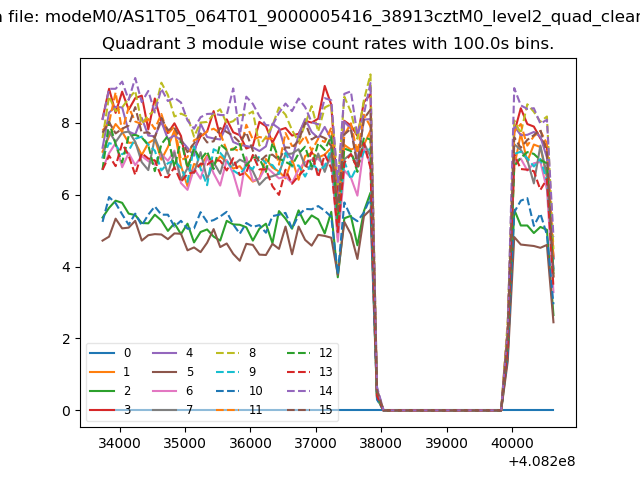
| Module-wise count rates for Quadrant D Data is divided into 100 sec bins |
 |
 |
| Parameter | Plot |
|---|---|
| CZT HV Monitor | 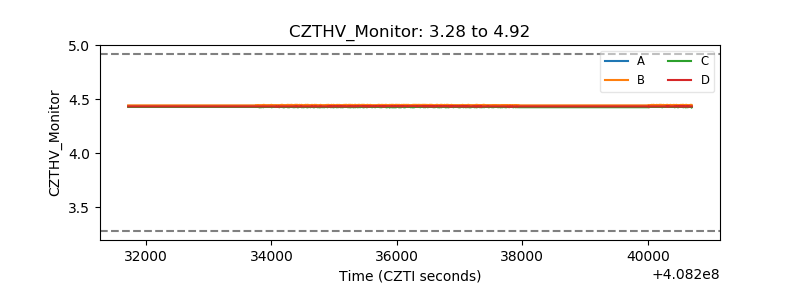 |
| D_VDD | 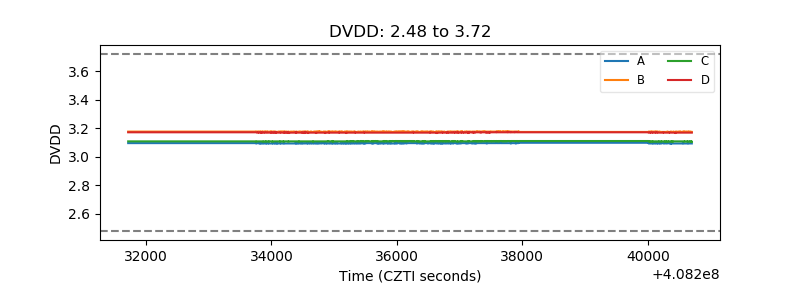 |
| Temperature 1 | 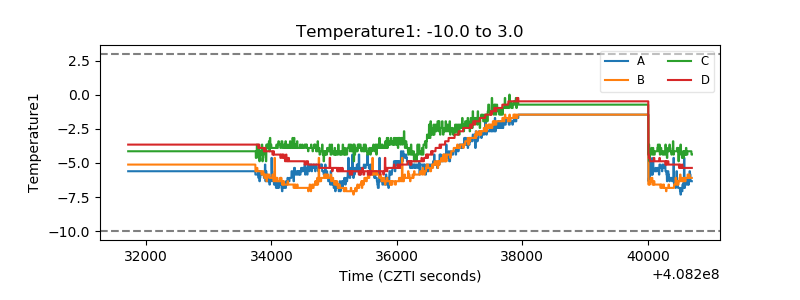 |
| Veto HV Monitor | 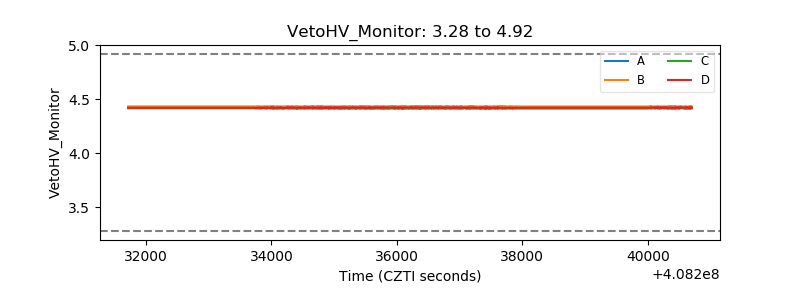 |
| Veto LLD | 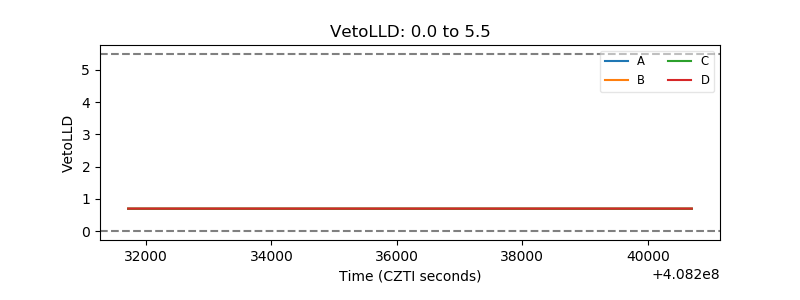 |
| Alpha Counter | 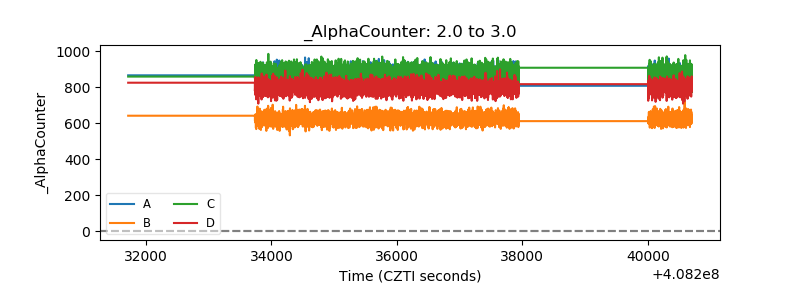 |
| _CPM_Rate | 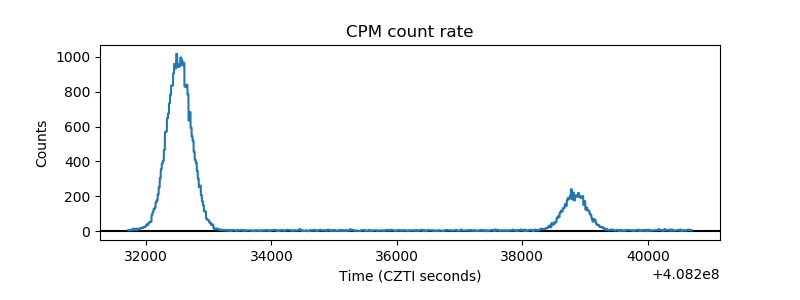 |
| CZT Counter |  |
| +2.5 Volts monitor | 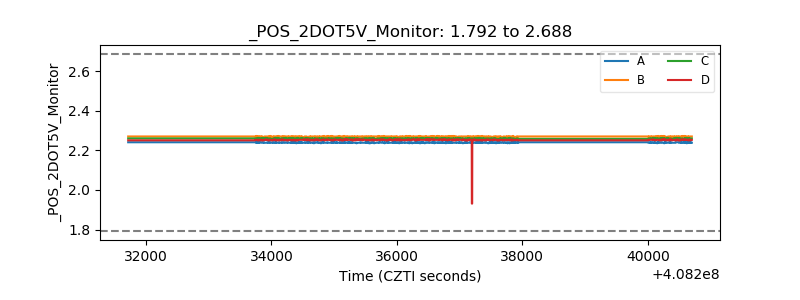 |
| +5 Volts monitor | 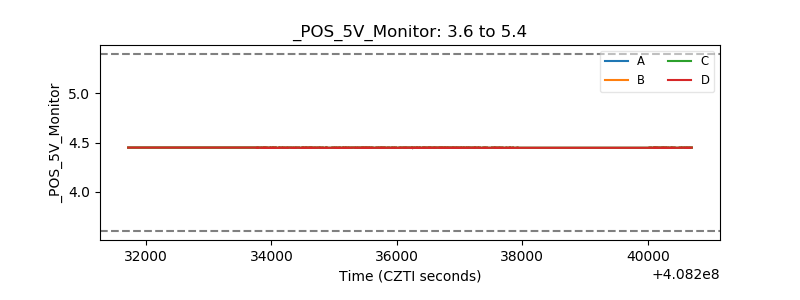 |
| _ROLL_ROT | 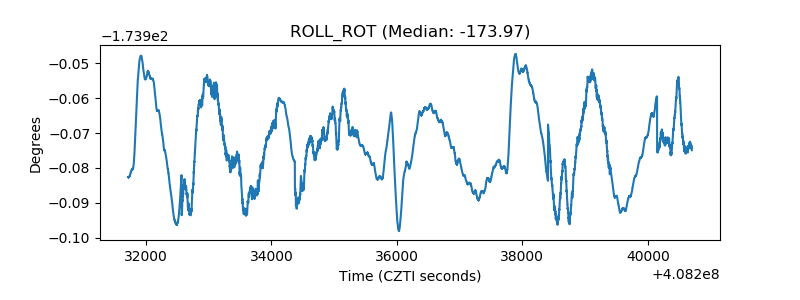 |
| _Roll_DEC |  |
| _Roll_RA | 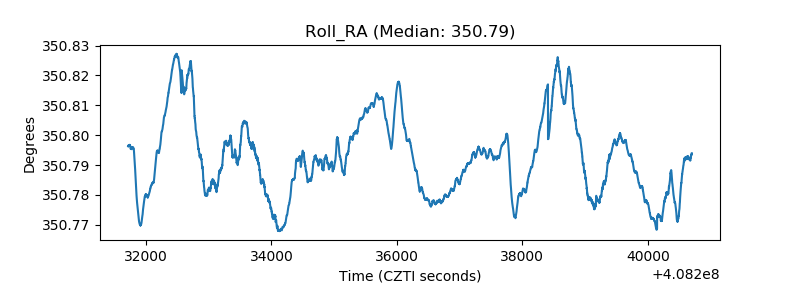 |
| Veto Counter | 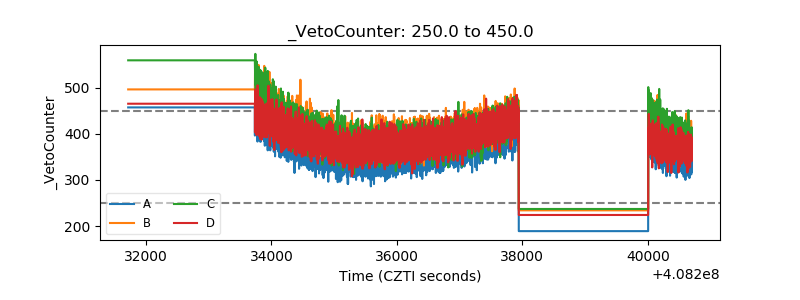 |