| Param | Original file | Final file |
|---|---|---|
| Filename | modeM0/AS1T05_064T01_9000005416_38914cztM0_level2.fits | modeM0/AS1T05_064T01_9000005416_38914cztM0_level2_quad_clean.evt |
| Size (bytes) | 372,352,320 | 91,681,920 |
| Size | 355.1 MB | 87.4 MB |
| Events in quadrant A | 3,045,974 | 617,789 |
| Events in quadrant B | 2,473,800 | 637,469 |
| Events in quadrant C | 2,584,763 | 619,074 |
| Events in quadrant D | 5,245,332 | 512,270 |
| Mode SS | |||
|---|---|---|---|
| Quadrant | BADHDUFLAG | Total packets | Discarded packets |
| A | 0 | 114 | 0 |
| B | 0 | 114 | 0 |
| C | 0 | 114 | 0 |
| D | 0 | 114 | 0 |
| Mode M9 | |||
|---|---|---|---|
| Quadrant | BADHDUFLAG | Total packets | Discarded packets |
| A | 0 | 31 | 0 |
| B | 0 | 31 | 0 |
| C | 0 | 31 | 0 |
| D | 0 | 32 | 0 |
| Mode M0 | |||
|---|---|---|---|
| Quadrant | BADHDUFLAG | Total packets | Discarded packets |
| A | 0 | 12587 | 3 |
| B | 0 | 11297 | 2 |
| C | 0 | 11229 | 2 |
| D | 0 | 19408 | 2 |
| Quadrant | Total seconds | Saturated seconds | Saturation percentage |
|---|---|---|---|
| A | 5565 | 21 | 0.377358% |
| B | 5565 | 8 | 0.143756% |
| C | 5565 | 5 | 0.089847% |
| D | 5565 | 706 | 12.686433% |
Noise dominated data is calculated using 1-second bins in cleaned event files. If a bin has >2000 counts, and if more than 50% of those come from <1% of pixels, then it is considered to be noise-dominated and hence unusable.
| Quadrant | # 1 sec bins | Bins with >0 counts | Bins with >2000 counts | High rate bins dominated by noise | Noise dominated (total time) | Noise dominated (detector-on time) | Marked lightcurve |
|---|---|---|---|---|---|---|---|
| A | 7328 | 5566 | 13 | 13 | 0.18% | 0.23% | 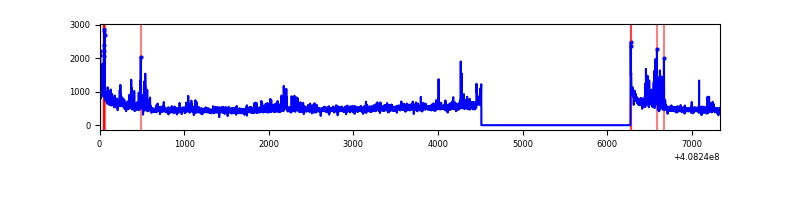 |
| B | 7328 | 5566 | 4 | 4 | 0.05% | 0.07% | 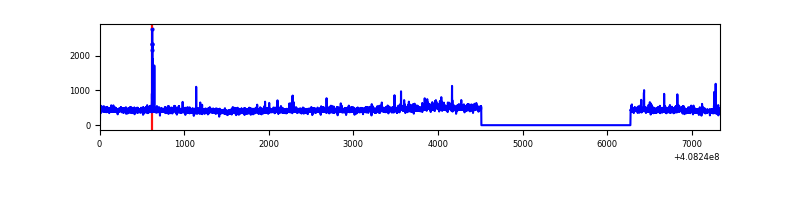 |
| C | 7328 | 5566 | 1 | 1 | 0.01% | 0.02% | 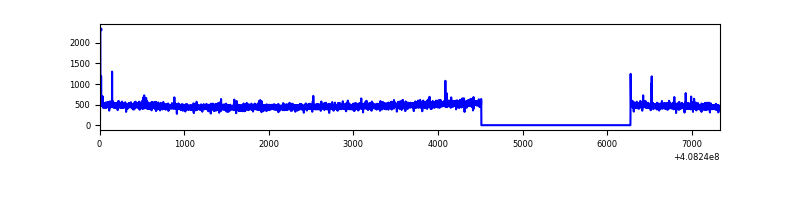 |
| D | 7328 | 5566 | 707 | 707 | 9.65% | 12.70% | 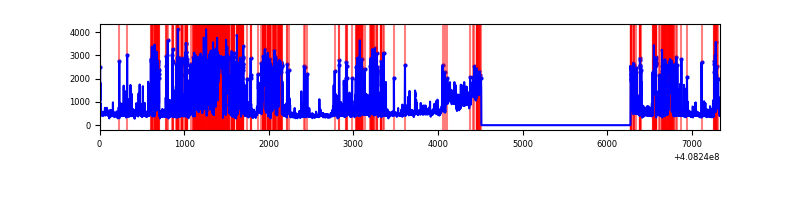 |
Top three noisy pixels from each quadrant. If the there are fewer than three noisy pixels in the level2.evt file, extra rows are filled as -1
| Pixel properties | Quadrant properties | ||||||
|---|---|---|---|---|---|---|---|
| Quadrant | DetID | PixID | Counts | Sigma | Mean | Median | Sigma |
| A | 10 | 83 | 415507 | 3379.39 | 601 | 588 | 122.8 |
| A | 12 | 16 | 148929 | 1208.19 | 601 | 588 | 122.8 |
| A | 13 | 248 | 105852 | 857.34 | 601 | 588 | 122.8 |
| B | 5 | 172 | 32138 | 270.2 | 601 | 583 | 116.8 |
| B | 0 | 190 | 26107 | 218.55 | 601 | 583 | 116.8 |
| B | 0 | 230 | 23371 | 195.13 | 601 | 583 | 116.8 |
| C | 15 | 214 | 244024 | 1764.24 | 593 | 596 | 138.0 |
| C | 1 | 23 | 9388 | 63.72 | 593 | 596 | 138.0 |
| C | 0 | 10 | 7263 | 48.32 | 593 | 596 | 138.0 |
| D | 12 | 227 | 1215009 | 8961.35 | 555 | 538 | 135.5 |
| D | 2 | 249 | 519761 | 3831.25 | 555 | 538 | 135.5 |
| D | 10 | 118 | 369151 | 2719.93 | 555 | 538 | 135.5 |
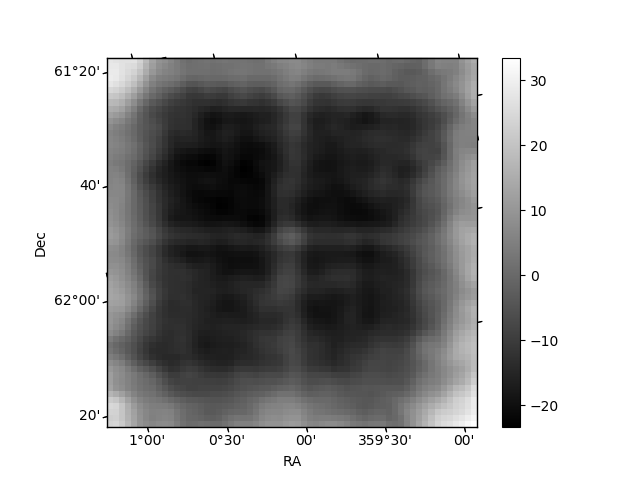
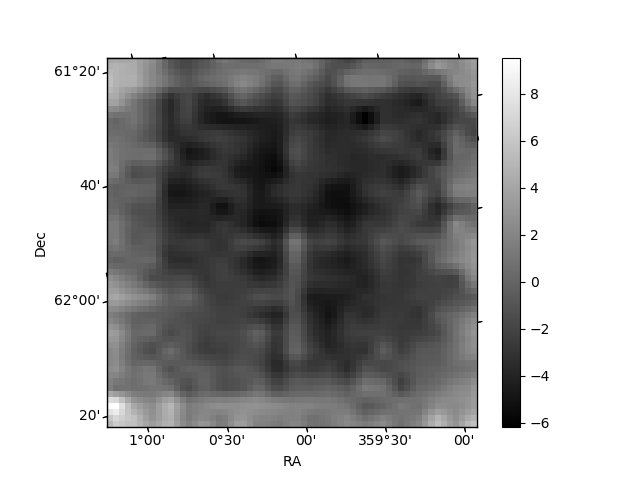
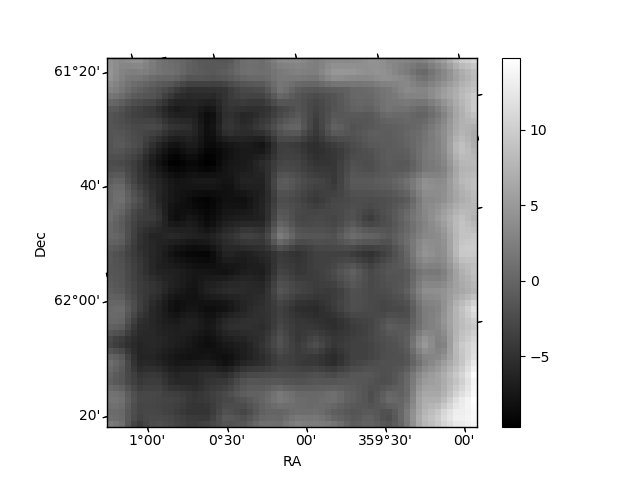
Histogram calculated using DETX and DETY for each event in the final _common_clean file
| Quadrant A | 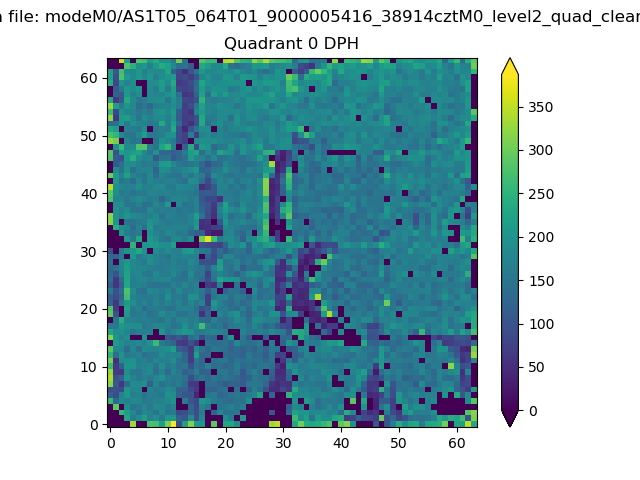 |
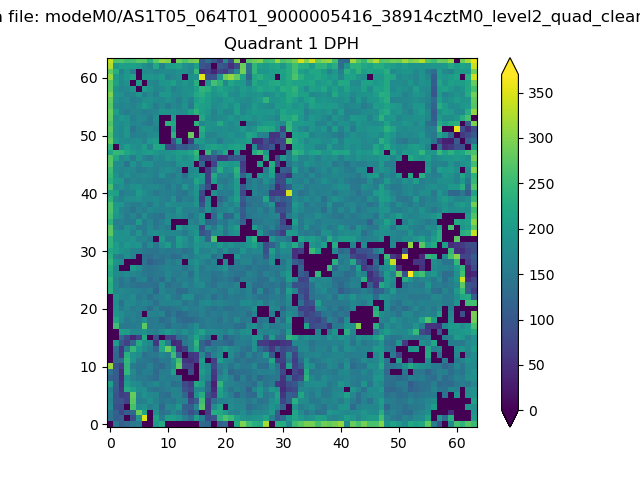 |
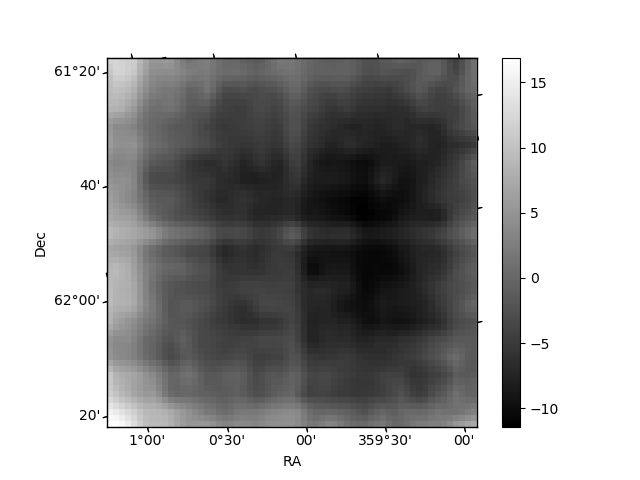
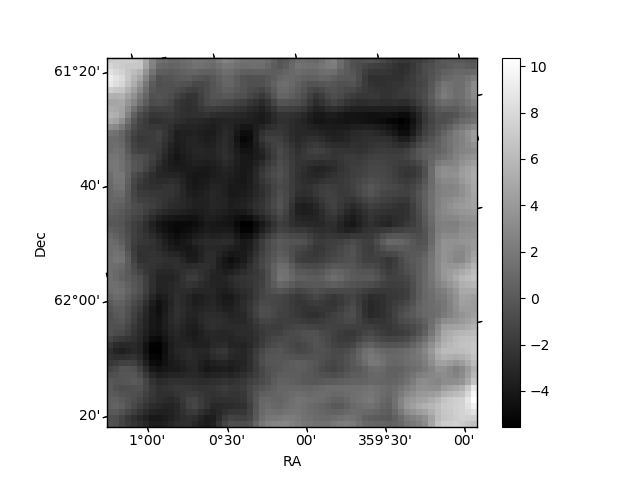
Quadrant B |
|---|---|---|---|
| Quadrant D | 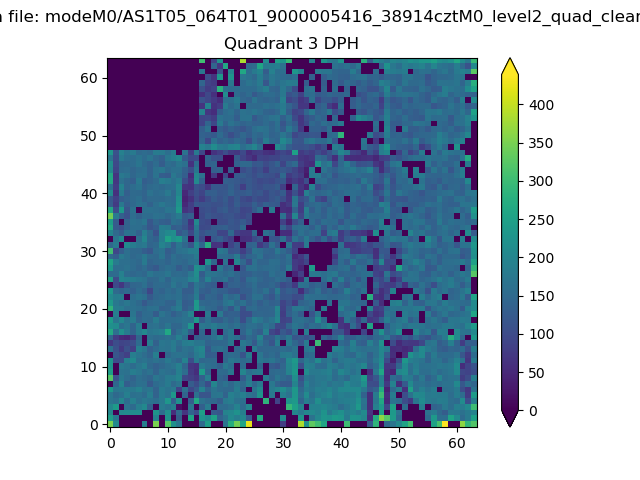 |
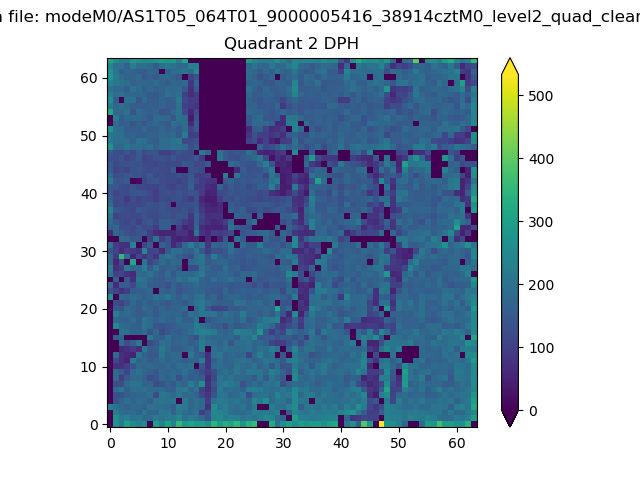 |
Quadrant C |
| Plot type | Count rate plots | Images |
|---|---|---|
| Comparison with Poisson distribution Blue bars denote a histogram of data divided into 1 sec bins. Red curve is a Poisson curve with rate = median count rate of data. |
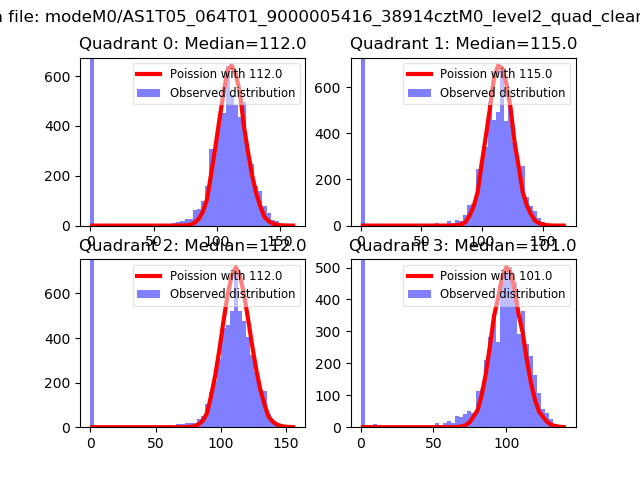 |
 |
| Quadrant-wise count rates Data is divided into 100 sec bins |
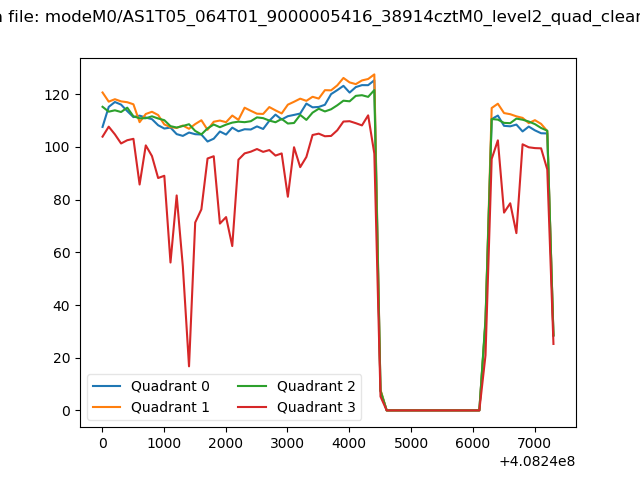 |
|
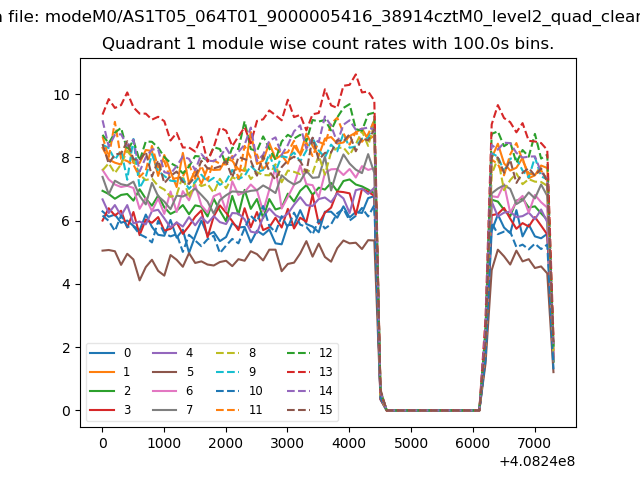
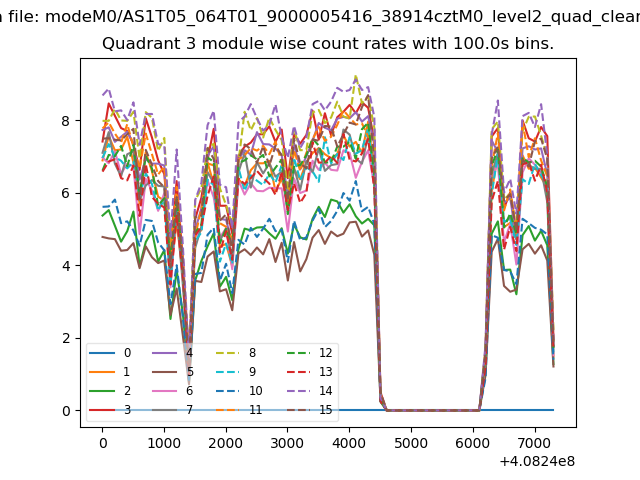
| Module-wise count rates for Quadrant A Data is divided into 100 sec bins |
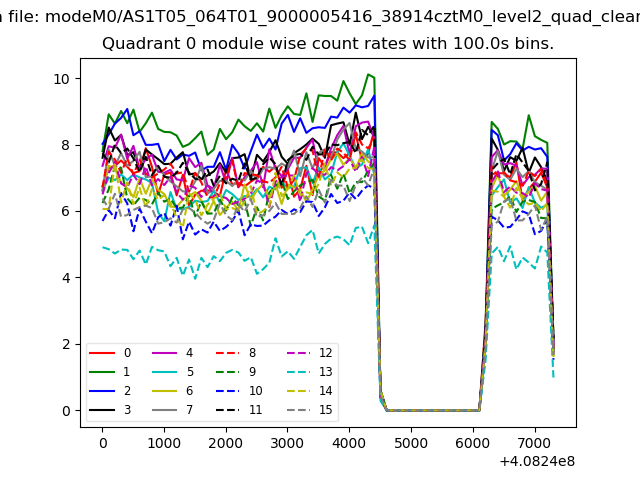 |
 |
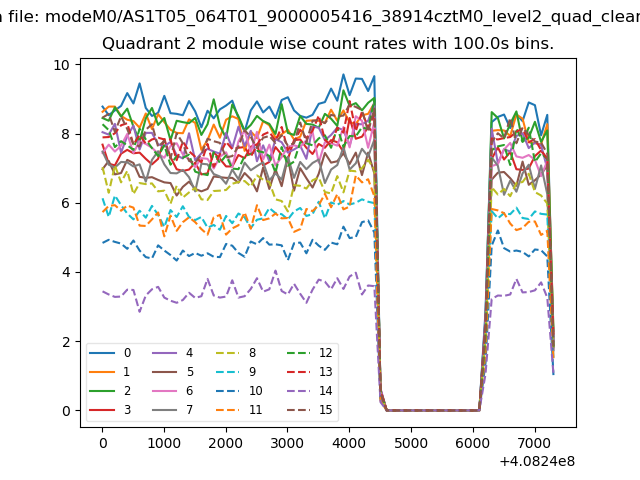
| Module-wise count rates for Quadrant B Data is divided into 100 sec bins |
 |
 |
| Module-wise count rates for Quadrant C Data is divided into 100 sec bins |
 |
 |
| Module-wise count rates for Quadrant D Data is divided into 100 sec bins |
 |
 |
| Parameter | Plot |
|---|---|
| CZT HV Monitor | 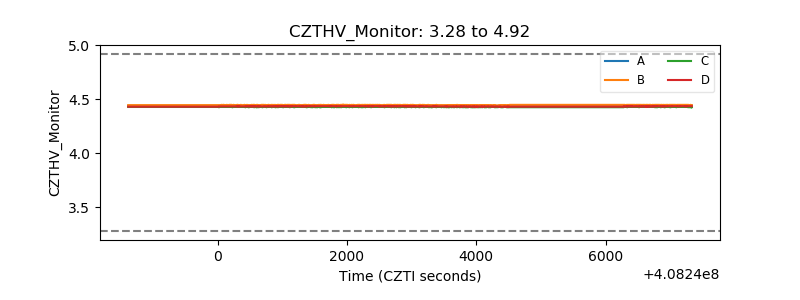 |
| D_VDD | 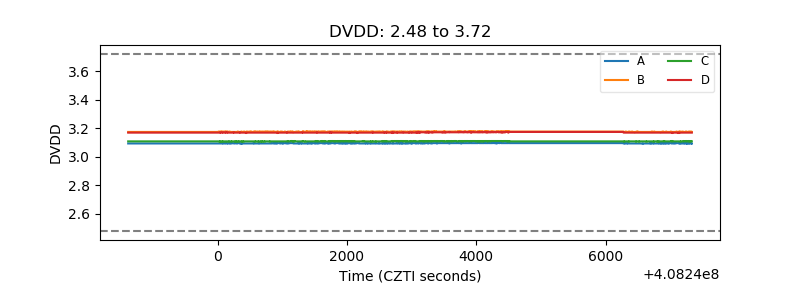 |
| Temperature 1 | 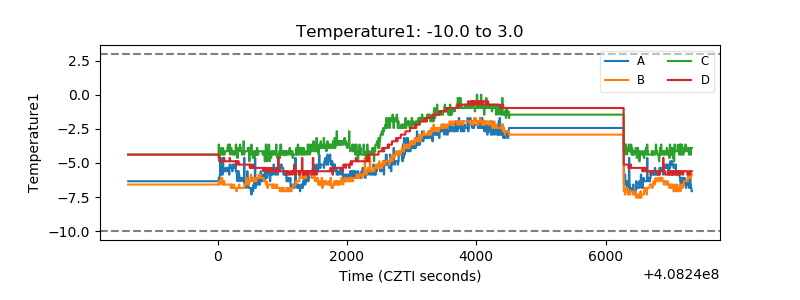 |
| Veto HV Monitor | 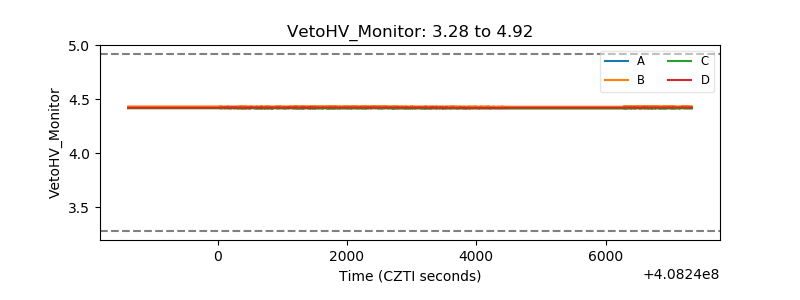 |
| Veto LLD | 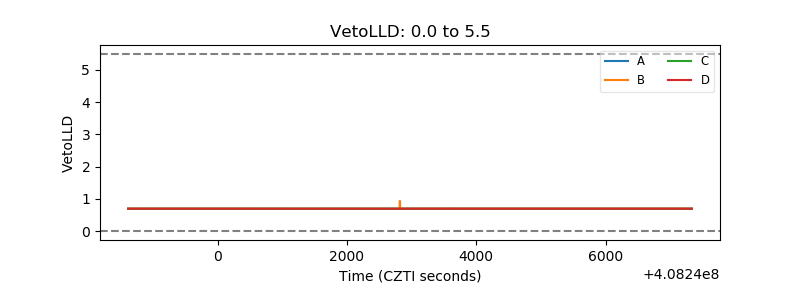 |
| Alpha Counter | 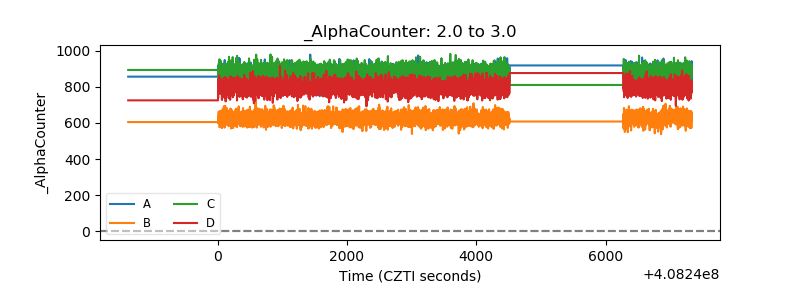 |
| _CPM_Rate | 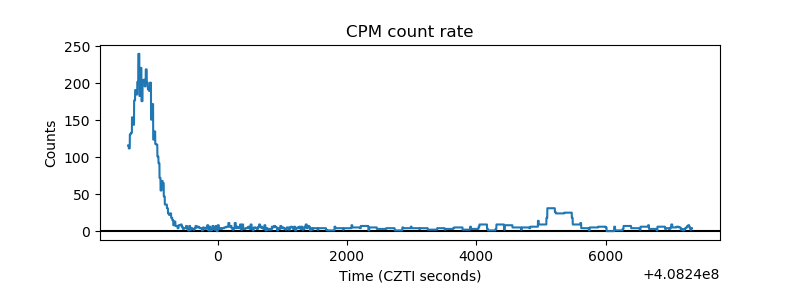 |
| CZT Counter | 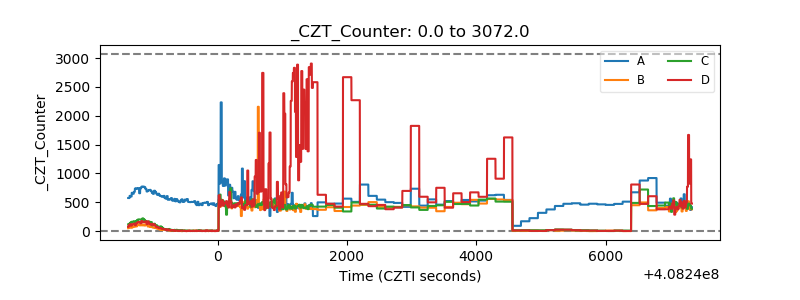 |
| +2.5 Volts monitor | 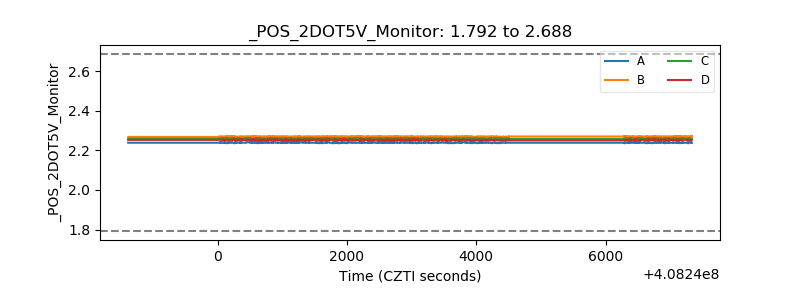 |
| +5 Volts monitor | 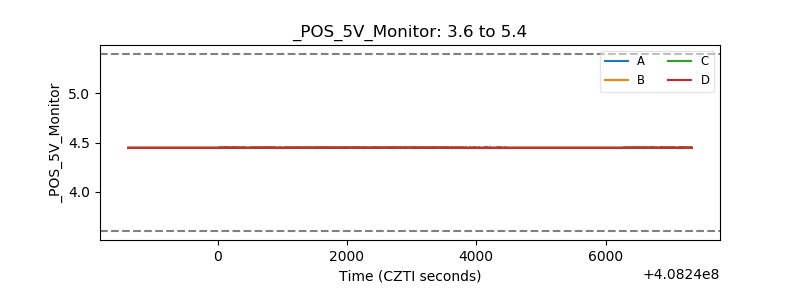 |
| _ROLL_ROT | 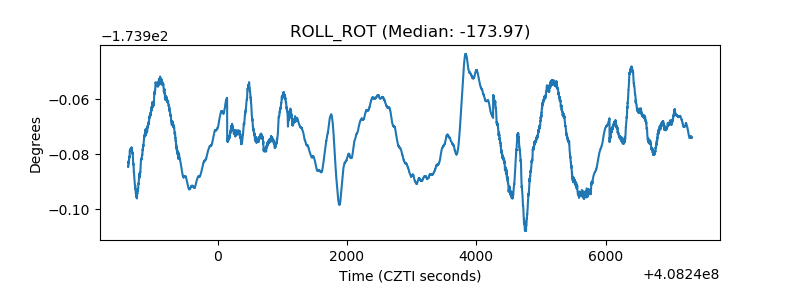 |
| _Roll_DEC | 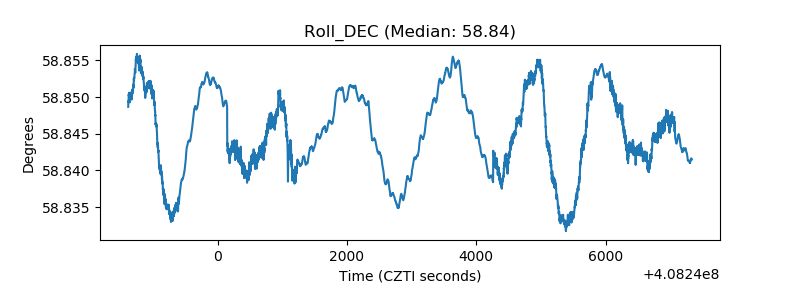 |
| _Roll_RA | 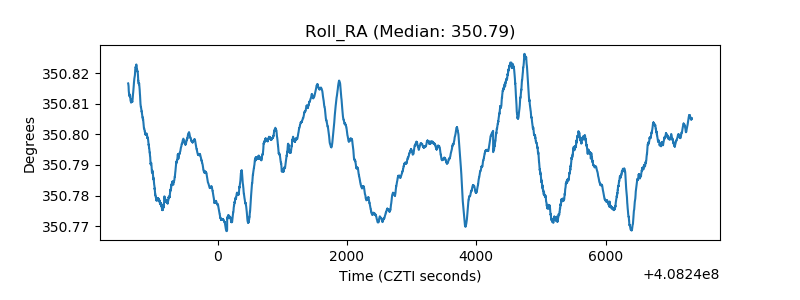 |
| Veto Counter | 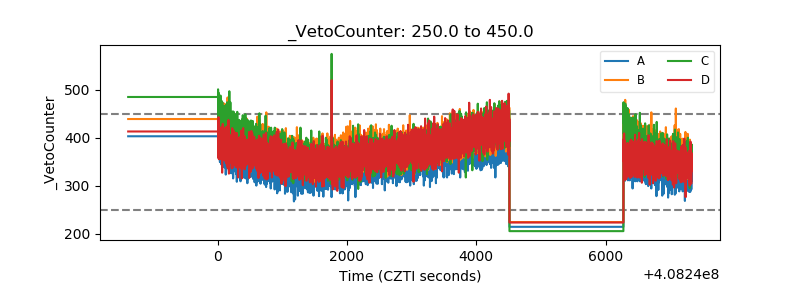 |