| Param | Original file | Final file |
|---|---|---|
| Filename | modeM0/AS1T05_064T01_9000005416_38916cztM0_level2.fits | modeM0/AS1T05_064T01_9000005416_38916cztM0_level2_quad_clean.evt |
| Size (bytes) | 494,012,160 | 90,725,760 |
| Size | 471.1 MB | 86.5 MB |
| Events in quadrant A | 3,885,348 | 637,154 |
| Events in quadrant B | 2,625,278 | 662,746 |
| Events in quadrant C | 2,773,045 | 640,345 |
| Events in quadrant D | 8,543,130 | 393,368 |
| Mode SS | |||
|---|---|---|---|
| Quadrant | BADHDUFLAG | Total packets | Discarded packets |
| A | 0 | 120 | 0 |
| B | 0 | 120 | 0 |
| C | 0 | 120 | 0 |
| D | 0 | 120 | 0 |
| Mode M9 | |||
|---|---|---|---|
| Quadrant | BADHDUFLAG | Total packets | Discarded packets |
| A | 0 | 22 | 0 |
| B | 0 | 22 | 0 |
| C | 0 | 22 | 0 |
| D | 0 | 22 | 0 |
| Mode M0 | |||
|---|---|---|---|
| Quadrant | BADHDUFLAG | Total packets | Discarded packets |
| A | 0 | 15241 | 3 |
| B | 0 | 11953 | 1 |
| C | 0 | 11967 | 1 |
| D | 0 | 29447 | 1 |
| Quadrant | Total seconds | Saturated seconds | Saturation percentage |
|---|---|---|---|
| A | 5916 | 92 | 1.555105% |
| B | 5916 | 7 | 0.118323% |
| C | 5916 | 3 | 0.050710% |
| D | 5916 | 2070 | 34.989858% |
Noise dominated data is calculated using 1-second bins in cleaned event files. If a bin has >2000 counts, and if more than 50% of those come from <1% of pixels, then it is considered to be noise-dominated and hence unusable.
| Quadrant | # 1 sec bins | Bins with >0 counts | Bins with >2000 counts | High rate bins dominated by noise | Noise dominated (total time) | Noise dominated (detector-on time) | Marked lightcurve |
|---|---|---|---|---|---|---|---|
| A | 7231 | 5918 | 77 | 77 | 1.06% | 1.30% | 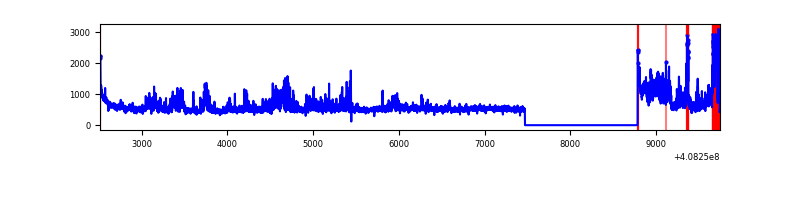 |
| B | 7231 | 5918 | 2 | 2 | 0.03% | 0.03% | 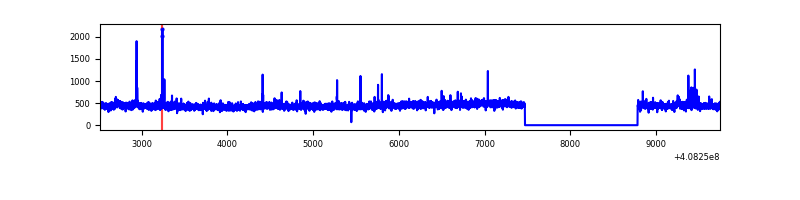 |
| C | 7231 | 5918 | 2 | 2 | 0.03% | 0.03% | 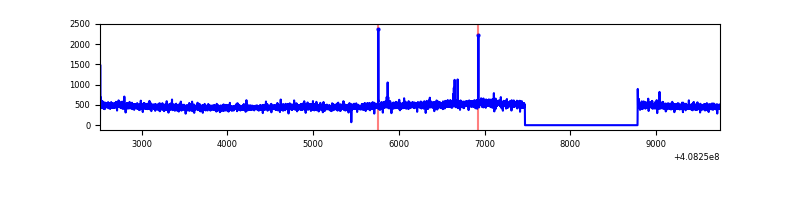 |
| D | 7230 | 5916 | 2034 | 2034 | 28.13% | 34.38% | 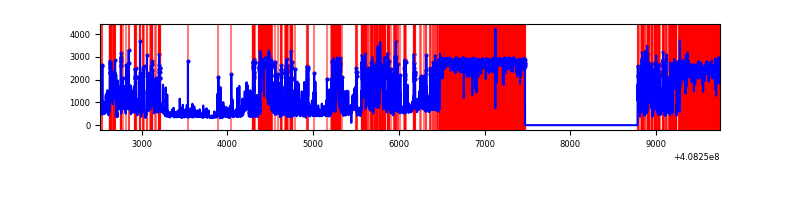 |
Top three noisy pixels from each quadrant. If the there are fewer than three noisy pixels in the level2.evt file, extra rows are filled as -1
| Pixel properties | Quadrant properties | ||||||
|---|---|---|---|---|---|---|---|
| Quadrant | DetID | PixID | Counts | Sigma | Mean | Median | Sigma |
| A | 12 | 16 | 615771 | 4645.77 | 646 | 631 | 132.4 |
| A | 10 | 83 | 456767 | 3444.91 | 646 | 631 | 132.4 |
| A | 13 | 248 | 211291 | 1590.99 | 646 | 631 | 132.4 |
| B | 5 | 172 | 21153 | 161.99 | 648 | 630 | 126.7 |
| B | 12 | 111 | 16074 | 121.9 | 648 | 630 | 126.7 |
| B | 0 | 230 | 15847 | 120.11 | 648 | 630 | 126.7 |
| C | 15 | 214 | 261478 | 1751.26 | 637 | 641 | 148.9 |
| C | 12 | 249 | 15559 | 100.16 | 637 | 641 | 148.9 |
| C | 3 | 233 | 4942 | 28.87 | 637 | 641 | 148.9 |
| D | 12 | 227 | 4160978 | 33989.24 | 493 | 479 | 122.4 |
| D | 2 | 250 | 1256224 | 10258.82 | 493 | 479 | 122.4 |
| D | 10 | 118 | 394290 | 3217.24 | 493 | 479 | 122.4 |
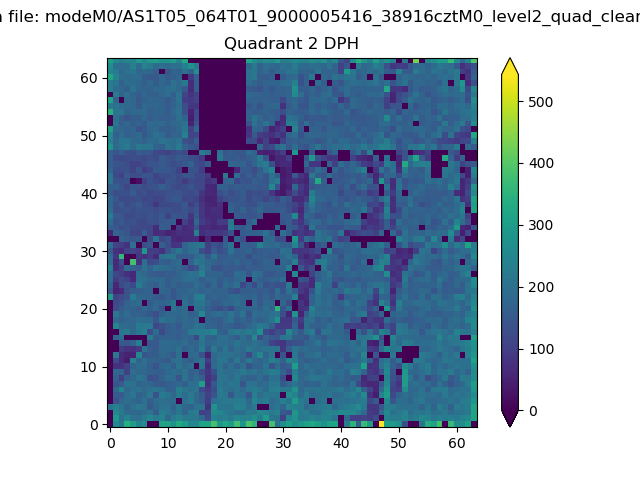
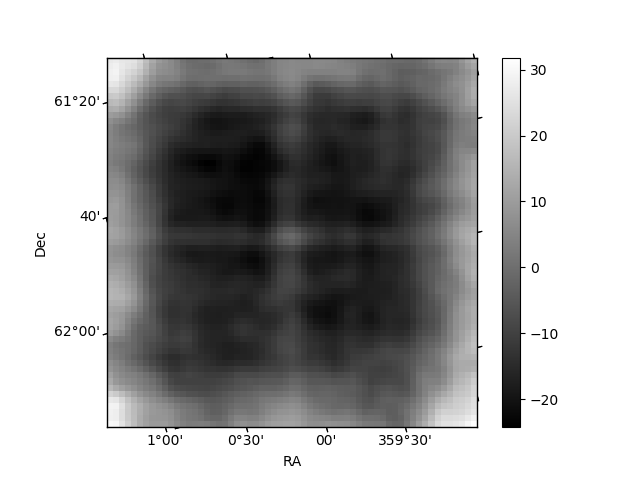
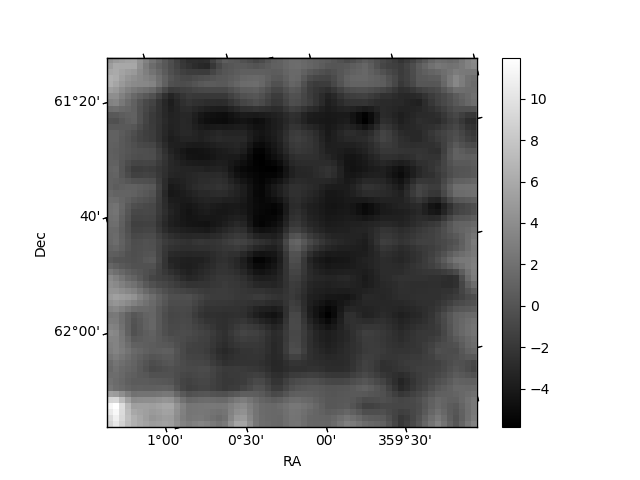
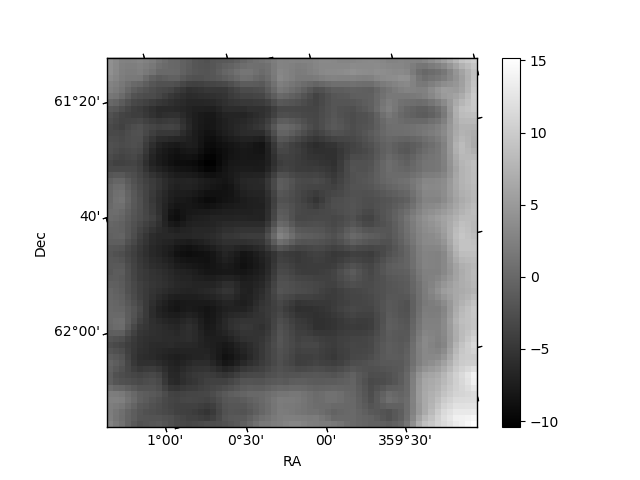
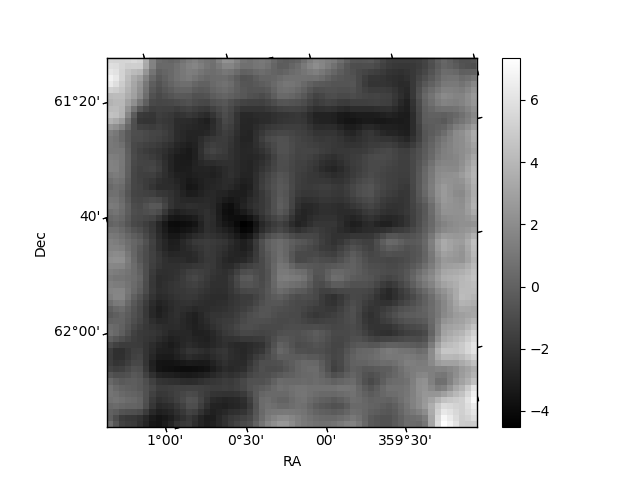
Histogram calculated using DETX and DETY for each event in the final _common_clean file
| Quadrant A | 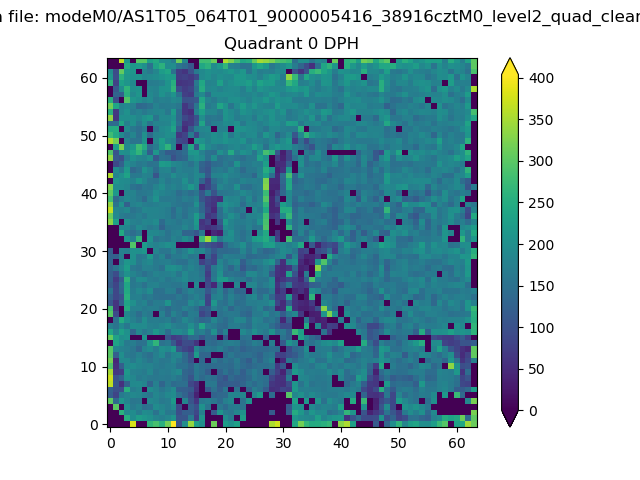 |
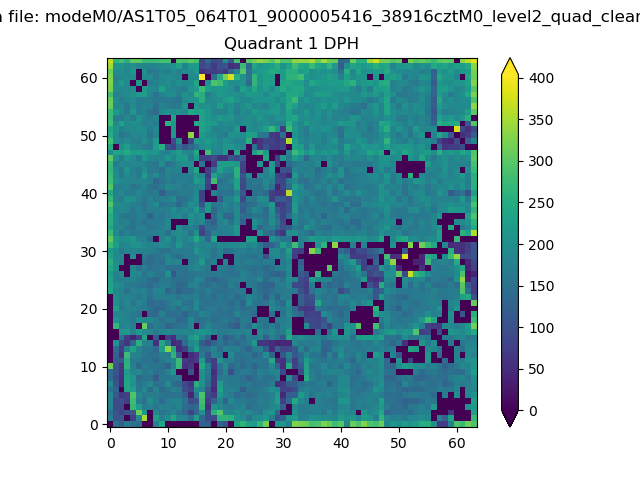 |
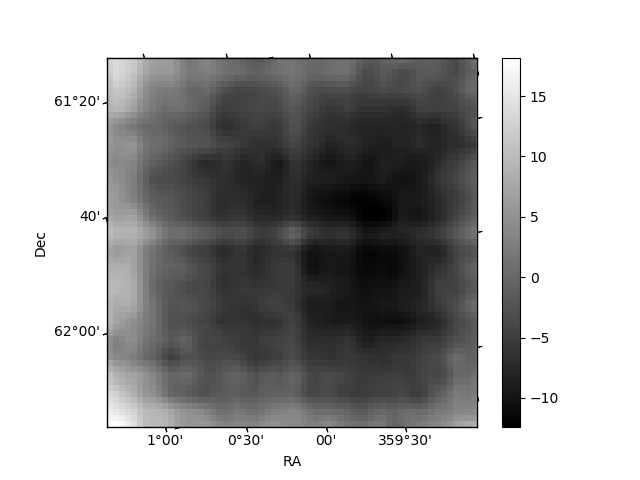
Quadrant B |
|---|---|---|---|
| Quadrant D | 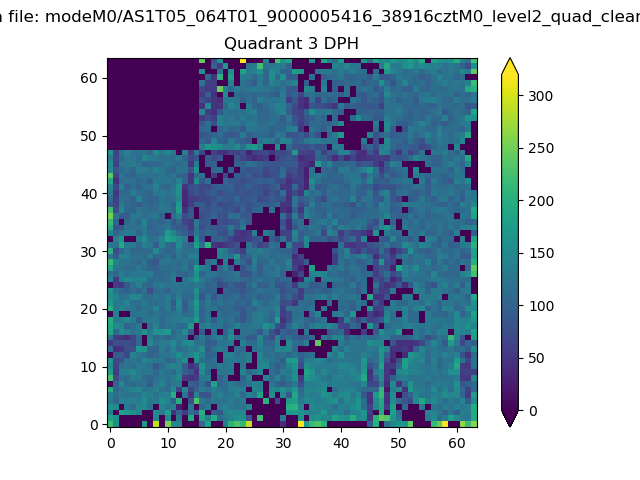 |
 |
Quadrant C |
| Plot type | Count rate plots | Images |
|---|---|---|
| Comparison with Poisson distribution Blue bars denote a histogram of data divided into 1 sec bins. Red curve is a Poisson curve with rate = median count rate of data. |
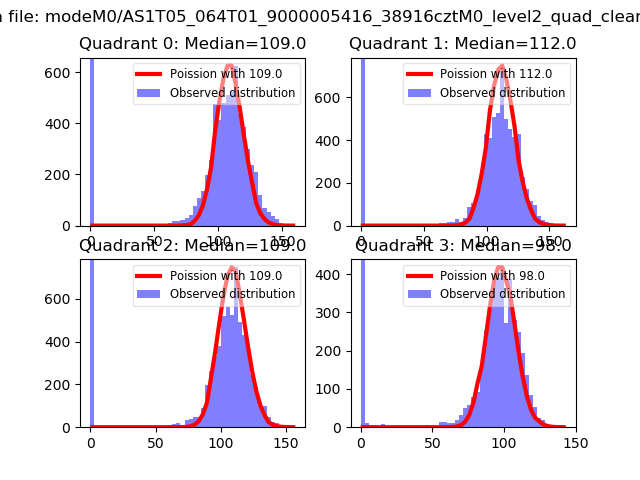 |
 |
| Quadrant-wise count rates Data is divided into 100 sec bins |
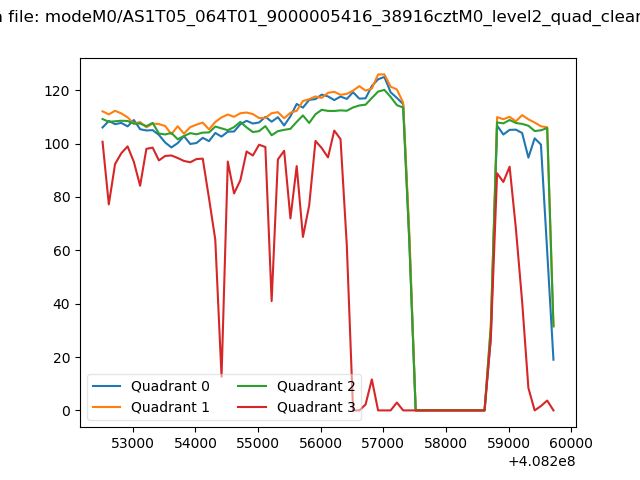 |
|
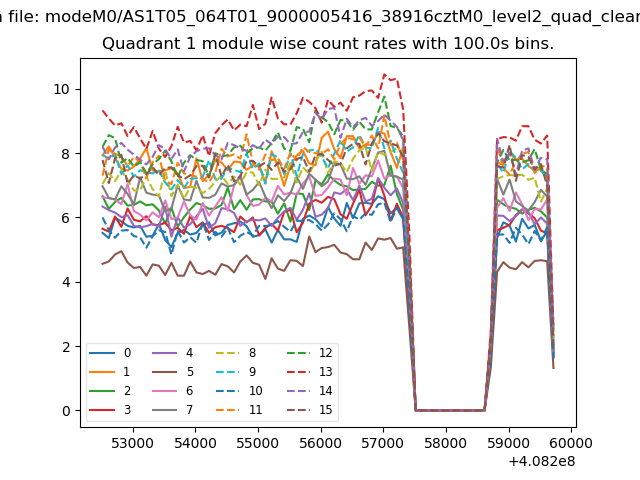
| Module-wise count rates for Quadrant A Data is divided into 100 sec bins |
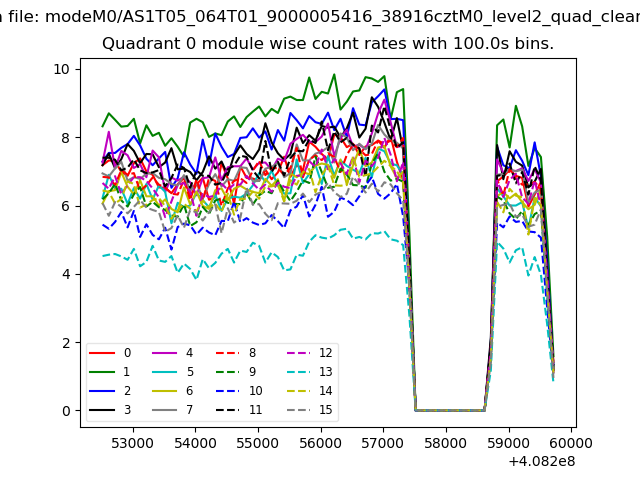 |
 |
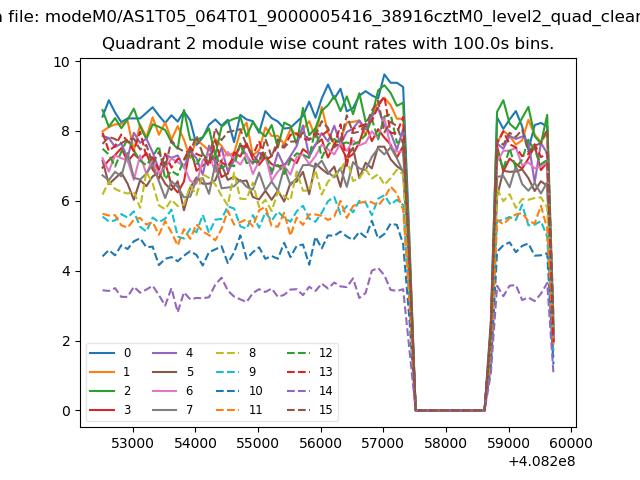
| Module-wise count rates for Quadrant B Data is divided into 100 sec bins |
 |
 |
| Module-wise count rates for Quadrant C Data is divided into 100 sec bins |
 |
 |
| Module-wise count rates for Quadrant D Data is divided into 100 sec bins |
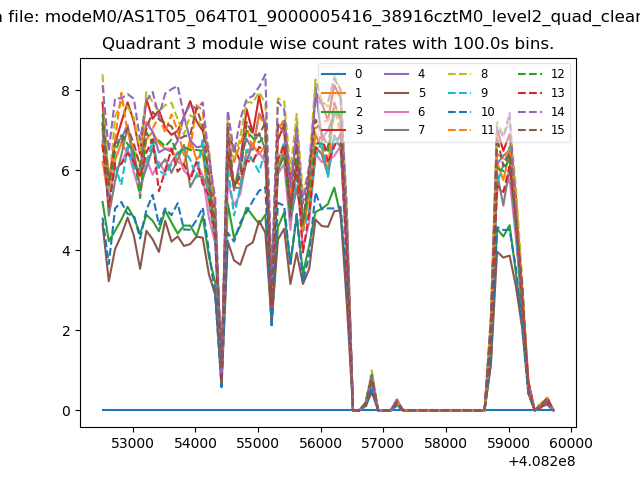 |
 |
| Parameter | Plot |
|---|---|
| CZT HV Monitor | 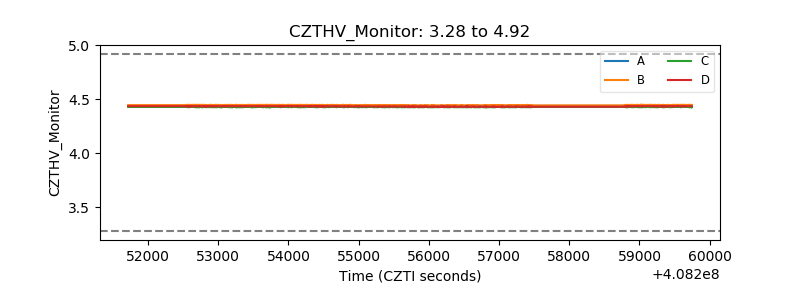 |
| D_VDD | 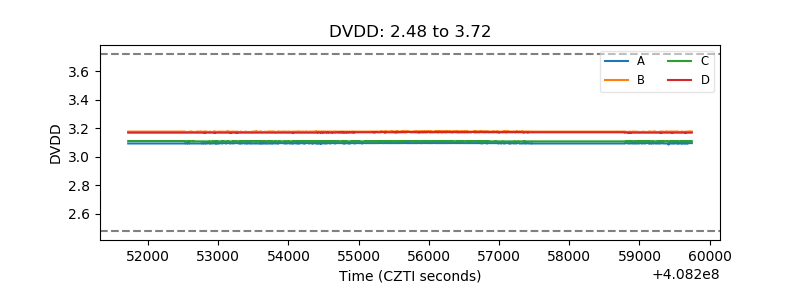 |
| Temperature 1 | 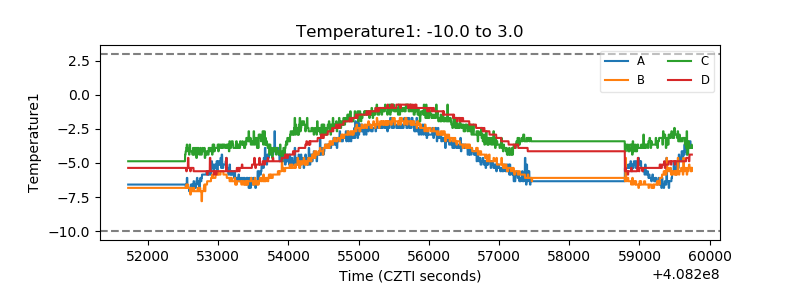 |
| Veto HV Monitor | 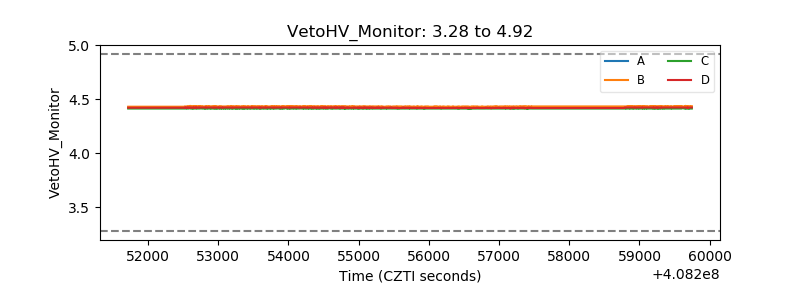 |
| Veto LLD | 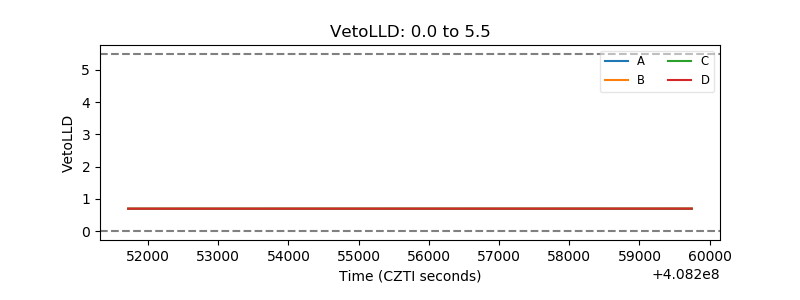 |
| Alpha Counter | 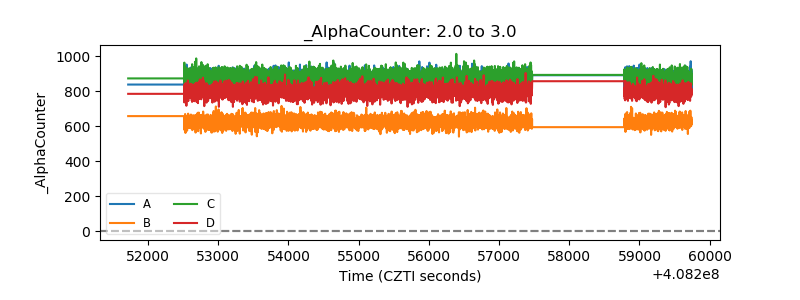 |
| _CPM_Rate | 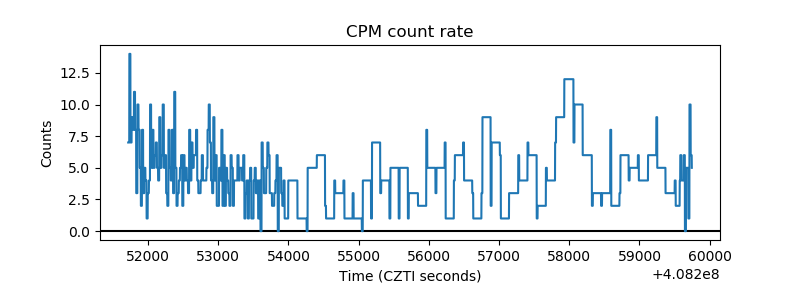 |
| CZT Counter | 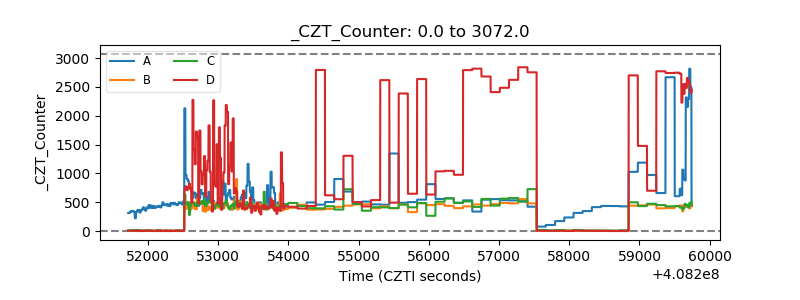 |
| +2.5 Volts monitor | 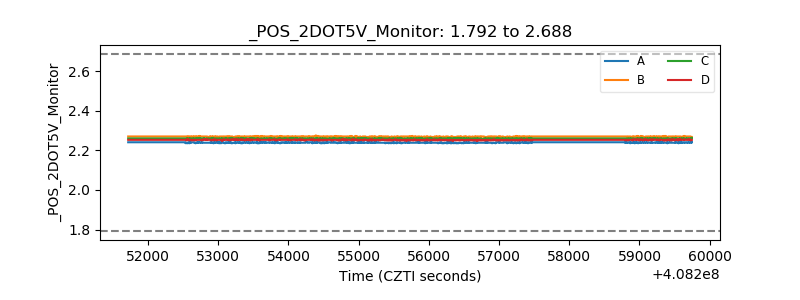 |
| +5 Volts monitor | 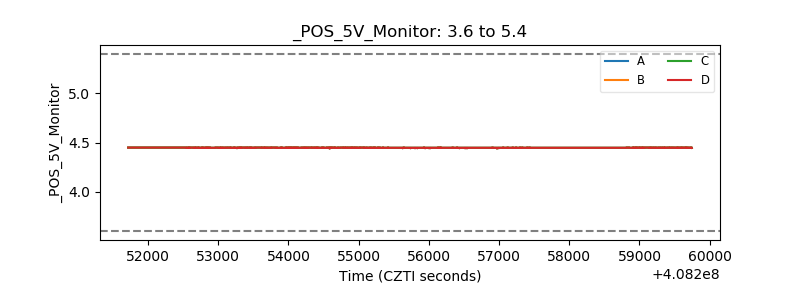 |
| _ROLL_ROT | 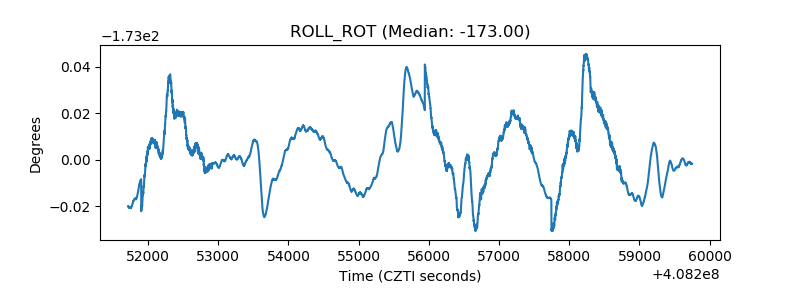 |
| _Roll_DEC | 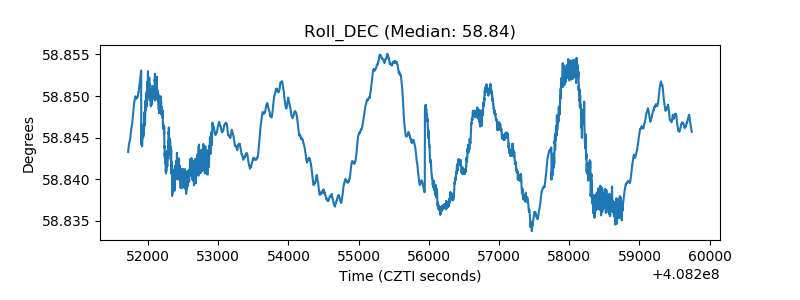 |
| _Roll_RA | 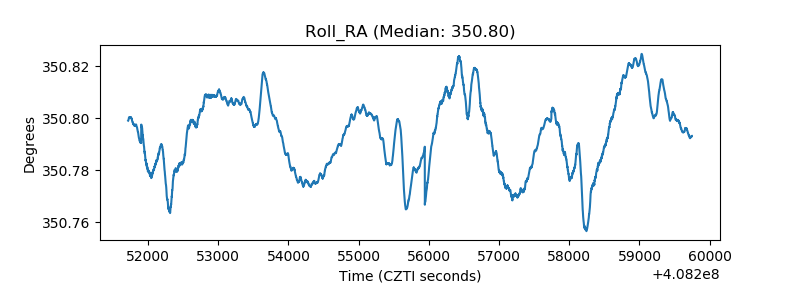 |
| Veto Counter | 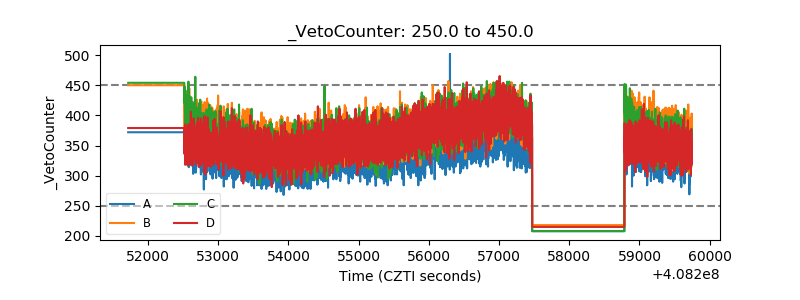 |