| Param | Original file | Final file |
|---|---|---|
| Filename | modeM0/AS1T05_064T01_9000005416_38919cztM0_level2.fits | modeM0/AS1T05_064T01_9000005416_38919cztM0_level2_quad_clean.evt |
| Size (bytes) | 1,265,296,320 | 243,336,960 |
| Size | 1.2 GB | 232.1 MB |
| Events in quadrant A | 9,591,834 | 1,702,072 |
| Events in quadrant B | 7,201,297 | 1,753,002 |
| Events in quadrant C | 7,332,543 | 1,684,325 |
| Events in quadrant D | 21,501,307 | 1,147,591 |
| Mode SS | |||
|---|---|---|---|
| Quadrant | BADHDUFLAG | Total packets | Discarded packets |
| A | 0 | 320 | 0 |
| B | 0 | 320 | 0 |
| C | 0 | 320 | 0 |
| D | 0 | 320 | 0 |
| Mode M9 | |||
|---|---|---|---|
| Quadrant | BADHDUFLAG | Total packets | Discarded packets |
| A | 0 | 44 | 0 |
| B | 0 | 44 | 0 |
| C | 0 | 44 | 0 |
| D | 0 | 45 | 0 |
| Mode M0 | |||
|---|---|---|---|
| Quadrant | BADHDUFLAG | Total packets | Discarded packets |
| A | 0 | 38097 | 5 |
| B | 0 | 32204 | 4 |
| C | 0 | 31592 | 4 |
| D | 0 | 74716 | 4 |
| Quadrant | Total seconds | Saturated seconds | Saturation percentage |
|---|---|---|---|
| A | 15652 | 154 | 0.983900% |
| B | 15652 | 52 | 0.332226% |
| C | 15652 | 10 | 0.063890% |
| D | 15652 | 4128 | 26.373626% |
Noise dominated data is calculated using 1-second bins in cleaned event files. If a bin has >2000 counts, and if more than 50% of those come from <1% of pixels, then it is considered to be noise-dominated and hence unusable.
| Quadrant | # 1 sec bins | Bins with >0 counts | Bins with >2000 counts | High rate bins dominated by noise | Noise dominated (total time) | Noise dominated (detector-on time) | Marked lightcurve |
|---|---|---|---|---|---|---|---|
| A | 19830 | 15655 | 111 | 111 | 0.56% | 0.71% | 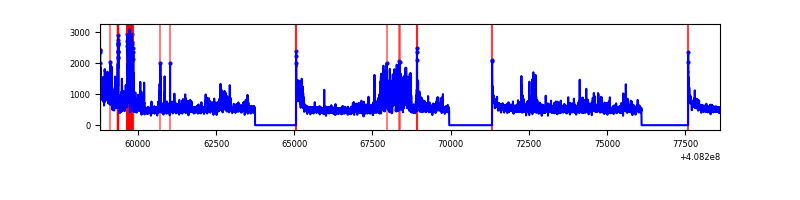 |
| B | 19830 | 15655 | 31 | 31 | 0.16% | 0.20% | 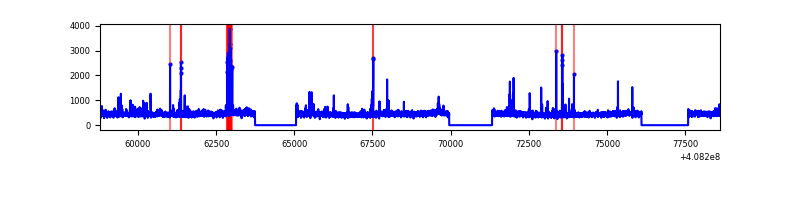 |
| C | 19830 | 15655 | 4 | 4 | 0.02% | 0.03% | 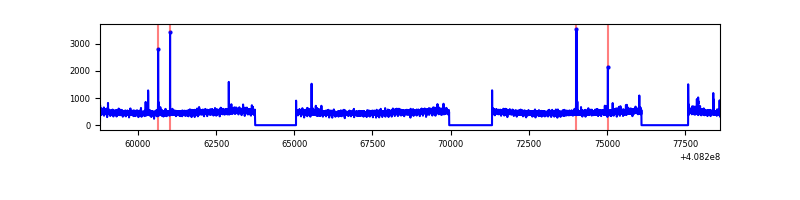 |
| D | 19830 | 15654 | 4077 | 4077 | 20.56% | 26.04% | 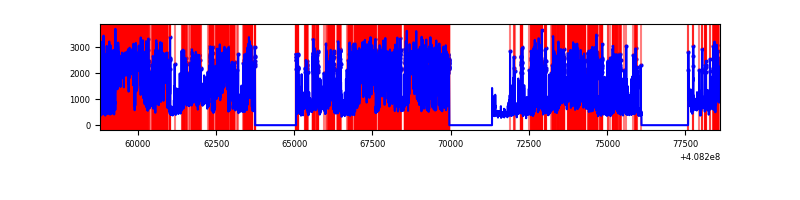 |
Top three noisy pixels from each quadrant. If the there are fewer than three noisy pixels in the level2.evt file, extra rows are filled as -1
| Pixel properties | Quadrant properties | ||||||
|---|---|---|---|---|---|---|---|
| Quadrant | DetID | PixID | Counts | Sigma | Mean | Median | Sigma |
| A | 12 | 16 | 1153558 | 3305.3 | 1725 | 1689 | 348.5 |
| A | 10 | 83 | 1097619 | 3144.78 | 1725 | 1689 | 348.5 |
| A | 13 | 248 | 359106 | 1025.61 | 1725 | 1689 | 348.5 |
| B | 5 | 200 | 155931 | 471.9 | 1717 | 1671 | 326.9 |
| B | 0 | 230 | 76947 | 230.28 | 1717 | 1671 | 326.9 |
| B | 5 | 172 | 49964 | 147.74 | 1717 | 1671 | 326.9 |
| C | 15 | 214 | 654604 | 1662.71 | 1693 | 1703 | 392.7 |
| C | 12 | 249 | 46981 | 115.31 | 1693 | 1703 | 392.7 |
| C | 3 | 233 | 21615 | 50.71 | 1693 | 1703 | 392.7 |
| D | 2 | 250 | 4540229 | 12471.25 | 1499 | 1459 | 363.9 |
| D | 1 | 52 | 3518695 | 9664.37 | 1499 | 1459 | 363.9 |
| D | 12 | 235 | 2667517 | 7325.57 | 1499 | 1459 | 363.9 |
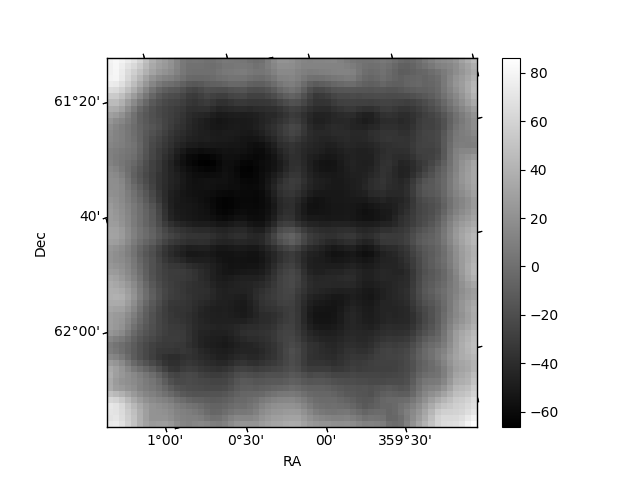
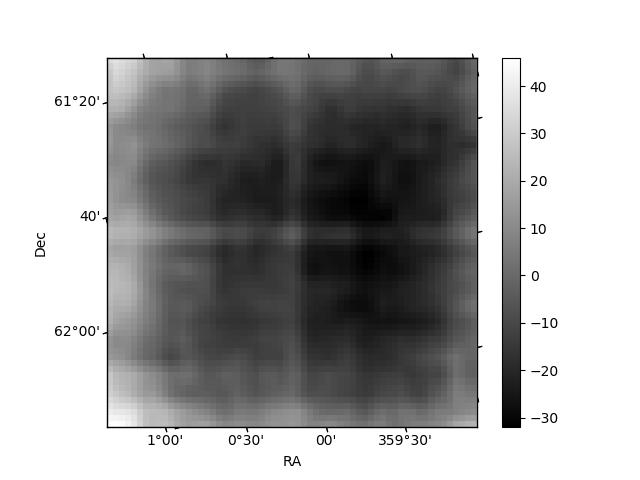
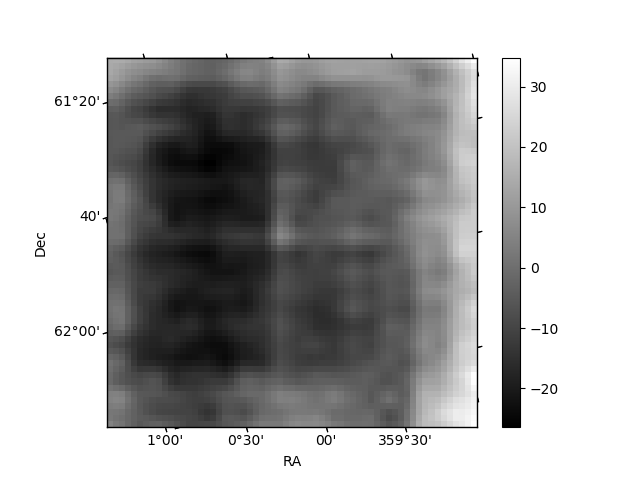
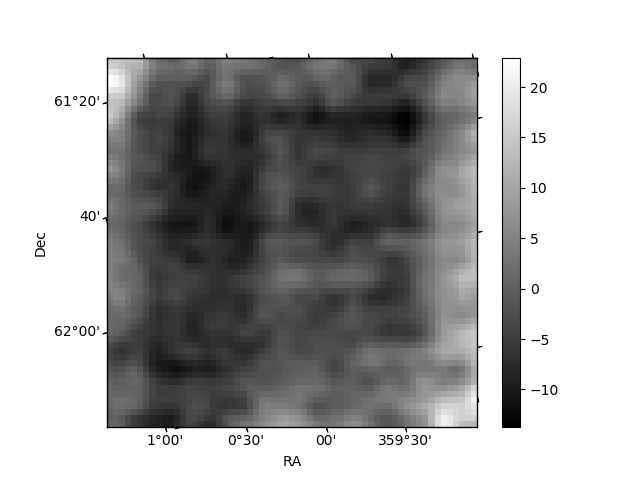
Histogram calculated using DETX and DETY for each event in the final _common_clean file
| Quadrant A | 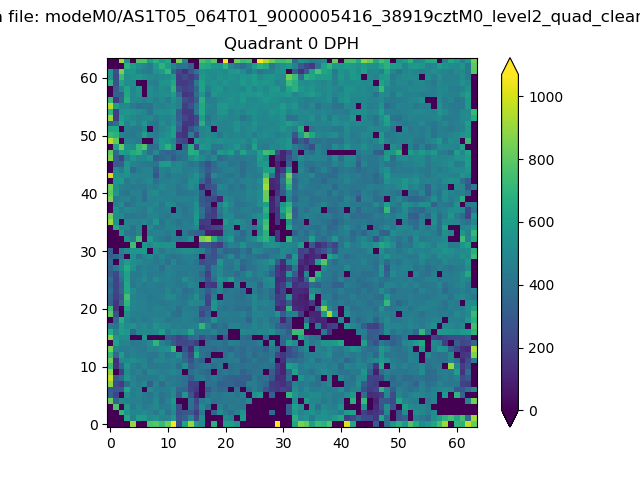 |
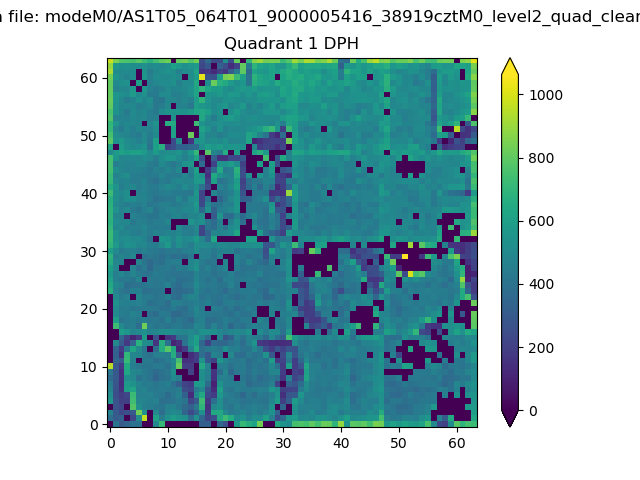 |
Quadrant B |
|---|---|---|---|
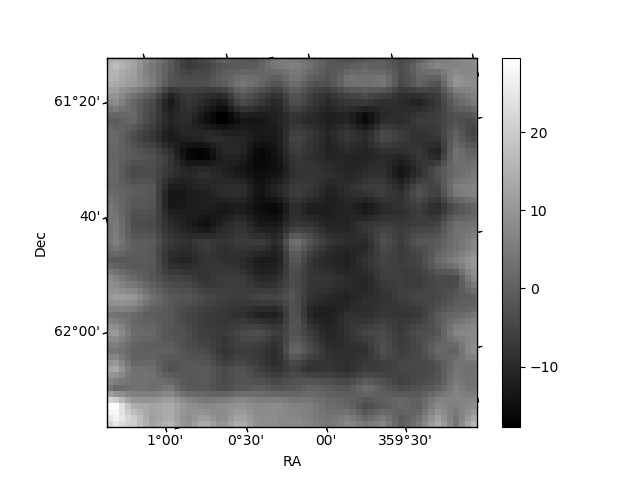
| Quadrant D |  |
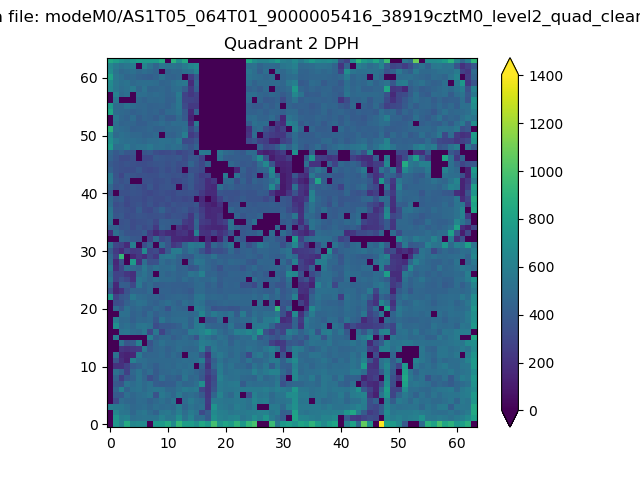 |
Quadrant C |
| Plot type | Count rate plots | Images |
|---|---|---|
| Comparison with Poisson distribution Blue bars denote a histogram of data divided into 1 sec bins. Red curve is a Poisson curve with rate = median count rate of data. |
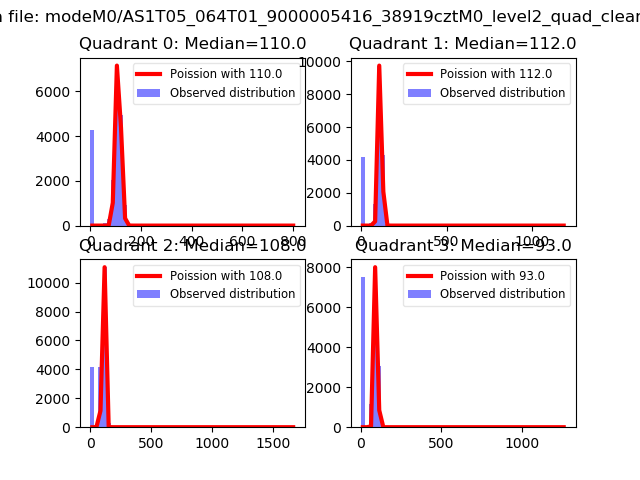 |
 |
| Quadrant-wise count rates Data is divided into 100 sec bins |
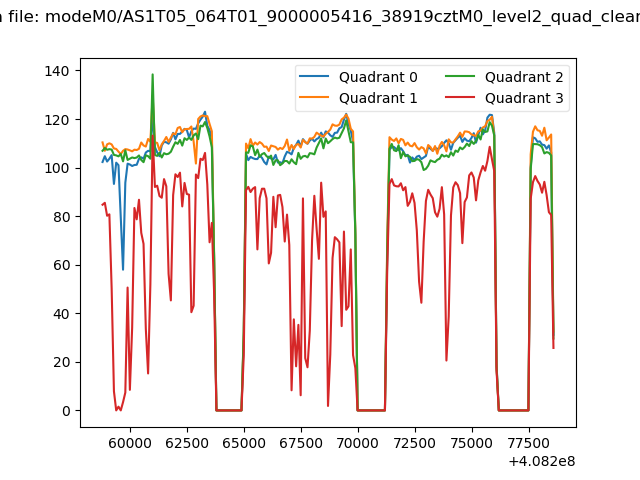 |
|
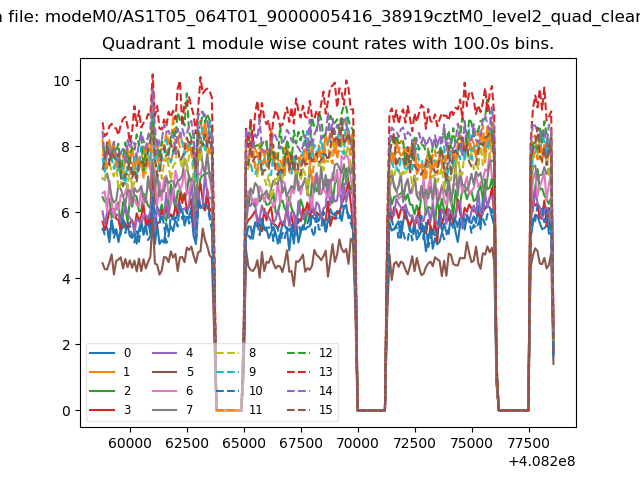
| Module-wise count rates for Quadrant A Data is divided into 100 sec bins |
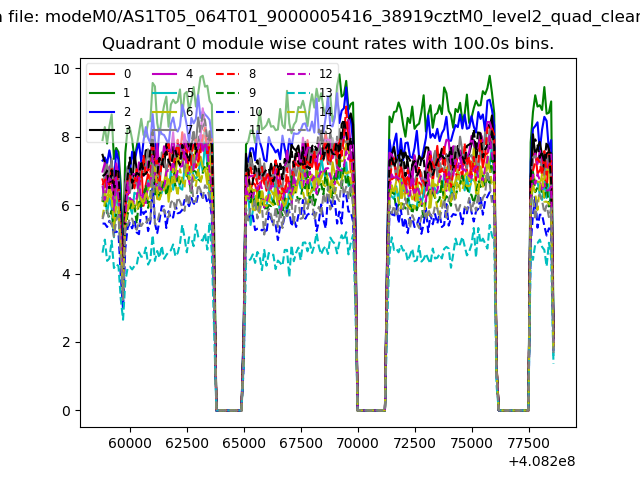 |
 |
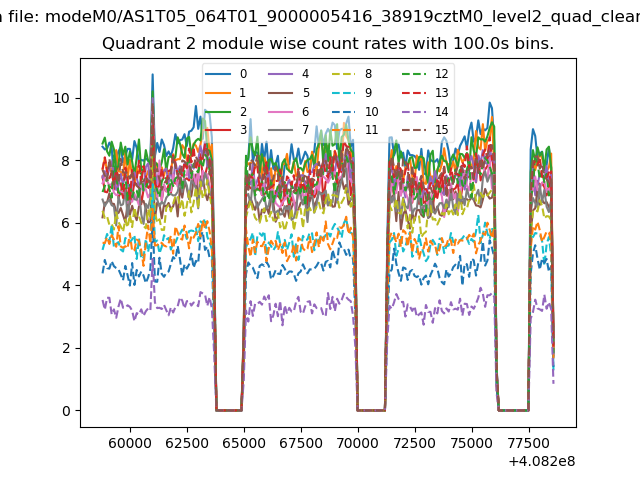
| Module-wise count rates for Quadrant B Data is divided into 100 sec bins |
 |
 |
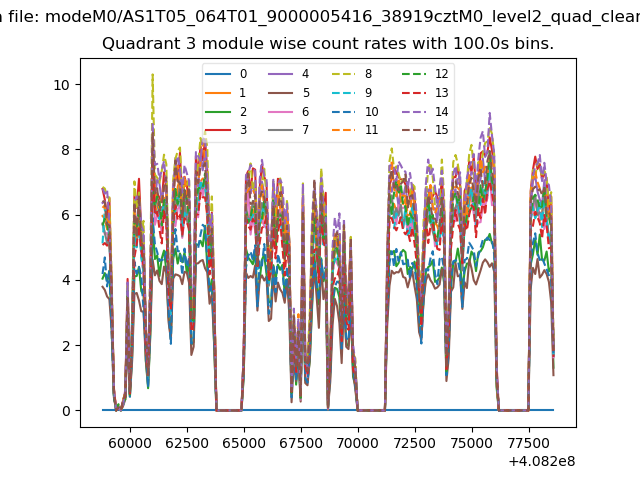
| Module-wise count rates for Quadrant C Data is divided into 100 sec bins |
 |
 |
| Module-wise count rates for Quadrant D Data is divided into 100 sec bins |
 |
 |
| Parameter | Plot |
|---|---|
| CZT HV Monitor | 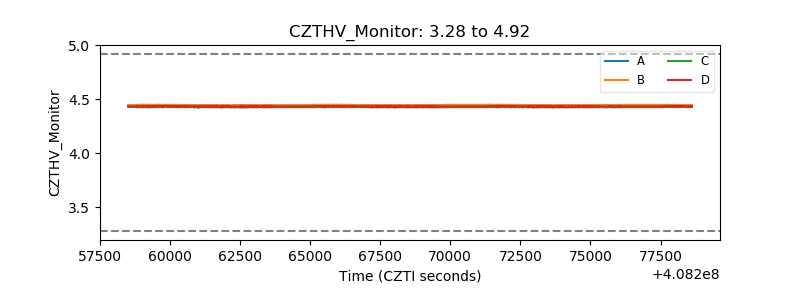 |
| D_VDD | 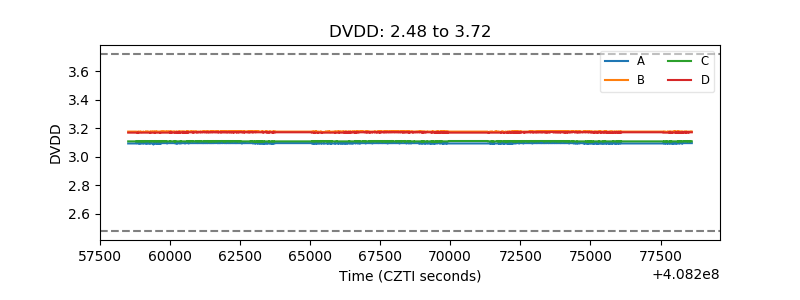 |
| Temperature 1 | 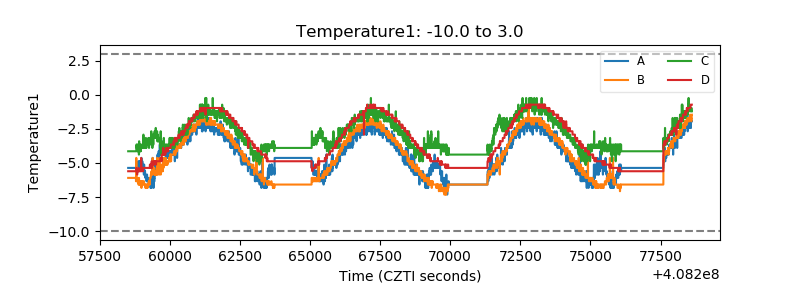 |
| Veto HV Monitor | 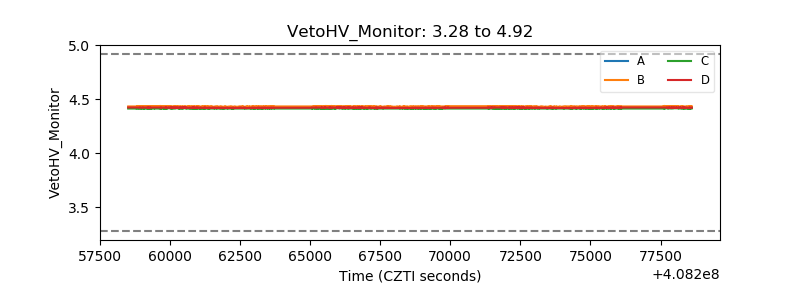 |
| Veto LLD | 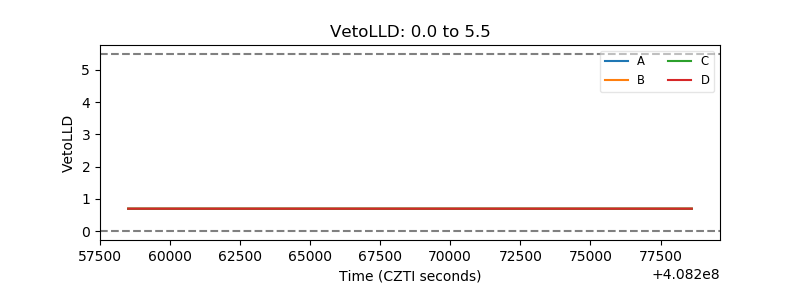 |
| Alpha Counter | 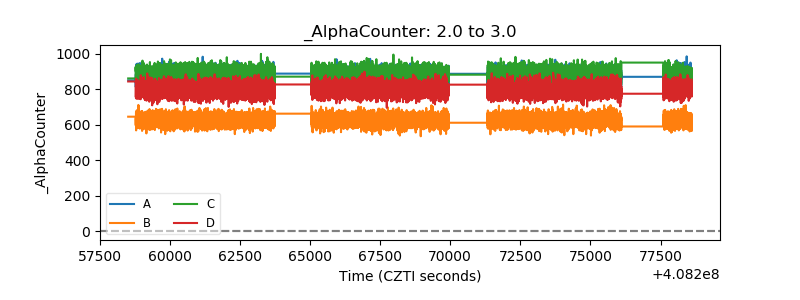 |
| _CPM_Rate | 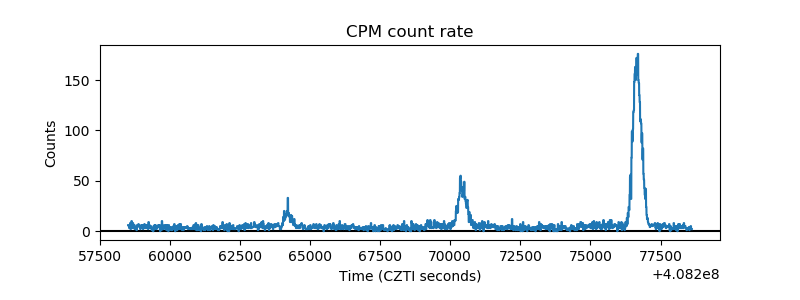 |
| CZT Counter | 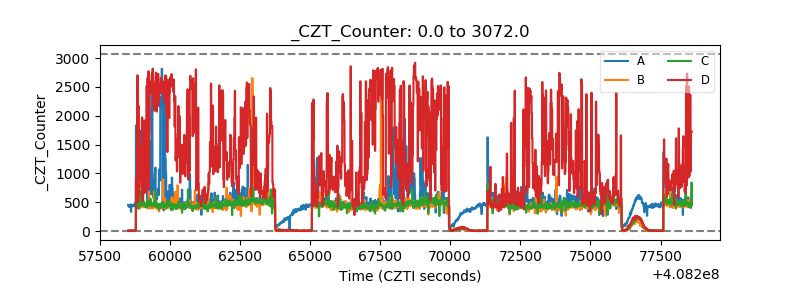 |
| +2.5 Volts monitor | 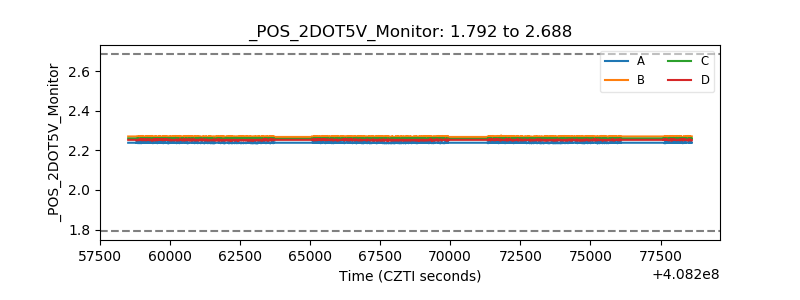 |
| +5 Volts monitor | 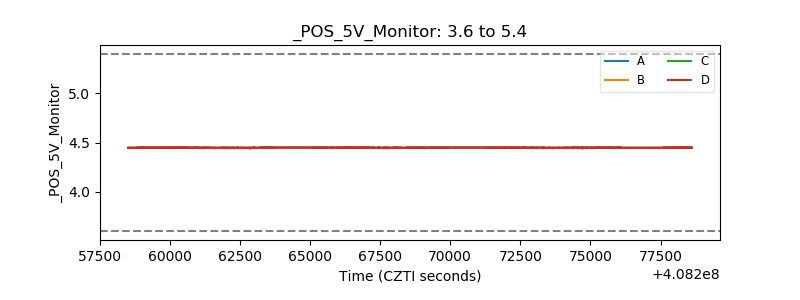 |
| _ROLL_ROT | 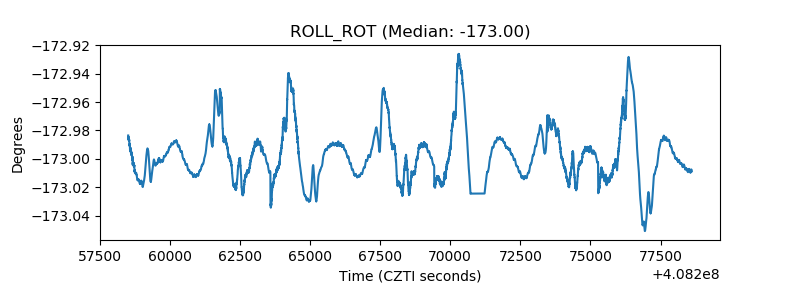 |
| _Roll_DEC | 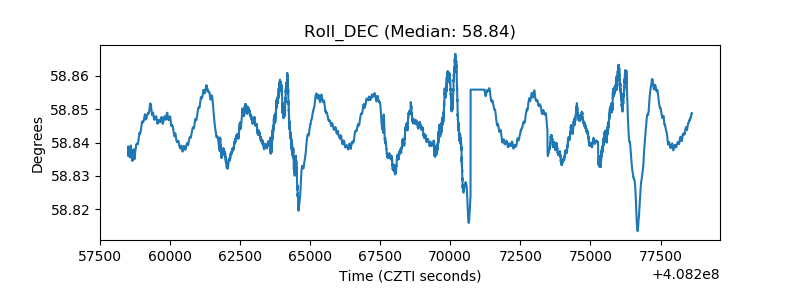 |
| _Roll_RA | 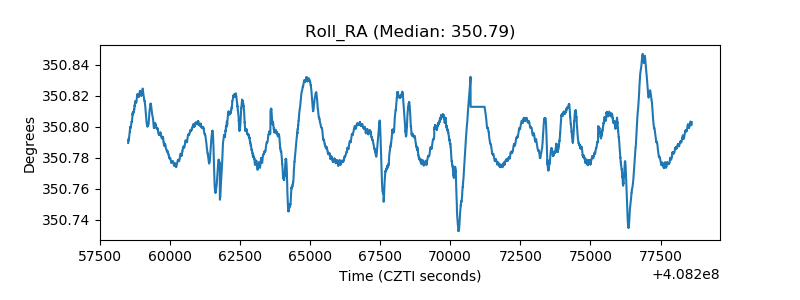 |
| Veto Counter |  |