| Param | Original file | Final file |
|---|---|---|
| Filename | modeM0/AS1T05_064T01_9000005416_38920cztM0_level2.fits | modeM0/AS1T05_064T01_9000005416_38920cztM0_level2_quad_clean.evt |
| Size (bytes) | 455,973,120 | 90,025,920 |
| Size | 434.8 MB | 85.9 MB |
| Events in quadrant A | 3,108,576 | 624,532 |
| Events in quadrant B | 2,657,056 | 631,543 |
| Events in quadrant C | 2,633,408 | 606,884 |
| Events in quadrant D | 8,046,571 | 472,476 |
| Mode SS | |||
|---|---|---|---|
| Quadrant | BADHDUFLAG | Total packets | Discarded packets |
| A | 0 | 114 | 0 |
| B | 0 | 114 | 0 |
| C | 0 | 114 | 0 |
| D | 0 | 114 | 0 |
| Mode M9 | |||
|---|---|---|---|
| Quadrant | BADHDUFLAG | Total packets | Discarded packets |
| A | 0 | 16 | 0 |
| B | 0 | 16 | 0 |
| C | 0 | 16 | 0 |
| D | 0 | 16 | 0 |
| Mode M0 | |||
|---|---|---|---|
| Quadrant | BADHDUFLAG | Total packets | Discarded packets |
| A | 0 | 12769 | 3 |
| B | 0 | 11722 | 2 |
| C | 0 | 11319 | 2 |
| D | 0 | 27821 | 2 |
| Quadrant | Total seconds | Saturated seconds | Saturation percentage |
|---|---|---|---|
| A | 5577 | 19 | 0.340685% |
| B | 5577 | 50 | 0.896539% |
| C | 5577 | 5 | 0.089654% |
| D | 5577 | 1110 | 19.903174% |
Noise dominated data is calculated using 1-second bins in cleaned event files. If a bin has >2000 counts, and if more than 50% of those come from <1% of pixels, then it is considered to be noise-dominated and hence unusable.
| Quadrant | # 1 sec bins | Bins with >0 counts | Bins with >2000 counts | High rate bins dominated by noise | Noise dominated (total time) | Noise dominated (detector-on time) | Marked lightcurve |
|---|---|---|---|---|---|---|---|
| A | 7189 | 5578 | 5 | 5 | 0.07% | 0.09% | 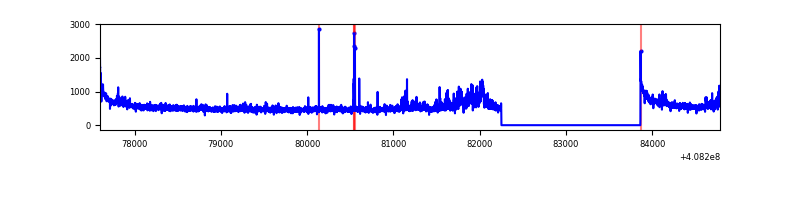 |
| B | 7189 | 5578 | 41 | 41 | 0.57% | 0.74% | 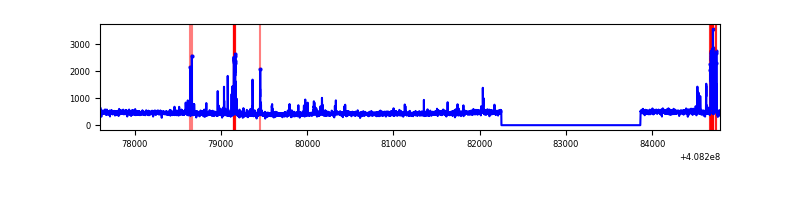 |
| C | 7189 | 5578 | 2 | 2 | 0.03% | 0.04% | 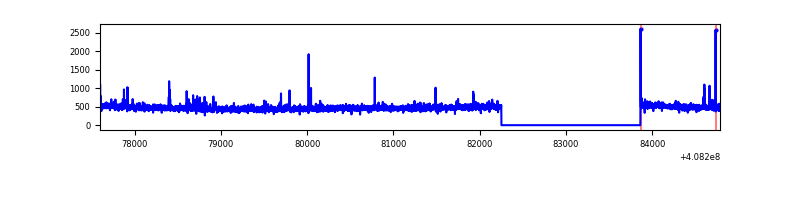 |
| D | 7189 | 5578 | 1151 | 1151 | 16.01% | 20.63% | 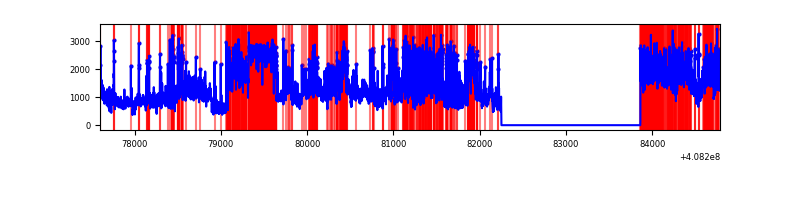 |
Top three noisy pixels from each quadrant. If the there are fewer than three noisy pixels in the level2.evt file, extra rows are filled as -1
| Pixel properties | Quadrant properties | ||||||
|---|---|---|---|---|---|---|---|
| Quadrant | DetID | PixID | Counts | Sigma | Mean | Median | Sigma |
| A | 10 | 83 | 440636 | 3526.76 | 616 | 605 | 124.8 |
| A | 12 | 16 | 191914 | 1533.3 | 616 | 605 | 124.8 |
| A | 12 | 194 | 32359 | 254.5 | 616 | 605 | 124.8 |
| B | 5 | 200 | 126620 | 1081.73 | 610 | 593 | 116.5 |
| B | 5 | 172 | 61126 | 519.57 | 610 | 593 | 116.5 |
| B | 0 | 155 | 29839 | 251.03 | 610 | 593 | 116.5 |
| C | 15 | 214 | 229719 | 1631.5 | 602 | 603 | 140.4 |
| C | 12 | 249 | 41153 | 288.75 | 602 | 603 | 140.4 |
| C | 15 | 159 | 5594 | 35.54 | 602 | 603 | 140.4 |
| D | 12 | 227 | 2111799 | 15303.67 | 564 | 547 | 138.0 |
| D | 1 | 52 | 1961008 | 14210.64 | 564 | 547 | 138.0 |
| D | 12 | 235 | 1040034 | 7534.85 | 564 | 547 | 138.0 |
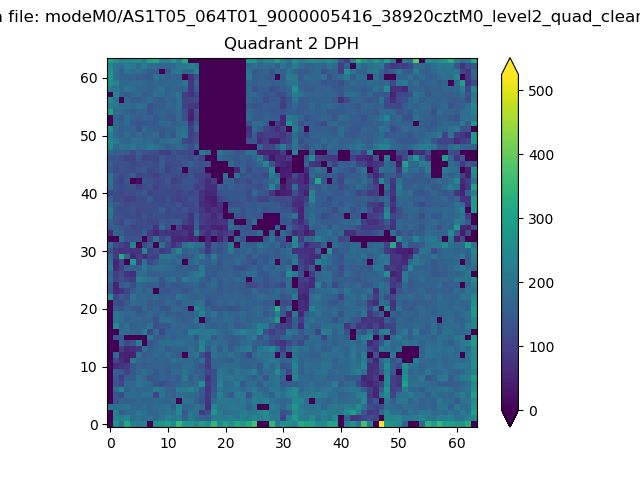
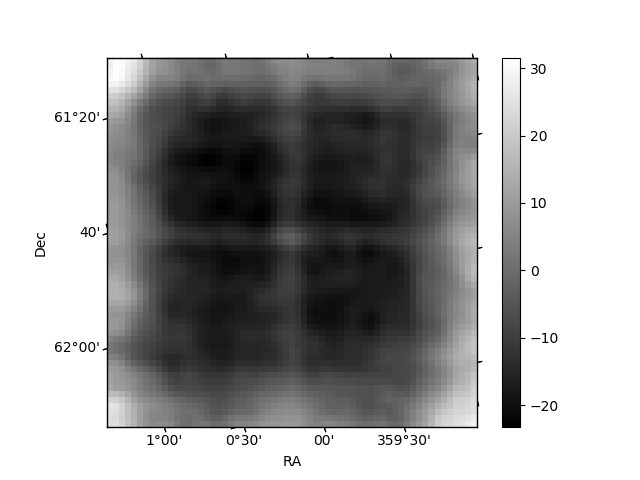
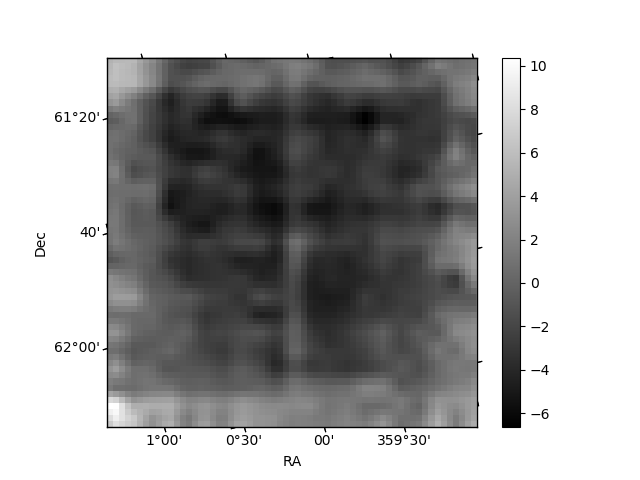
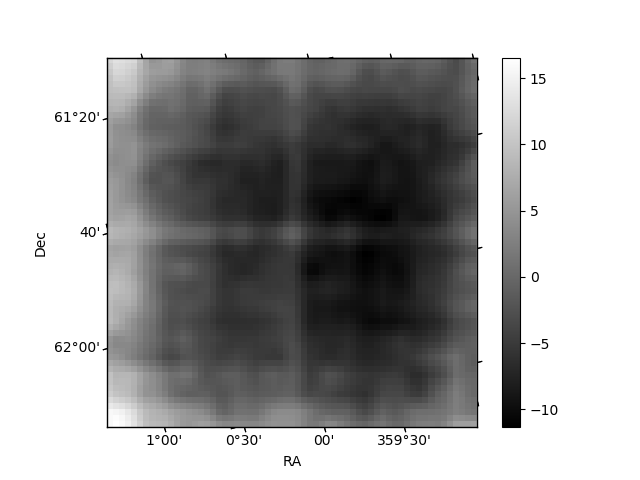
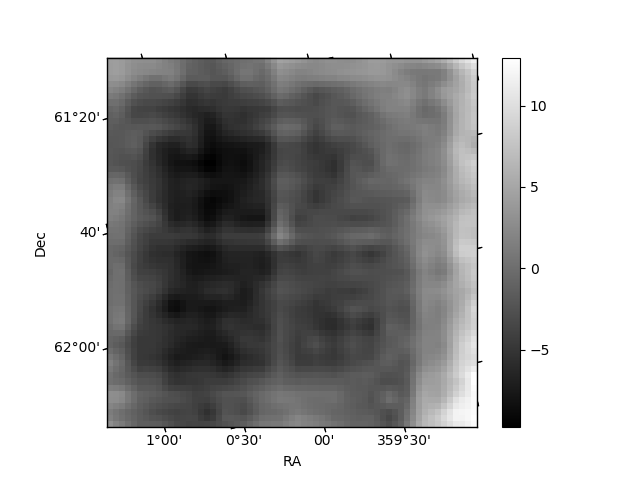
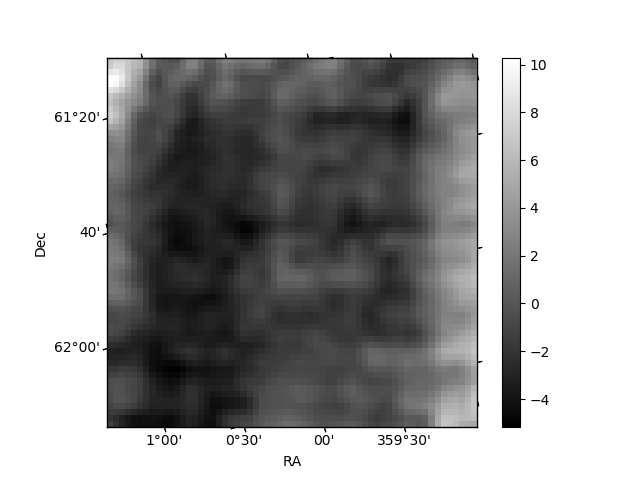
Histogram calculated using DETX and DETY for each event in the final _common_clean file
| Quadrant A | 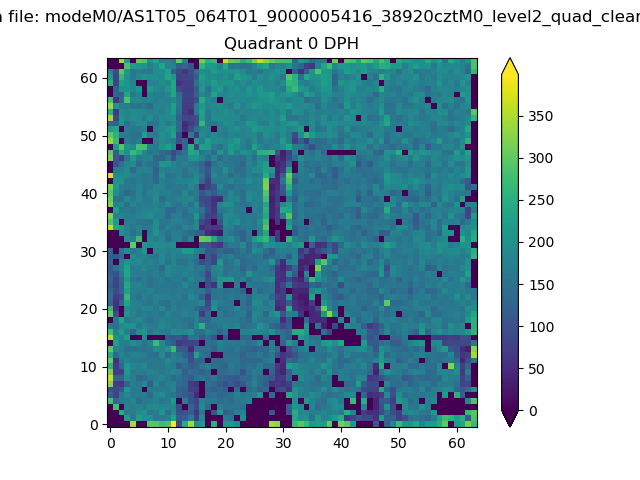 |
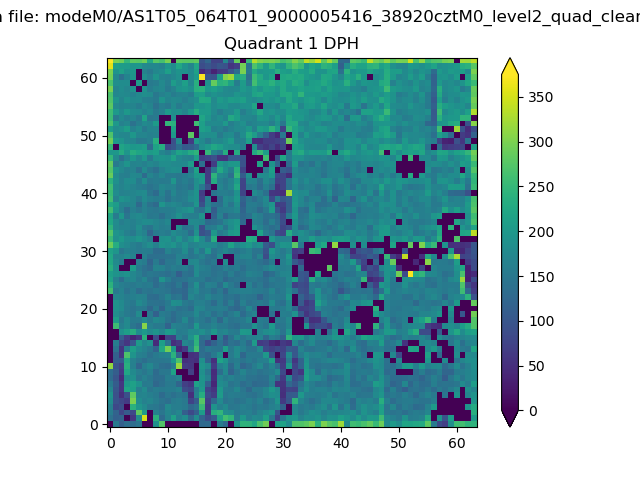 |
Quadrant B |
|---|---|---|---|
| Quadrant D | 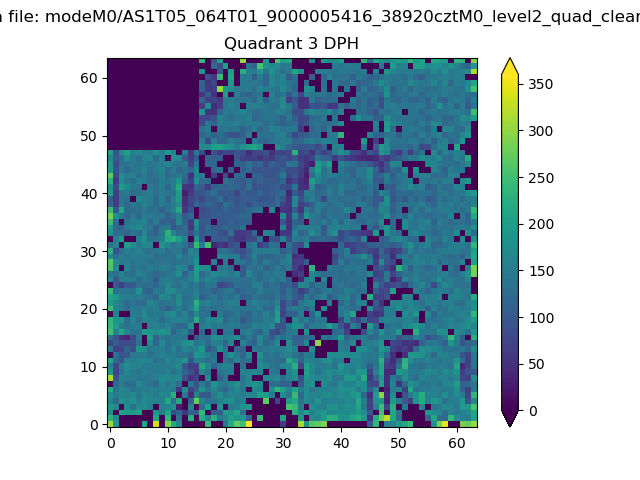 |
 |
Quadrant C |
| Plot type | Count rate plots | Images |
|---|---|---|
| Comparison with Poisson distribution Blue bars denote a histogram of data divided into 1 sec bins. Red curve is a Poisson curve with rate = median count rate of data. |
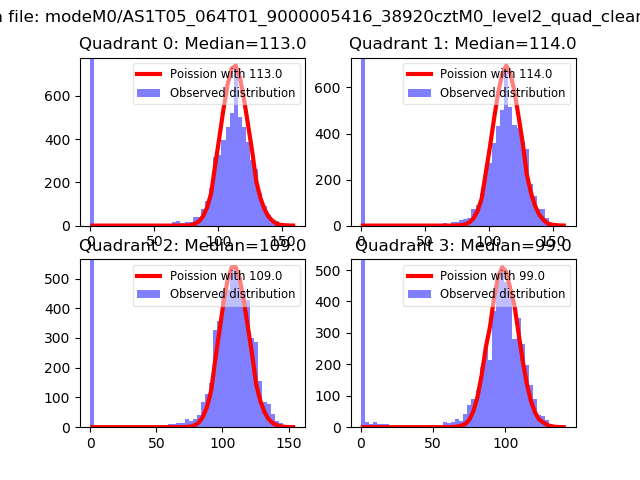 |
 |
| Quadrant-wise count rates Data is divided into 100 sec bins |
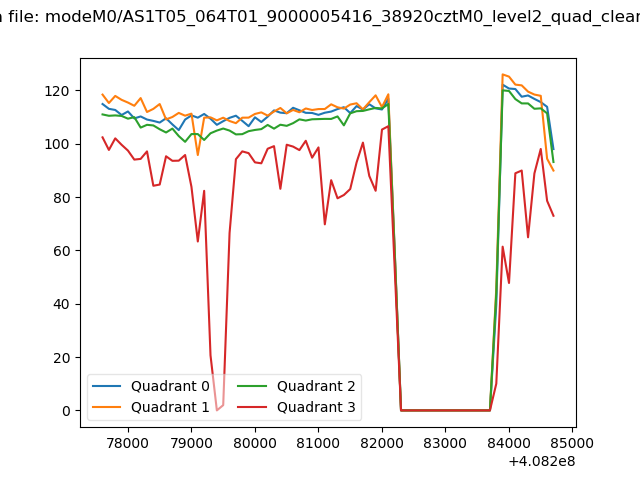 |
|
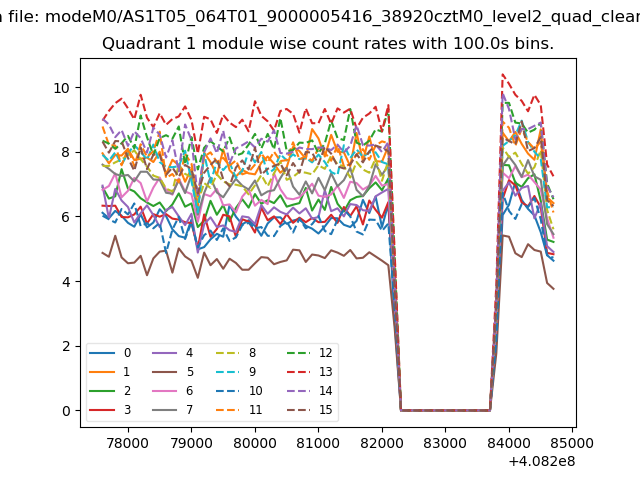
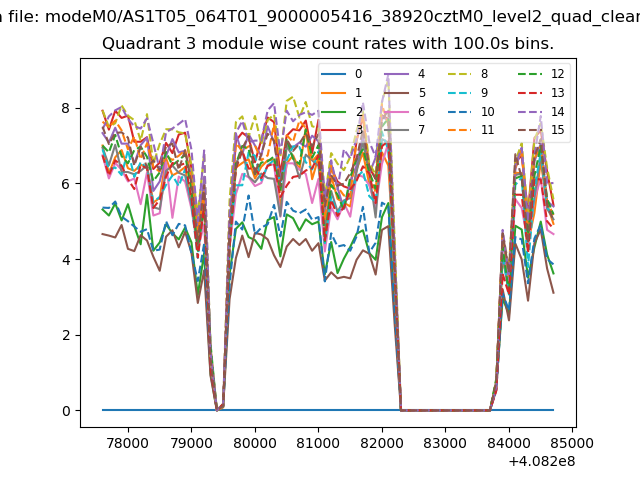
| Module-wise count rates for Quadrant A Data is divided into 100 sec bins |
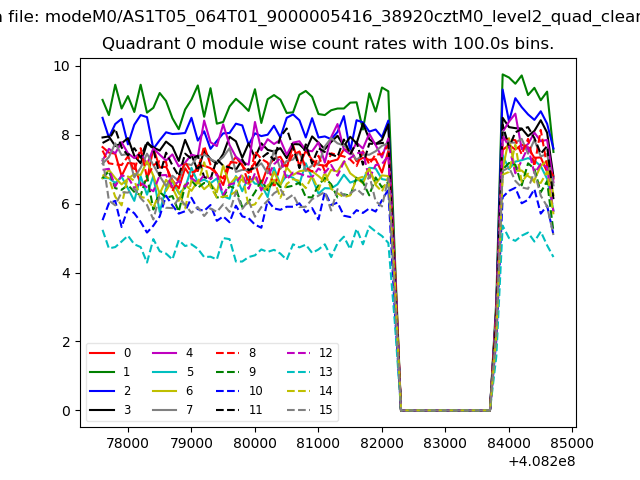 |
 |
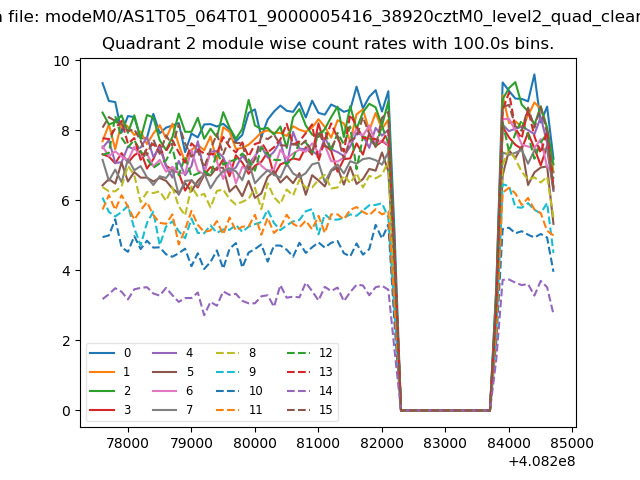
| Module-wise count rates for Quadrant B Data is divided into 100 sec bins |
 |
 |
| Module-wise count rates for Quadrant C Data is divided into 100 sec bins |
 |
 |
| Module-wise count rates for Quadrant D Data is divided into 100 sec bins |
 |
 |
| Parameter | Plot |
|---|---|
| CZT HV Monitor | 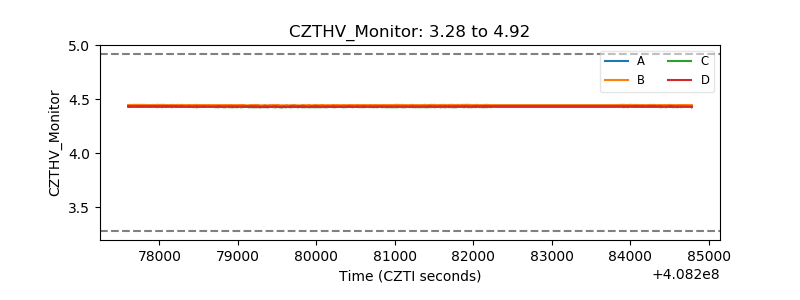 |
| D_VDD | 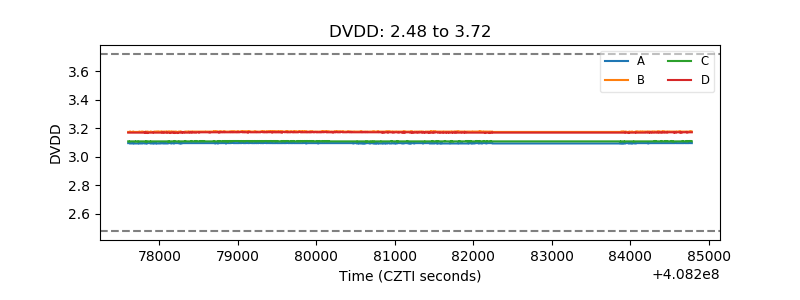 |
| Temperature 1 | 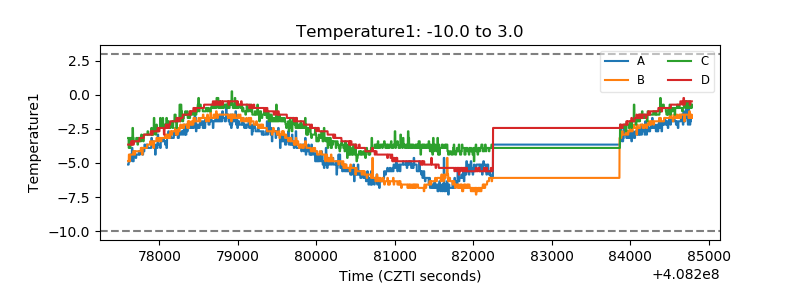 |
| Veto HV Monitor | 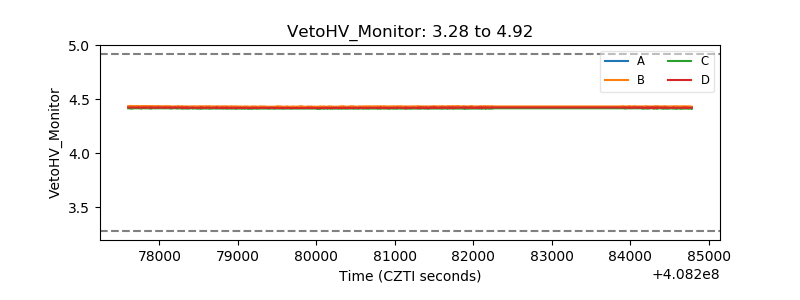 |
| Veto LLD | 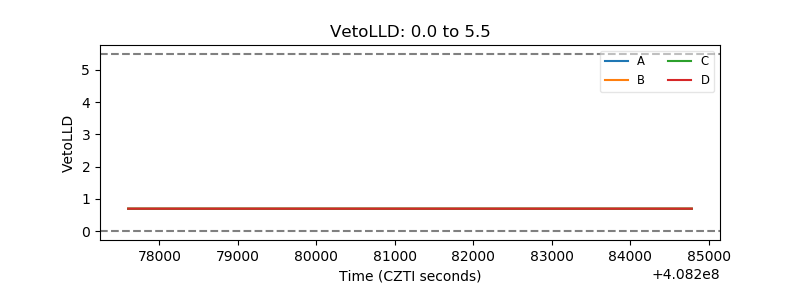 |
| Alpha Counter | 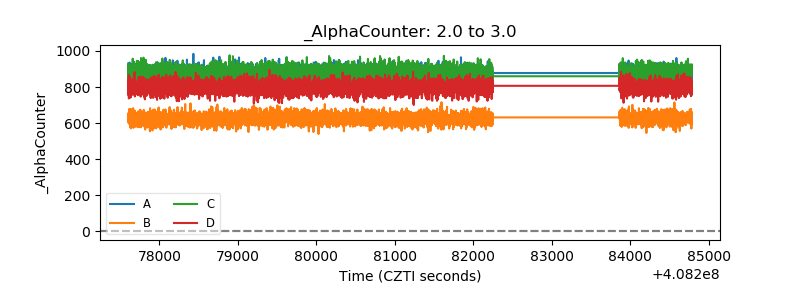 |
| _CPM_Rate | 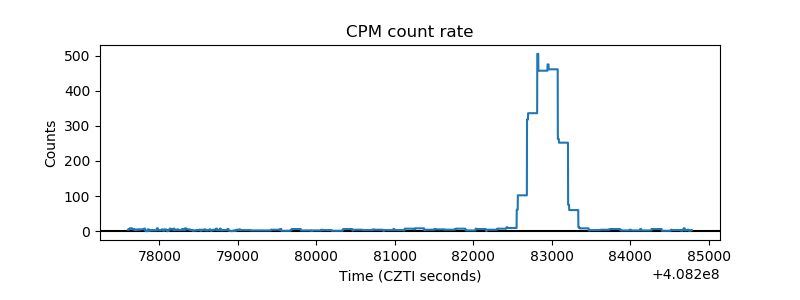 |
| CZT Counter | 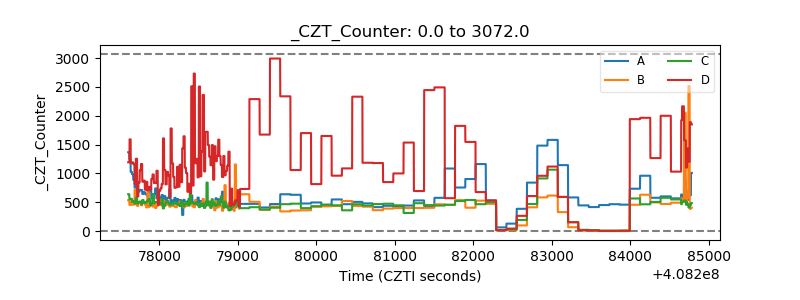 |
| +2.5 Volts monitor | 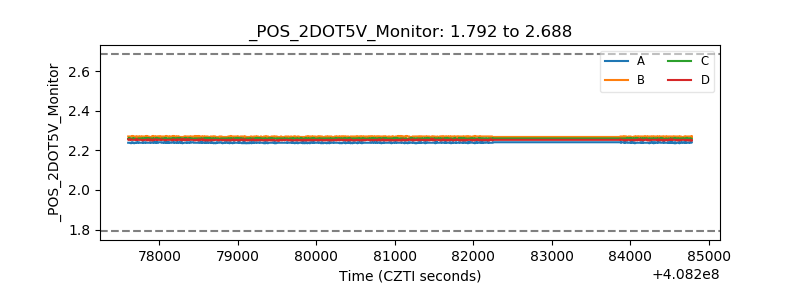 |
| +5 Volts monitor |  |
| _ROLL_ROT | 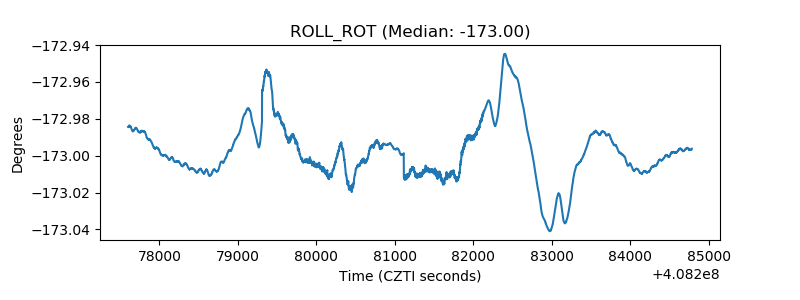 |
| _Roll_DEC | 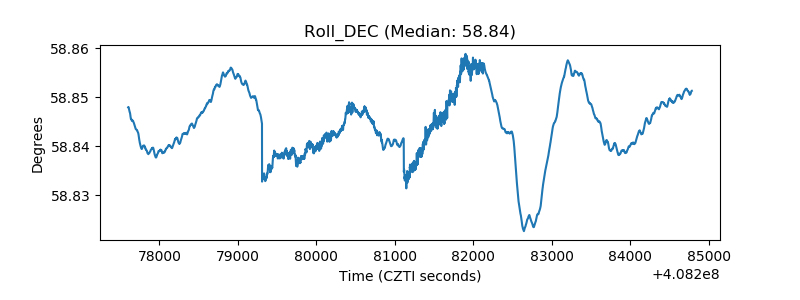 |
| _Roll_RA | 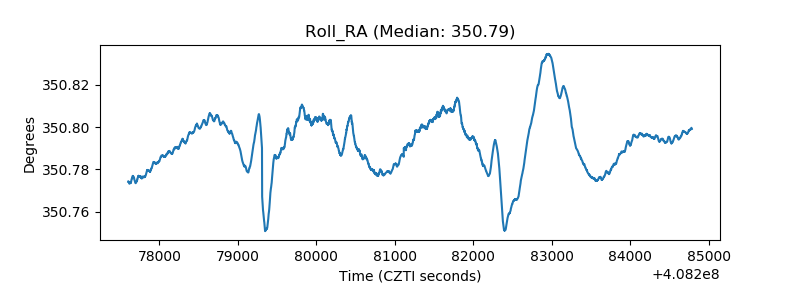 |
| Veto Counter | 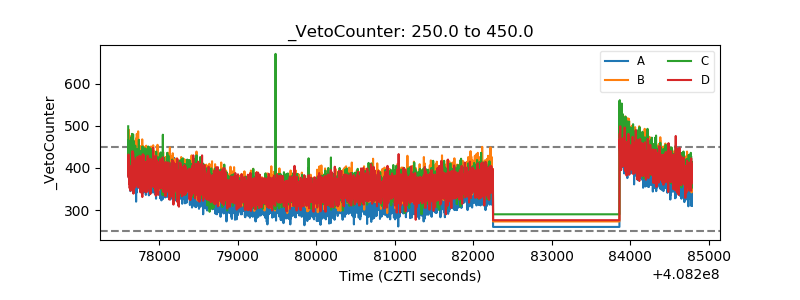 |