| Param | Original file | Final file |
|---|---|---|
| Filename | modeM0/AS1T05_064T01_9000005416_38922cztM0_level2.fits | modeM0/AS1T05_064T01_9000005416_38922cztM0_level2_quad_clean.evt |
| Size (bytes) | 470,972,160 | 91,837,440 |
| Size | 449.2 MB | 87.6 MB |
| Events in quadrant A | 3,400,343 | 645,991 |
| Events in quadrant B | 2,608,559 | 650,640 |
| Events in quadrant C | 2,645,790 | 625,689 |
| Events in quadrant D | 8,348,709 | 471,145 |
| Mode SS | |||
|---|---|---|---|
| Quadrant | BADHDUFLAG | Total packets | Discarded packets |
| A | 0 | 110 | 0 |
| B | 0 | 110 | 0 |
| C | 0 | 110 | 0 |
| D | 0 | 110 | 0 |
| Mode M9 | |||
|---|---|---|---|
| Quadrant | BADHDUFLAG | Total packets | Discarded packets |
| A | 0 | 18 | 0 |
| B | 0 | 18 | 0 |
| C | 0 | 18 | 0 |
| D | 0 | 18 | 0 |
| Mode M0 | |||
|---|---|---|---|
| Quadrant | BADHDUFLAG | Total packets | Discarded packets |
| A | 0 | 13785 | 2 |
| B | 0 | 11575 | 1 |
| C | 0 | 11314 | 1 |
| D | 0 | 28681 | 1 |
| Quadrant | Total seconds | Saturated seconds | Saturation percentage |
|---|---|---|---|
| A | 5543 | 18 | 0.324734% |
| B | 5543 | 37 | 0.667509% |
| C | 5543 | 9 | 0.162367% |
| D | 5543 | 1350 | 24.355042% |
Noise dominated data is calculated using 1-second bins in cleaned event files. If a bin has >2000 counts, and if more than 50% of those come from <1% of pixels, then it is considered to be noise-dominated and hence unusable.
| Quadrant | # 1 sec bins | Bins with >0 counts | Bins with >2000 counts | High rate bins dominated by noise | Noise dominated (total time) | Noise dominated (detector-on time) | Marked lightcurve |
|---|---|---|---|---|---|---|---|
| A | 7276 | 5544 | 4 | 4 | 0.05% | 0.07% | 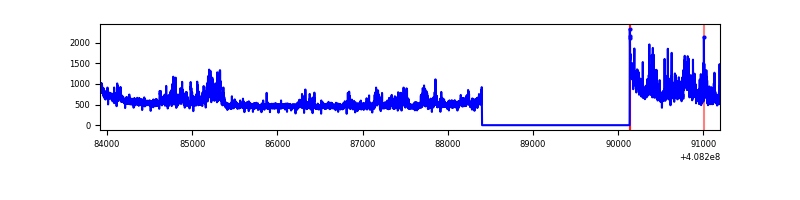 |
| B | 7276 | 5544 | 30 | 30 | 0.41% | 0.54% | 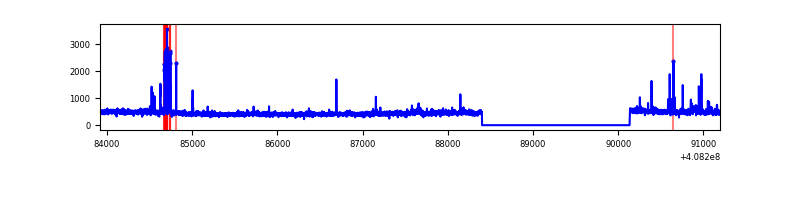 |
| C | 7276 | 5544 | 6 | 6 | 0.08% | 0.11% | 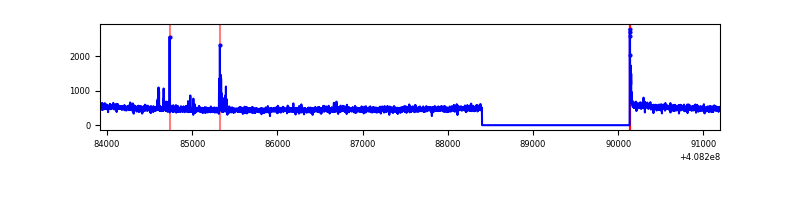 |
| D | 7275 | 5543 | 1333 | 1333 | 18.32% | 24.05% | 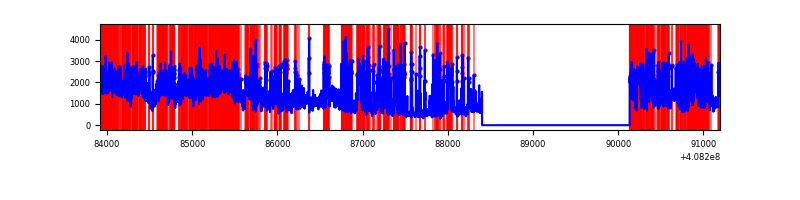 |
Top three noisy pixels from each quadrant. If the there are fewer than three noisy pixels in the level2.evt file, extra rows are filled as -1
| Pixel properties | Quadrant properties | ||||||
|---|---|---|---|---|---|---|---|
| Quadrant | DetID | PixID | Counts | Sigma | Mean | Median | Sigma |
| A | 10 | 83 | 425362 | 3383.18 | 619 | 605 | 125.5 |
| A | 12 | 16 | 408794 | 3251.21 | 619 | 605 | 125.5 |
| A | 13 | 248 | 70600 | 557.5 | 619 | 605 | 125.5 |
| B | 5 | 200 | 138010 | 1181.39 | 610 | 594 | 116.3 |
| B | 0 | 155 | 21443 | 179.24 | 610 | 594 | 116.3 |
| B | 5 | 172 | 20575 | 171.78 | 610 | 594 | 116.3 |
| C | 15 | 214 | 229449 | 1638.15 | 604 | 607 | 139.7 |
| C | 12 | 249 | 34439 | 242.18 | 604 | 607 | 139.7 |
| C | 0 | 10 | 21982 | 153.01 | 604 | 607 | 139.7 |
| D | 12 | 227 | 2041458 | 15343.23 | 549 | 534 | 133.0 |
| D | 1 | 52 | 1821081 | 13686.49 | 549 | 534 | 133.0 |
| D | 12 | 235 | 808245 | 6072.2 | 549 | 534 | 133.0 |
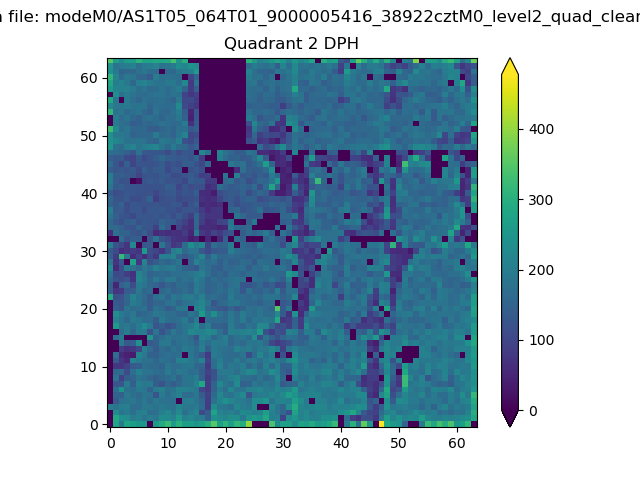
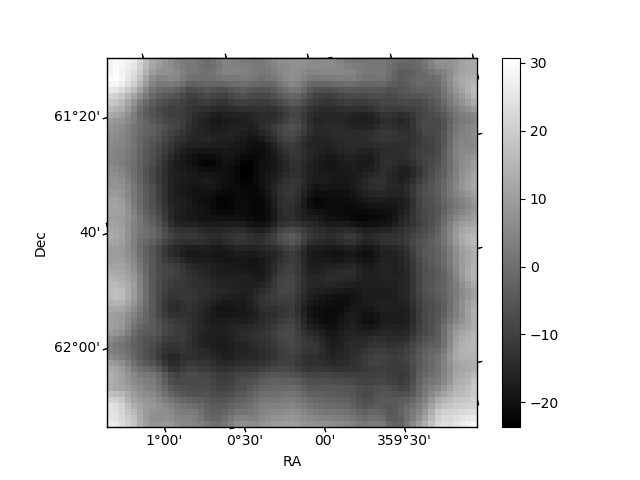
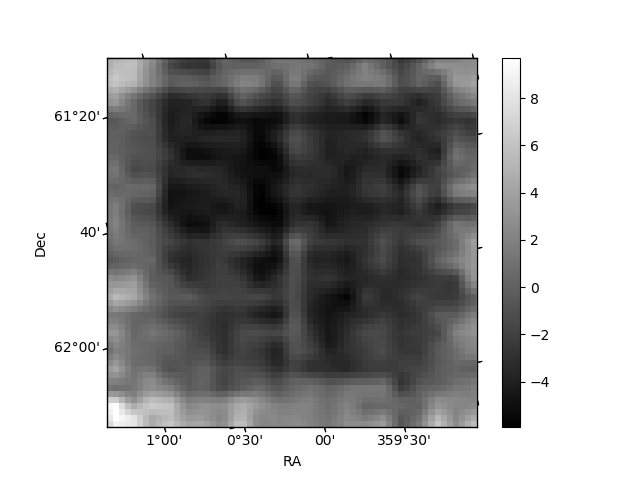
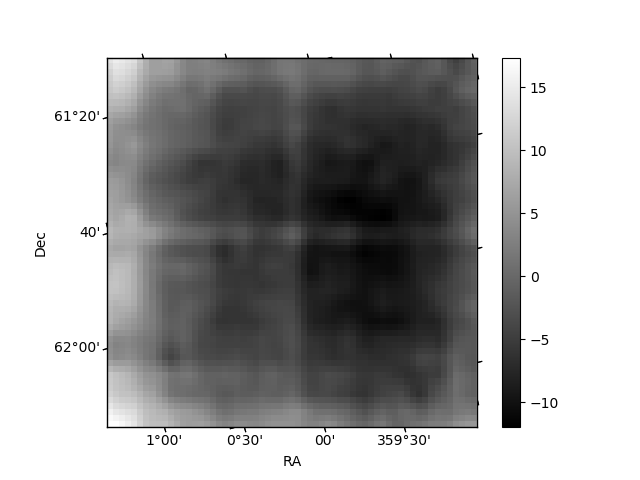
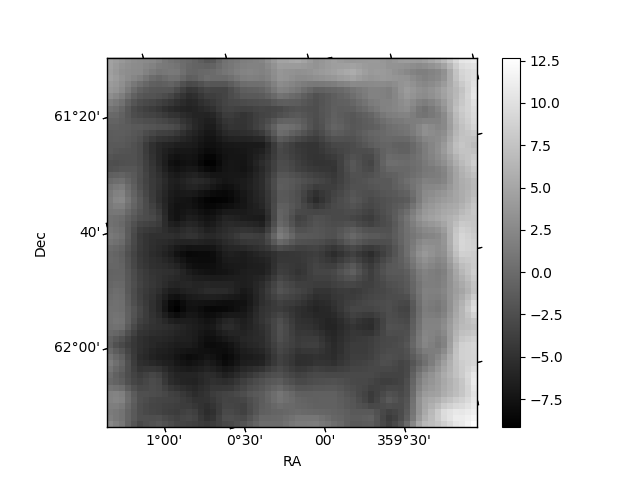
Histogram calculated using DETX and DETY for each event in the final _common_clean file
| Quadrant A | 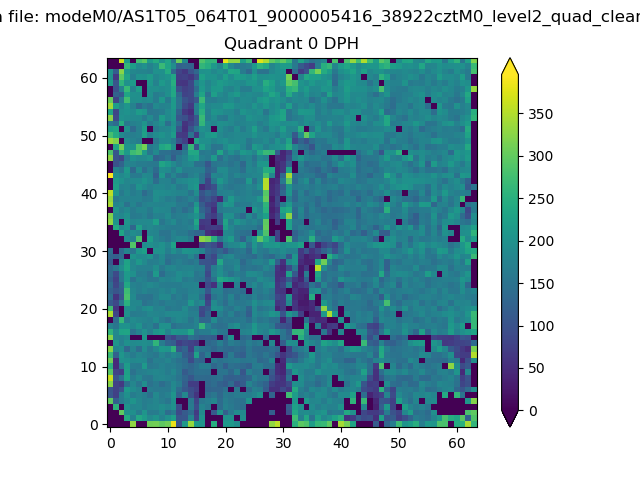 |
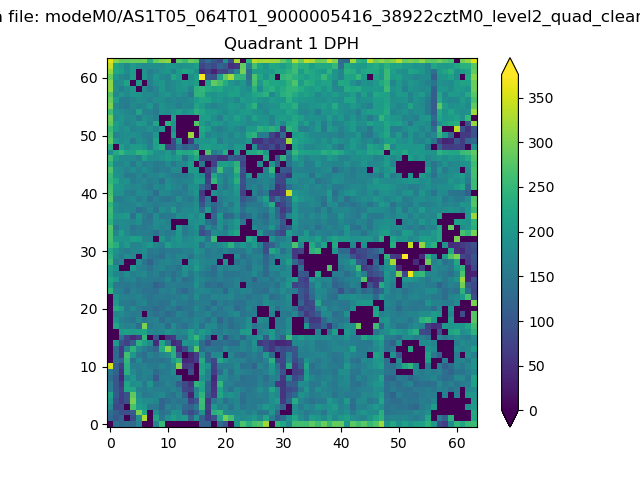 |
Quadrant B |
|---|---|---|---|
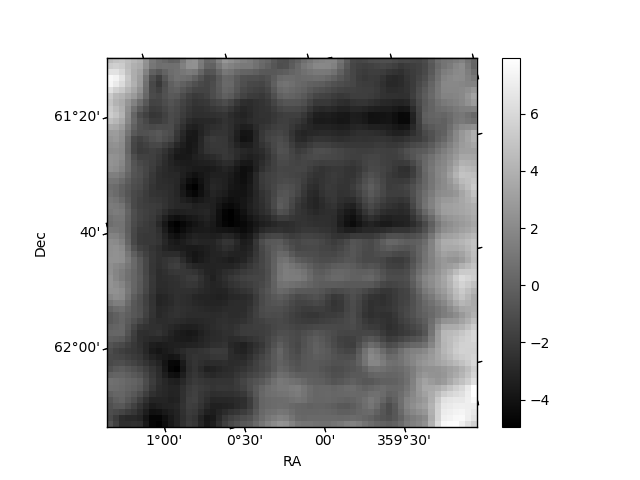
| Quadrant D | 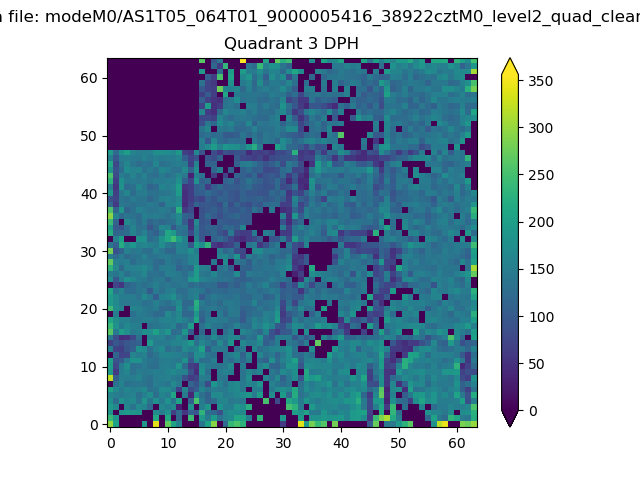 |
 |
Quadrant C |
| Plot type | Count rate plots | Images |
|---|---|---|
| Comparison with Poisson distribution Blue bars denote a histogram of data divided into 1 sec bins. Red curve is a Poisson curve with rate = median count rate of data. |
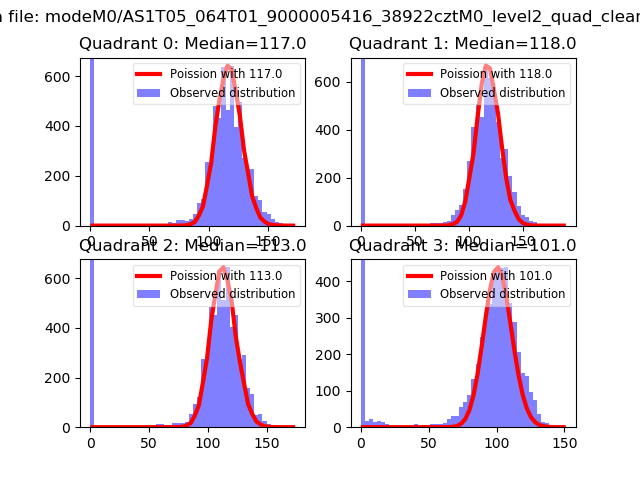 |
 |
| Quadrant-wise count rates Data is divided into 100 sec bins |
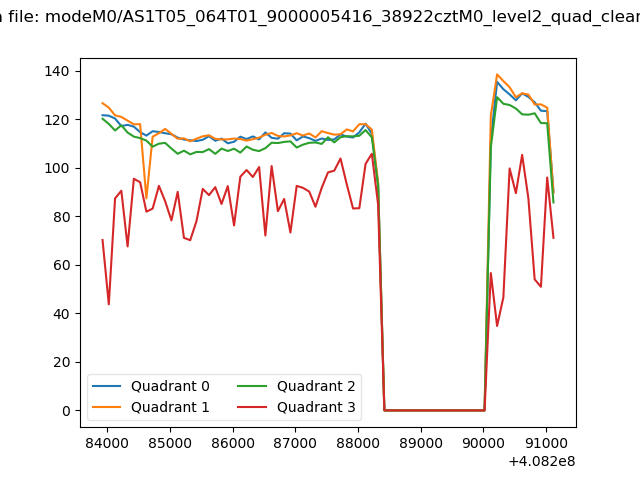 |
|
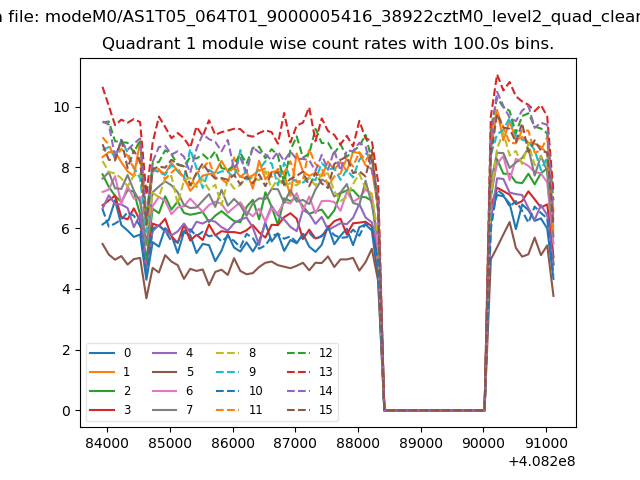
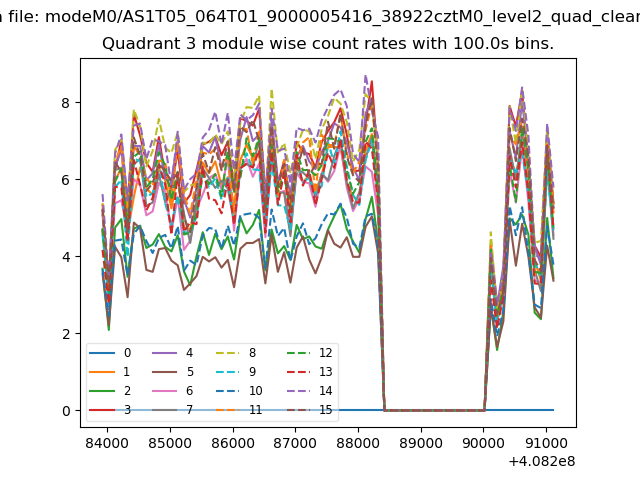
| Module-wise count rates for Quadrant A Data is divided into 100 sec bins |
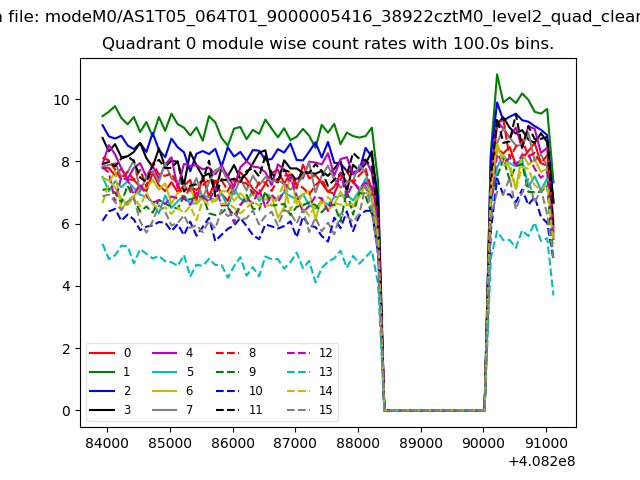 |
 |
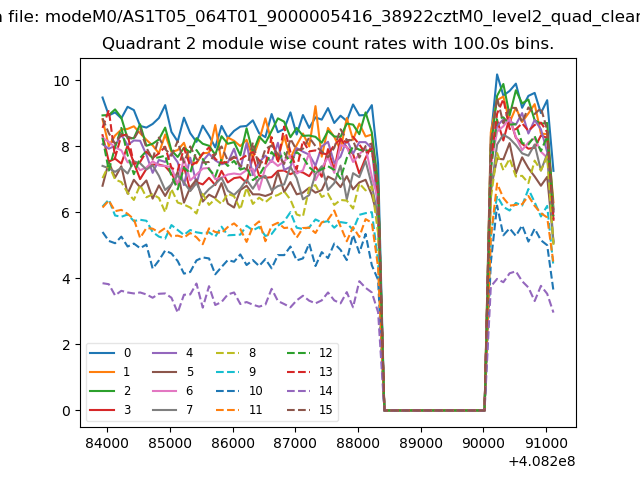
| Module-wise count rates for Quadrant B Data is divided into 100 sec bins |
 |
 |
| Module-wise count rates for Quadrant C Data is divided into 100 sec bins |
 |
 |
| Module-wise count rates for Quadrant D Data is divided into 100 sec bins |
 |
 |
| Parameter | Plot |
|---|---|
| CZT HV Monitor | 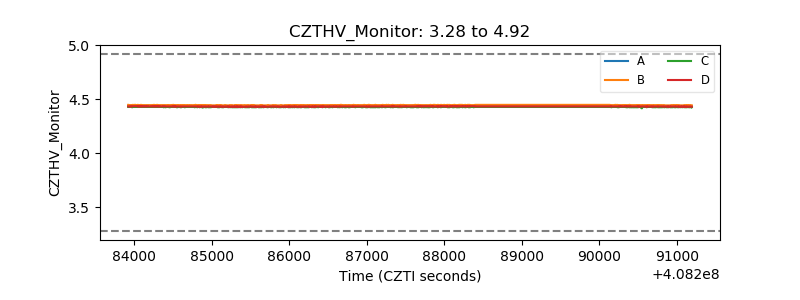 |
| D_VDD | 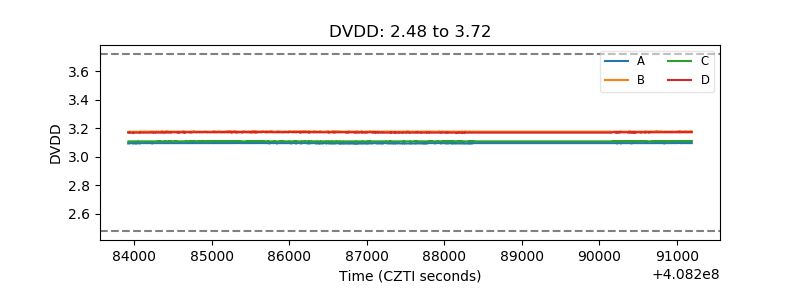 |
| Temperature 1 | 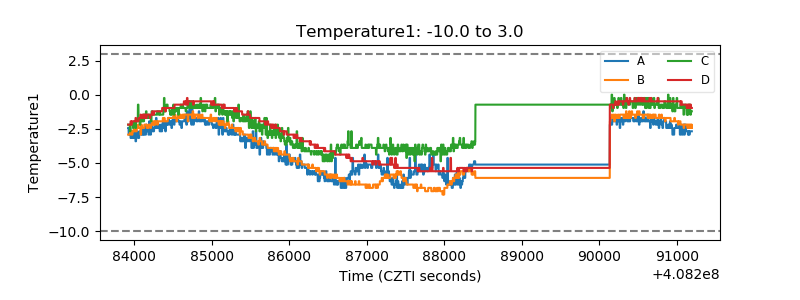 |
| Veto HV Monitor | 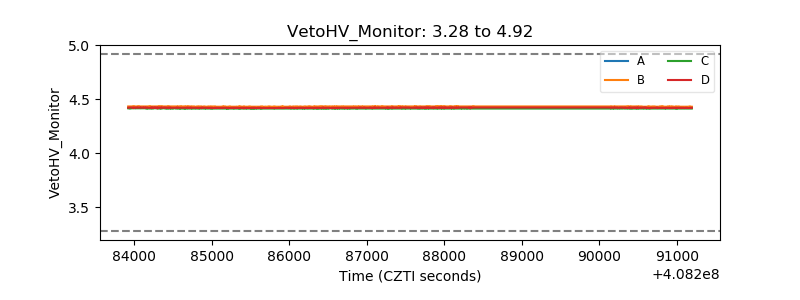 |
| Veto LLD | 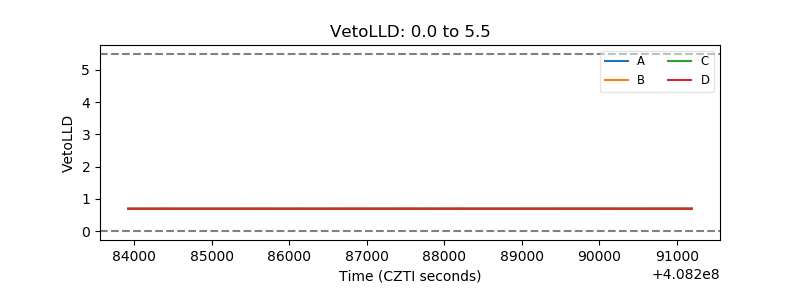 |
| Alpha Counter | 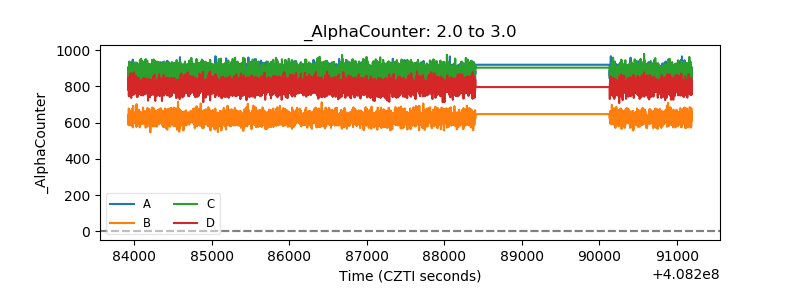 |
| _CPM_Rate | 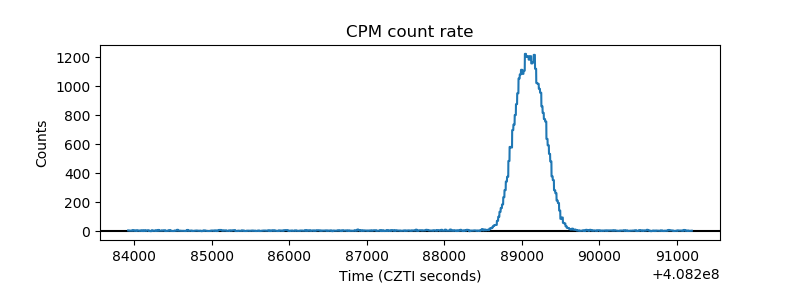 |
| CZT Counter | 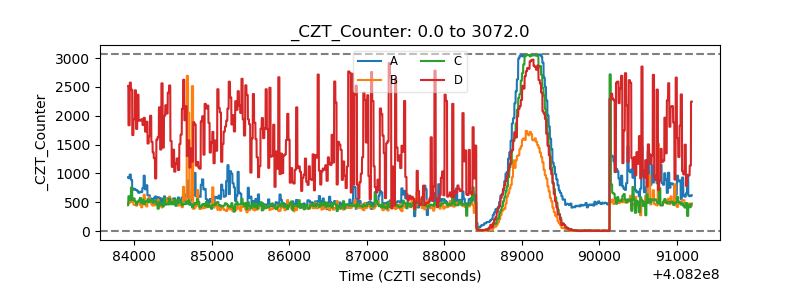 |
| +2.5 Volts monitor | 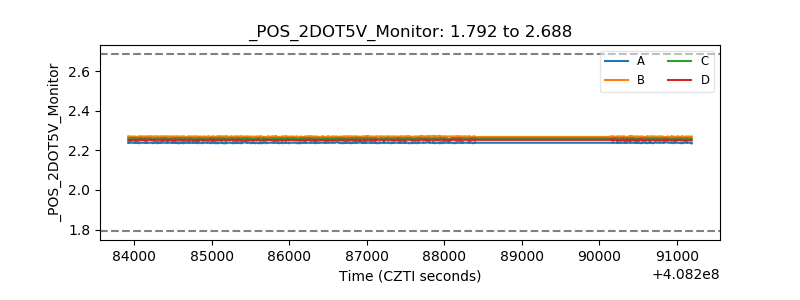 |
| +5 Volts monitor | 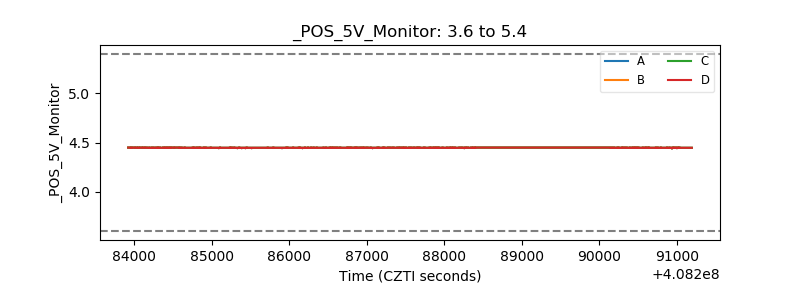 |
| _ROLL_ROT | 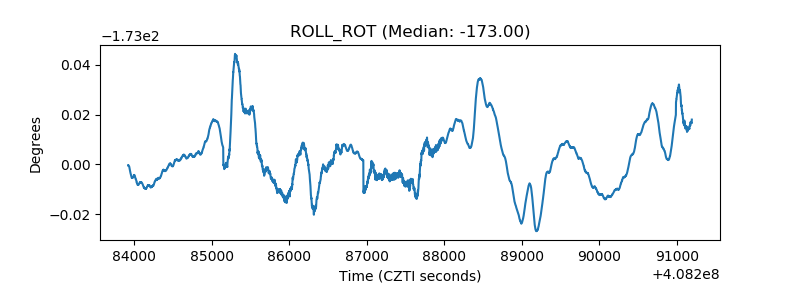 |
| _Roll_DEC | 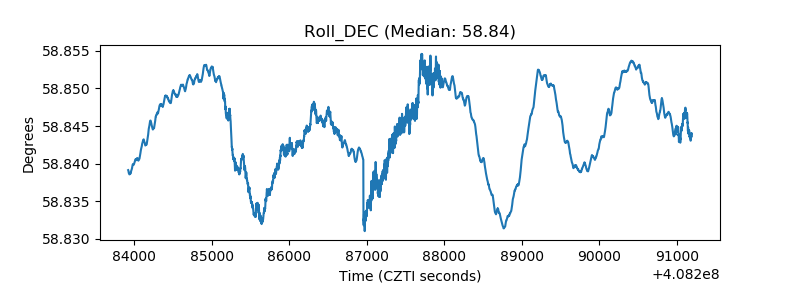 |
| _Roll_RA | 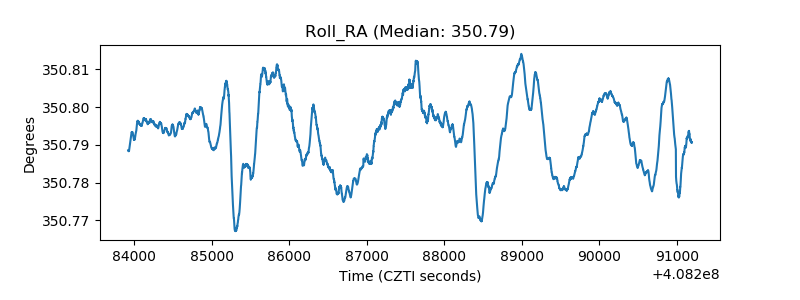 |
| Veto Counter | 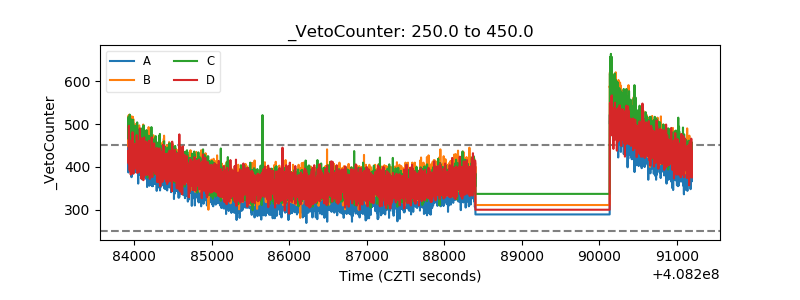 |