| Param | Original file | Final file |
|---|---|---|
| Filename | modeM0/AS1T05_064T01_9000005416_38923cztM0_level2.fits | modeM0/AS1T05_064T01_9000005416_38923cztM0_level2_quad_clean.evt |
| Size (bytes) | 405,264,960 | 93,551,040 |
| Size | 386.5 MB | 89.2 MB |
| Events in quadrant A | 3,687,490 | 648,035 |
| Events in quadrant B | 2,524,289 | 656,793 |
| Events in quadrant C | 2,555,603 | 631,227 |
| Events in quadrant D | 5,822,486 | 525,324 |
| Mode SS | |||
|---|---|---|---|
| Quadrant | BADHDUFLAG | Total packets | Discarded packets |
| A | 0 | 110 | 0 |
| B | 0 | 110 | 0 |
| C | 0 | 110 | 0 |
| D | 0 | 110 | 0 |
| Mode M9 | |||
|---|---|---|---|
| Quadrant | BADHDUFLAG | Total packets | Discarded packets |
| A | 0 | 18 | 0 |
| B | 0 | 18 | 0 |
| C | 0 | 18 | 0 |
| D | 0 | 18 | 0 |
| Mode M0 | |||
|---|---|---|---|
| Quadrant | BADHDUFLAG | Total packets | Discarded packets |
| A | 0 | 14463 | 2 |
| B | 0 | 11049 | 1 |
| C | 0 | 10793 | 1 |
| D | 0 | 20989 | 1 |
| Quadrant | Total seconds | Saturated seconds | Saturation percentage |
|---|---|---|---|
| A | 5296 | 43 | 0.811934% |
| B | 5296 | 15 | 0.283233% |
| C | 5296 | 3 | 0.056647% |
| D | 5296 | 717 | 13.538520% |
Noise dominated data is calculated using 1-second bins in cleaned event files. If a bin has >2000 counts, and if more than 50% of those come from <1% of pixels, then it is considered to be noise-dominated and hence unusable.
| Quadrant | # 1 sec bins | Bins with >0 counts | Bins with >2000 counts | High rate bins dominated by noise | Noise dominated (total time) | Noise dominated (detector-on time) | Marked lightcurve |
|---|---|---|---|---|---|---|---|
| A | 7179 | 5297 | 30 | 30 | 0.42% | 0.57% | 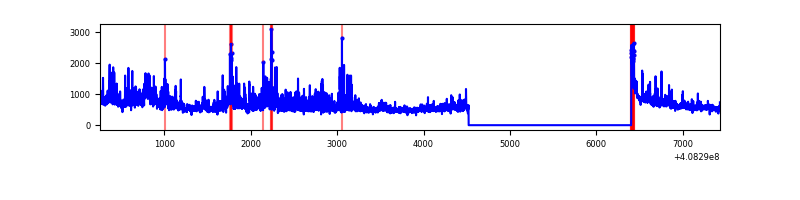 |
| B | 7179 | 5297 | 11 | 11 | 0.15% | 0.21% | 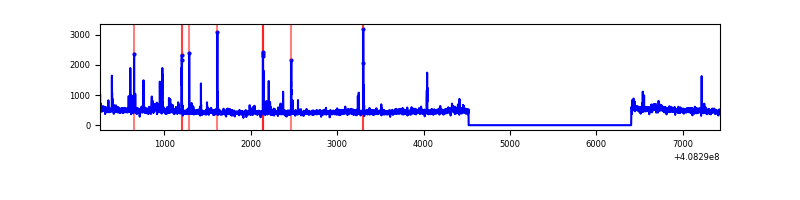 |
| C | 7179 | 5297 | 1 | 1 | 0.01% | 0.02% | 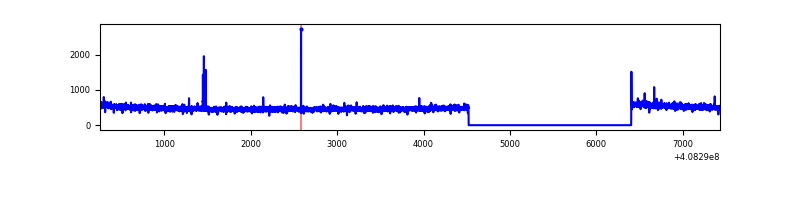 |
| D | 7179 | 5297 | 663 | 663 | 9.24% | 12.52% | 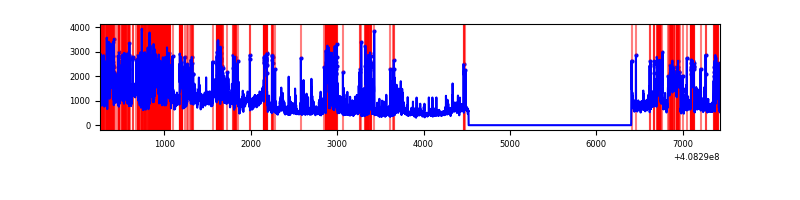 |
Top three noisy pixels from each quadrant. If the there are fewer than three noisy pixels in the level2.evt file, extra rows are filled as -1
| Pixel properties | Quadrant properties | ||||||
|---|---|---|---|---|---|---|---|
| Quadrant | DetID | PixID | Counts | Sigma | Mean | Median | Sigma |
| A | 12 | 16 | 418611 | 3454.79 | 601 | 589 | 121.0 |
| A | 10 | 83 | 393964 | 3251.09 | 601 | 589 | 121.0 |
| A | 15 | 222 | 243729 | 2009.46 | 601 | 589 | 121.0 |
| B | 5 | 200 | 80988 | 714.46 | 598 | 583 | 112.5 |
| B | 0 | 230 | 20857 | 180.15 | 598 | 583 | 112.5 |
| B | 5 | 172 | 19470 | 167.83 | 598 | 583 | 112.5 |
| C | 15 | 214 | 216072 | 1576.46 | 594 | 599 | 136.7 |
| C | 0 | 207 | 8060 | 54.59 | 594 | 599 | 136.7 |
| C | 12 | 249 | 5250 | 34.03 | 594 | 599 | 136.7 |
| D | 12 | 227 | 1136981 | 8426.28 | 560 | 545 | 134.9 |
| D | 1 | 52 | 608565 | 4508.26 | 560 | 545 | 134.9 |
| D | 2 | 250 | 520771 | 3857.29 | 560 | 545 | 134.9 |
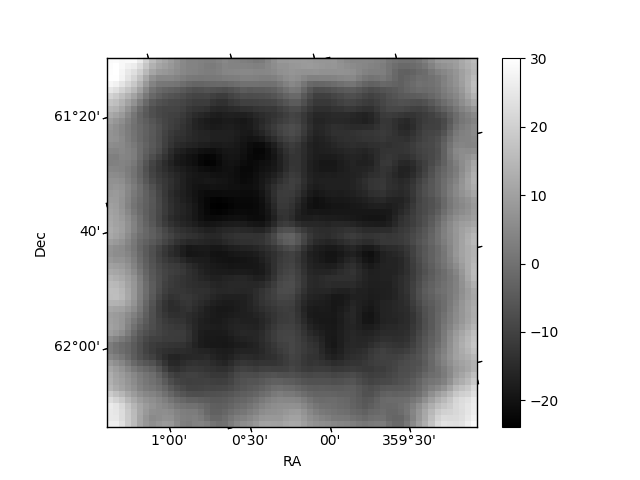
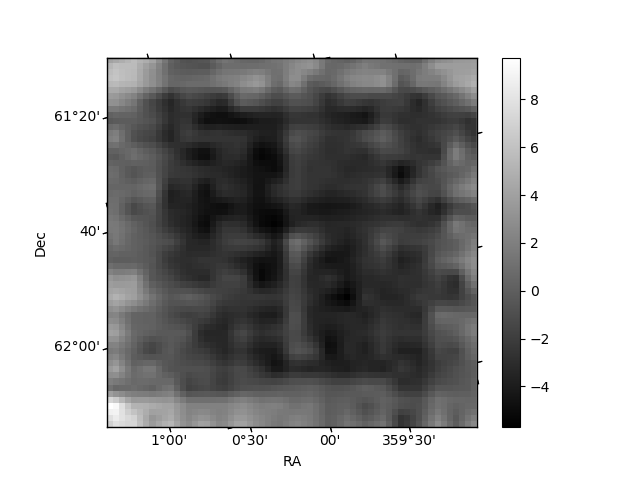
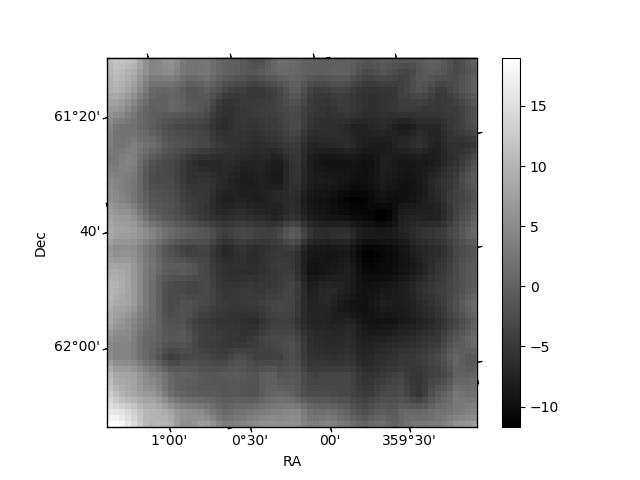
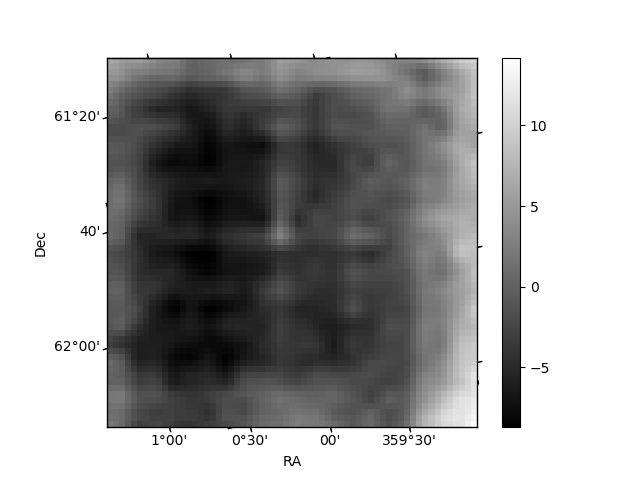
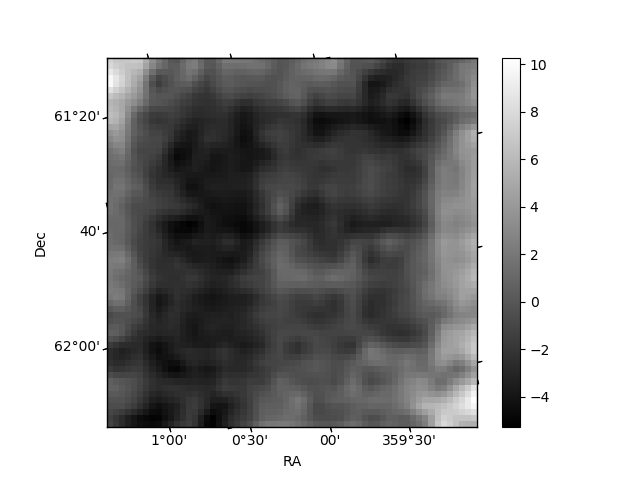
Histogram calculated using DETX and DETY for each event in the final _common_clean file
| Quadrant A | 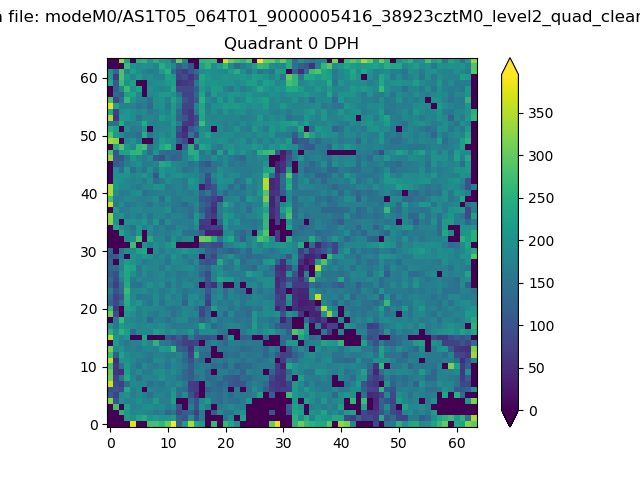 |
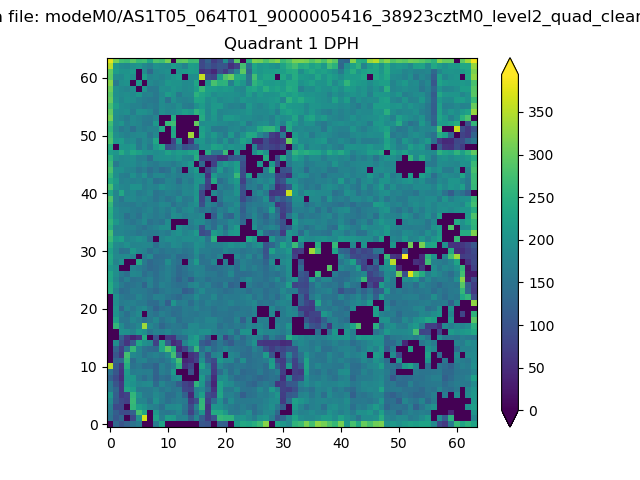 |
Quadrant B |
|---|---|---|---|
| Quadrant D | 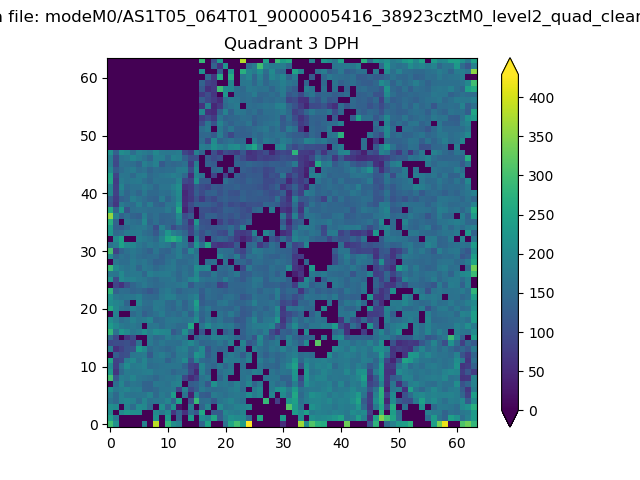 |
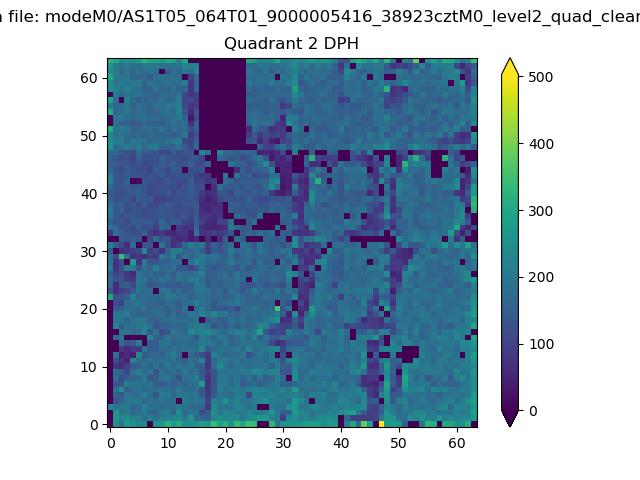 |
Quadrant C |
| Plot type | Count rate plots | Images |
|---|---|---|
| Comparison with Poisson distribution Blue bars denote a histogram of data divided into 1 sec bins. Red curve is a Poisson curve with rate = median count rate of data. |
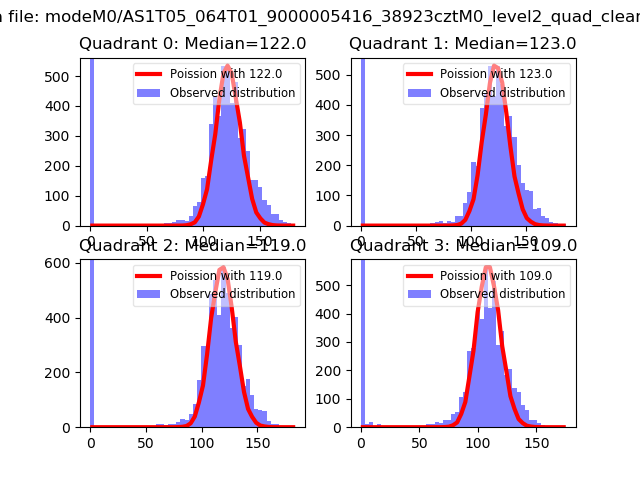 |
 |
| Quadrant-wise count rates Data is divided into 100 sec bins |
 |
|
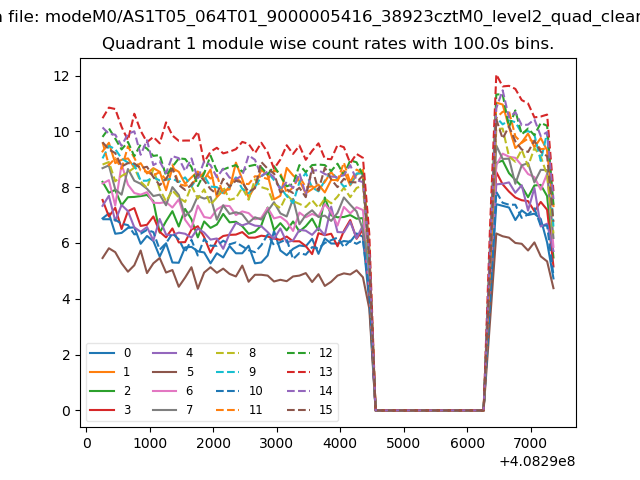
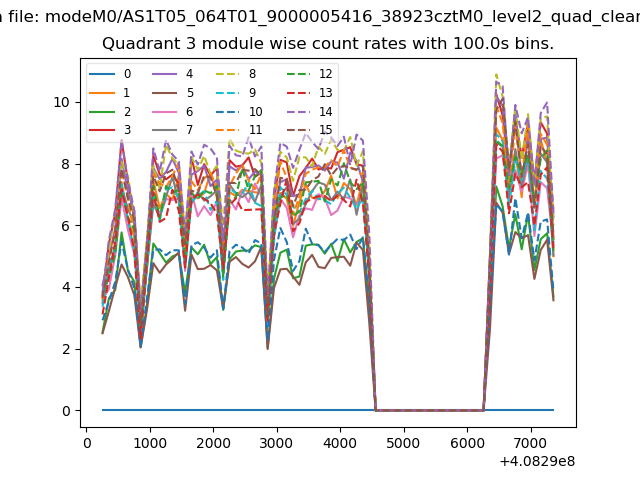
| Module-wise count rates for Quadrant A Data is divided into 100 sec bins |
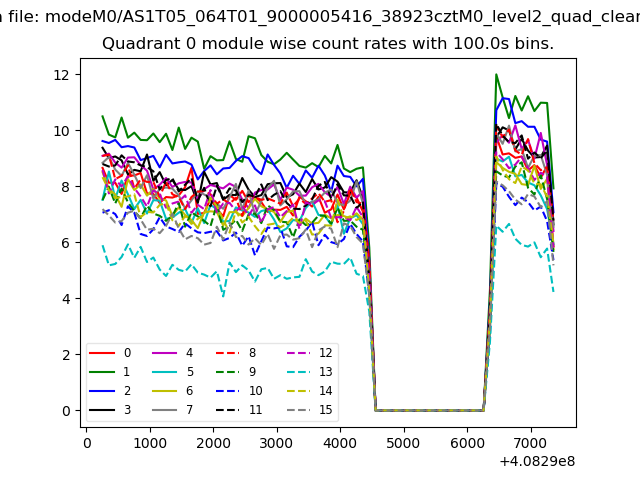 |
 |
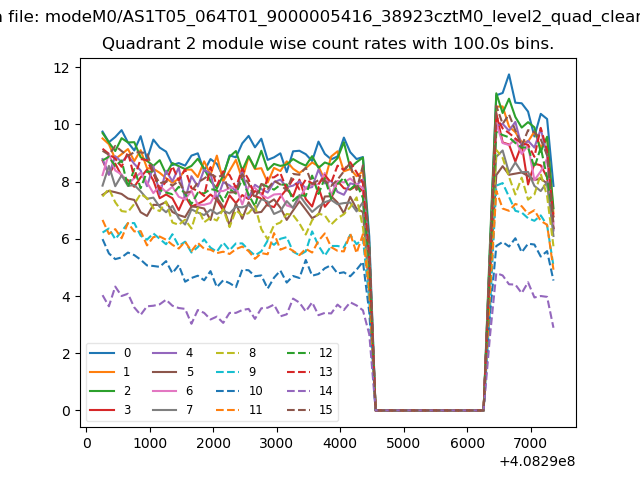
| Module-wise count rates for Quadrant B Data is divided into 100 sec bins |
 |
 |
| Module-wise count rates for Quadrant C Data is divided into 100 sec bins |
 |
 |
| Module-wise count rates for Quadrant D Data is divided into 100 sec bins |
 |
 |
| Parameter | Plot |
|---|---|
| CZT HV Monitor |  |
| D_VDD | 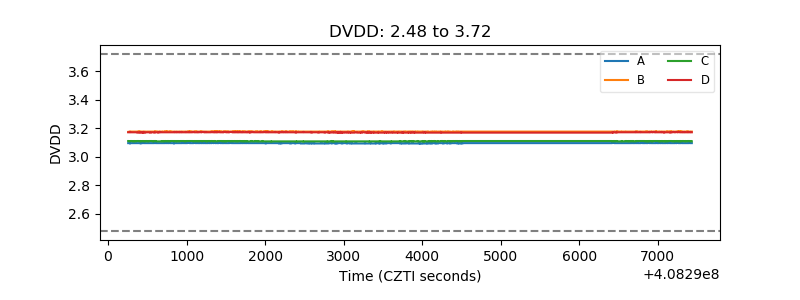 |
| Temperature 1 | 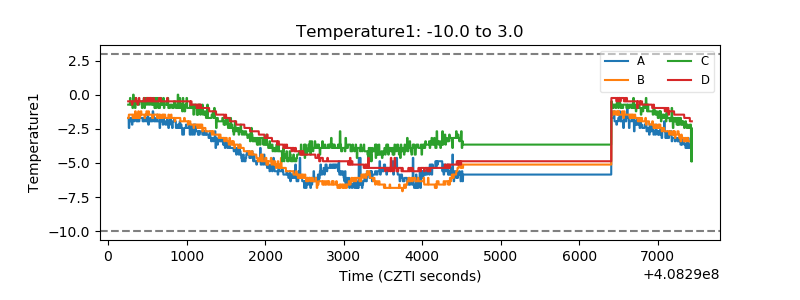 |
| Veto HV Monitor | 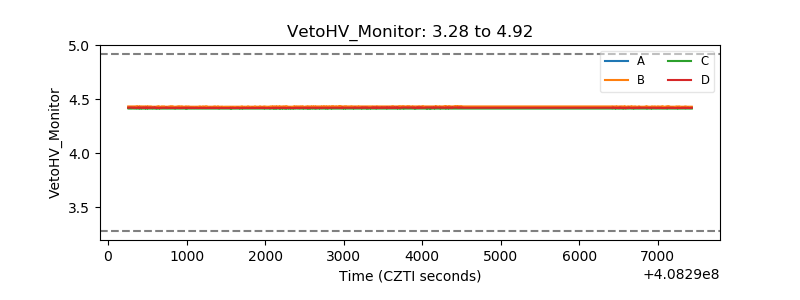 |
| Veto LLD | 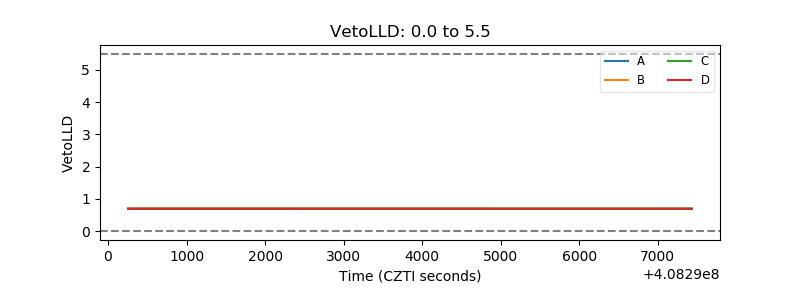 |
| Alpha Counter | 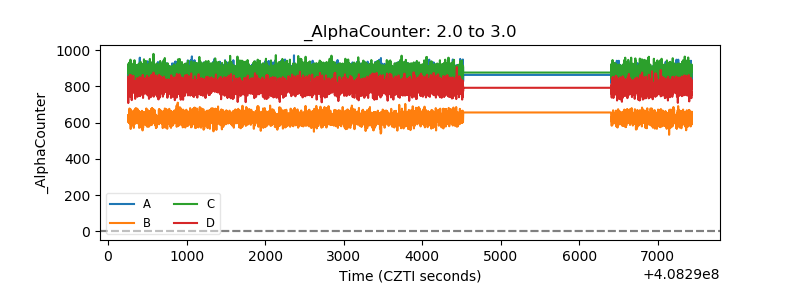 |
| _CPM_Rate | 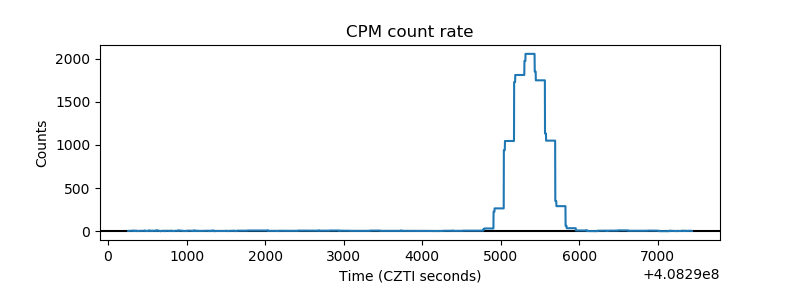 |
| CZT Counter |  |
| +2.5 Volts monitor | 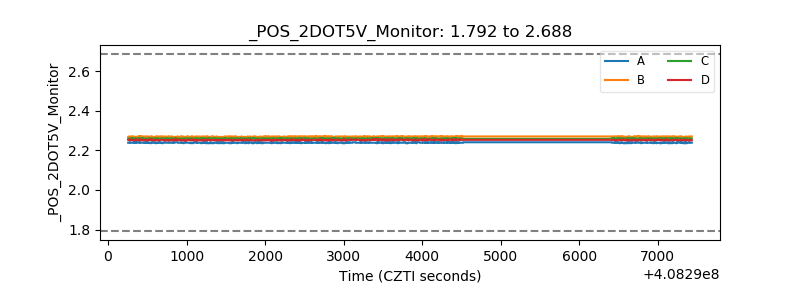 |
| +5 Volts monitor | 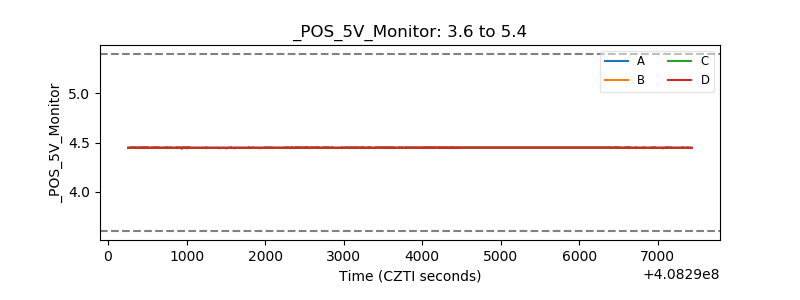 |
| _ROLL_ROT | 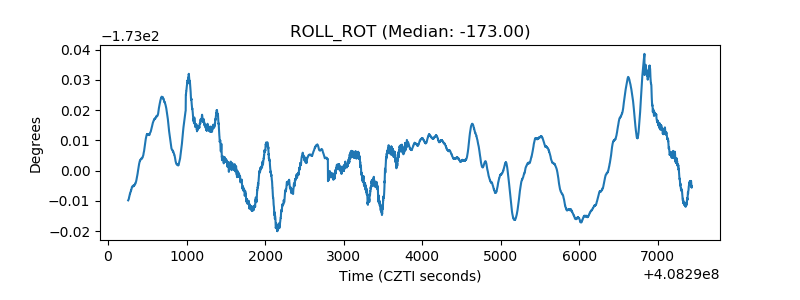 |
| _Roll_DEC |  |
| _Roll_RA | 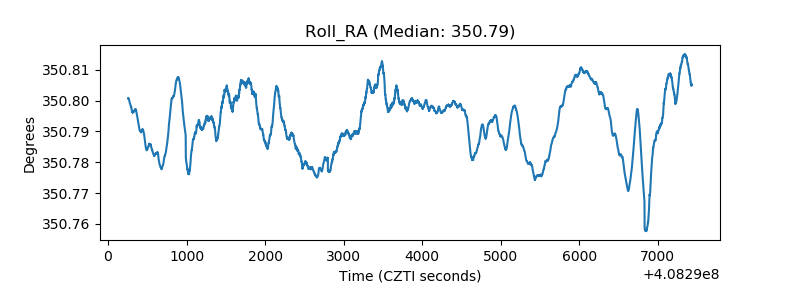 |
| Veto Counter | 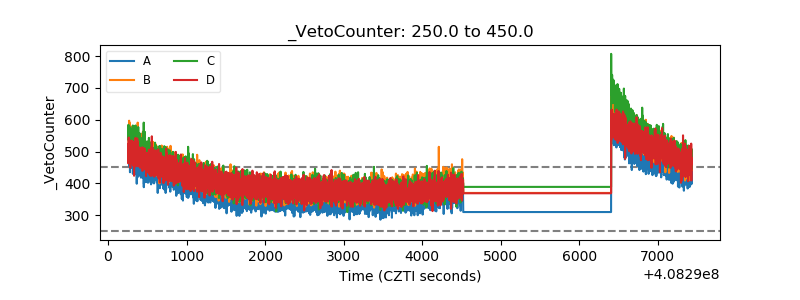 |