| Param | Original file | Final file |
|---|---|---|
| Filename | modeM0/AS1T05_064T01_9000005416_38924cztM0_level2.fits | modeM0/AS1T05_064T01_9000005416_38924cztM0_level2_quad_clean.evt |
| Size (bytes) | 348,076,800 | 96,969,600 |
| Size | 332.0 MB | 92.5 MB |
| Events in quadrant A | 3,194,267 | 661,362 |
| Events in quadrant B | 2,472,467 | 672,956 |
| Events in quadrant C | 2,593,199 | 654,032 |
| Events in quadrant D | 4,222,716 | 586,079 |
| Mode SS | |||
|---|---|---|---|
| Quadrant | BADHDUFLAG | Total packets | Discarded packets |
| A | 0 | 106 | 0 |
| B | 0 | 106 | 0 |
| C | 0 | 106 | 0 |
| D | 0 | 106 | 0 |
| Mode M9 | |||
|---|---|---|---|
| Quadrant | BADHDUFLAG | Total packets | Discarded packets |
| A | 0 | 24 | 0 |
| B | 0 | 24 | 0 |
| C | 0 | 24 | 0 |
| D | 0 | 25 | 0 |
| Mode M0 | |||
|---|---|---|---|
| Quadrant | BADHDUFLAG | Total packets | Discarded packets |
| A | 0 | 12778 | 3 |
| B | 0 | 10738 | 2 |
| C | 0 | 10702 | 2 |
| D | 0 | 16109 | 2 |
| Quadrant | Total seconds | Saturated seconds | Saturation percentage |
|---|---|---|---|
| A | 5165 | 40 | 0.774443% |
| B | 5165 | 28 | 0.542110% |
| C | 5165 | 6 | 0.116167% |
| D | 5165 | 263 | 5.091965% |
Noise dominated data is calculated using 1-second bins in cleaned event files. If a bin has >2000 counts, and if more than 50% of those come from <1% of pixels, then it is considered to be noise-dominated and hence unusable.
| Quadrant | # 1 sec bins | Bins with >0 counts | Bins with >2000 counts | High rate bins dominated by noise | Noise dominated (total time) | Noise dominated (detector-on time) | Marked lightcurve |
|---|---|---|---|---|---|---|---|
| A | 7167 | 5166 | 27 | 27 | 0.38% | 0.52% | 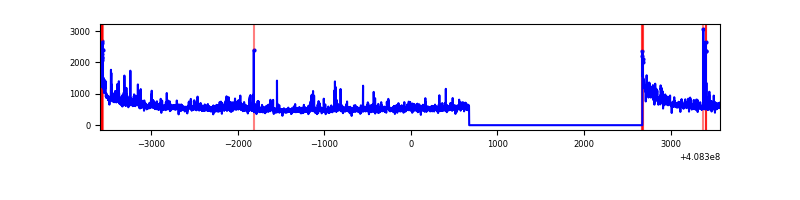 |
| B | 7167 | 5166 | 17 | 17 | 0.24% | 0.33% | 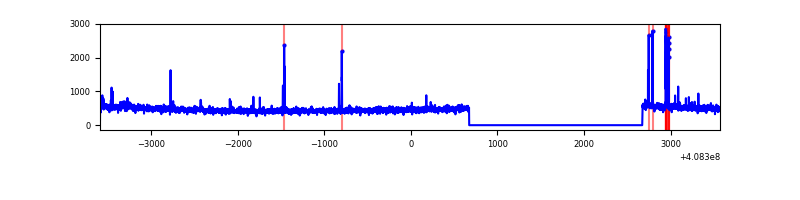 |
| C | 7167 | 5166 | 2 | 2 | 0.03% | 0.04% | 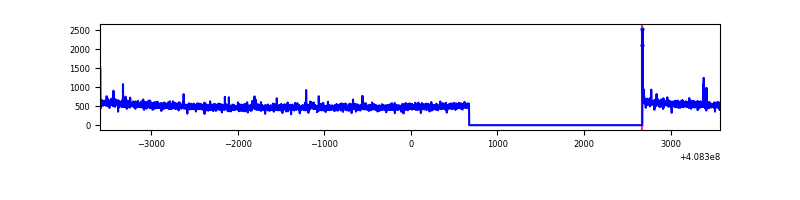 |
| D | 7167 | 5166 | 245 | 245 | 3.42% | 4.74% | 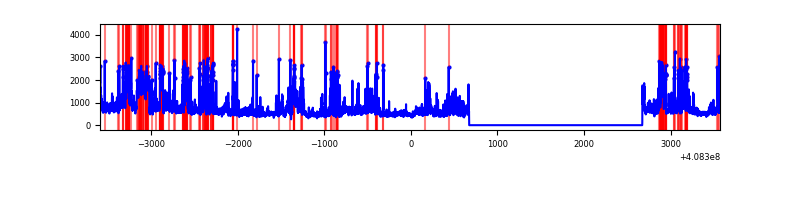 |
Top three noisy pixels from each quadrant. If the there are fewer than three noisy pixels in the level2.evt file, extra rows are filled as -1
| Pixel properties | Quadrant properties | ||||||
|---|---|---|---|---|---|---|---|
| Quadrant | DetID | PixID | Counts | Sigma | Mean | Median | Sigma |
| A | 10 | 83 | 431584 | 3579.85 | 603 | 594 | 120.4 |
| A | 15 | 222 | 199212 | 1649.74 | 603 | 594 | 120.4 |
| A | 13 | 248 | 87530 | 722.1 | 603 | 594 | 120.4 |
| B | 5 | 172 | 63864 | 567.22 | 601 | 586 | 111.6 |
| B | 5 | 200 | 21513 | 187.59 | 601 | 586 | 111.6 |
| B | 12 | 111 | 13208 | 113.14 | 601 | 586 | 111.6 |
| C | 15 | 214 | 212669 | 1530.98 | 600 | 605 | 138.5 |
| C | 3 | 233 | 18027 | 125.78 | 600 | 605 | 138.5 |
| C | 0 | 10 | 10019 | 67.96 | 600 | 605 | 138.5 |
| D | 12 | 227 | 652849 | 4589.6 | 590 | 574 | 142.1 |
| D | 2 | 249 | 358513 | 2518.56 | 590 | 574 | 142.1 |
| D | 12 | 235 | 207577 | 1456.53 | 590 | 574 | 142.1 |
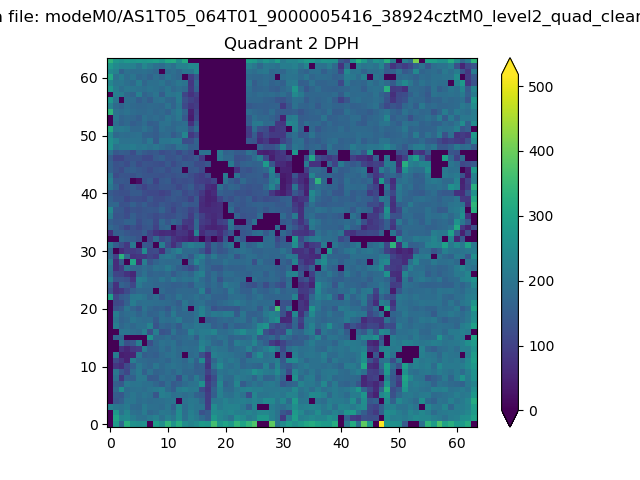
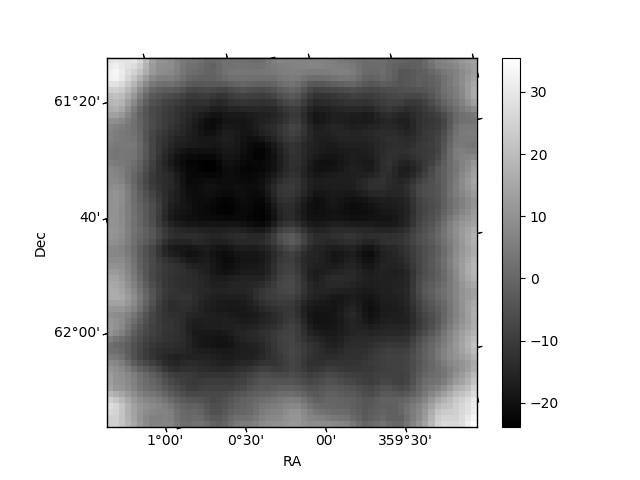
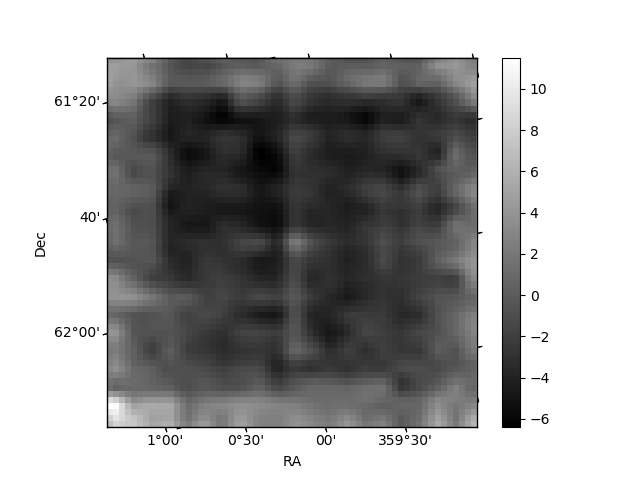
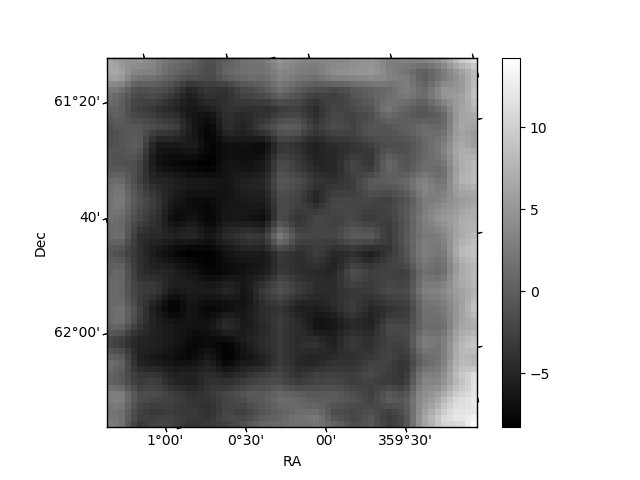
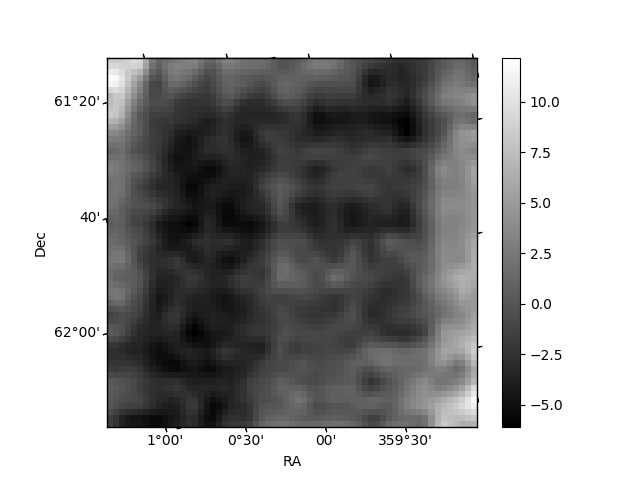
Histogram calculated using DETX and DETY for each event in the final _common_clean file
| Quadrant A | 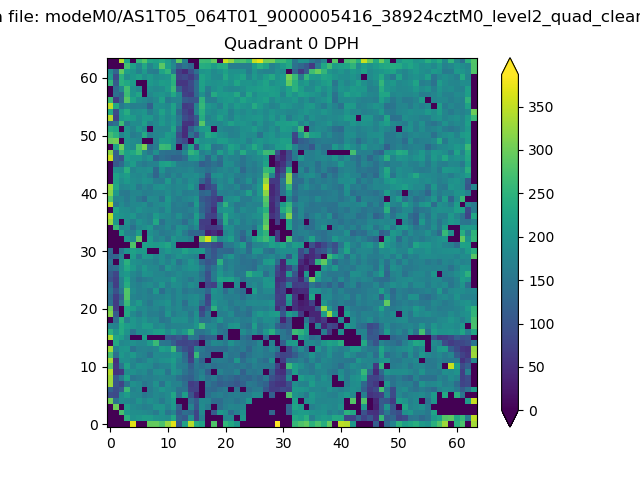 |
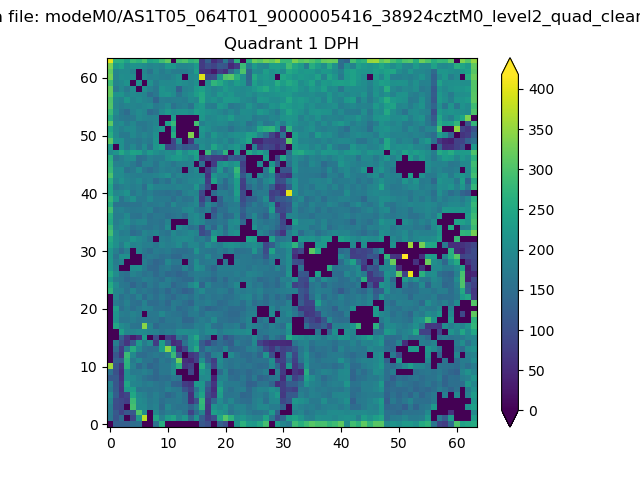 |
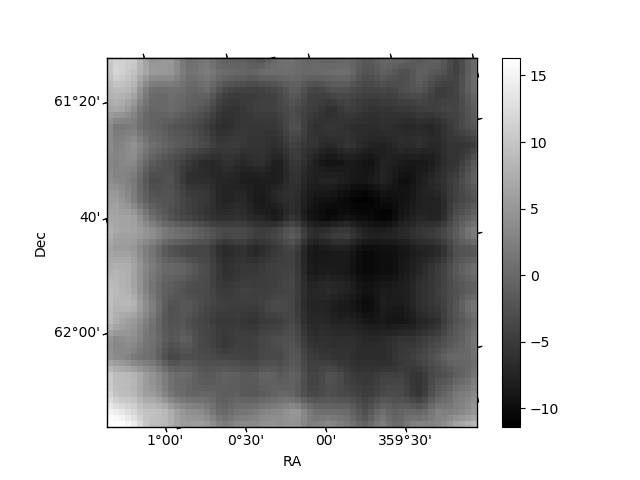
Quadrant B |
|---|---|---|---|
| Quadrant D | 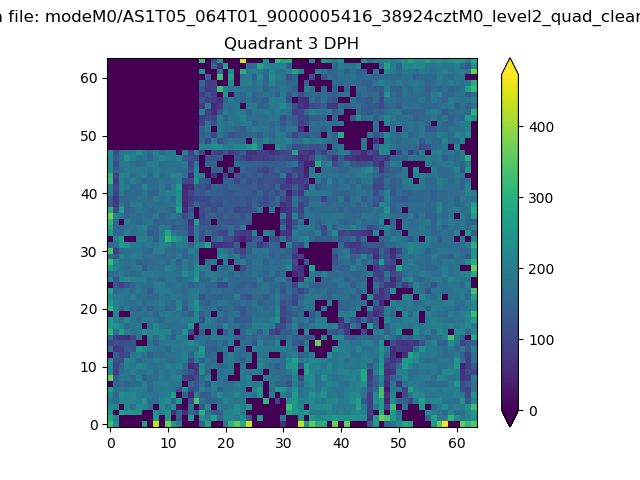 |
 |
Quadrant C |
| Plot type | Count rate plots | Images |
|---|---|---|
| Comparison with Poisson distribution Blue bars denote a histogram of data divided into 1 sec bins. Red curve is a Poisson curve with rate = median count rate of data. |
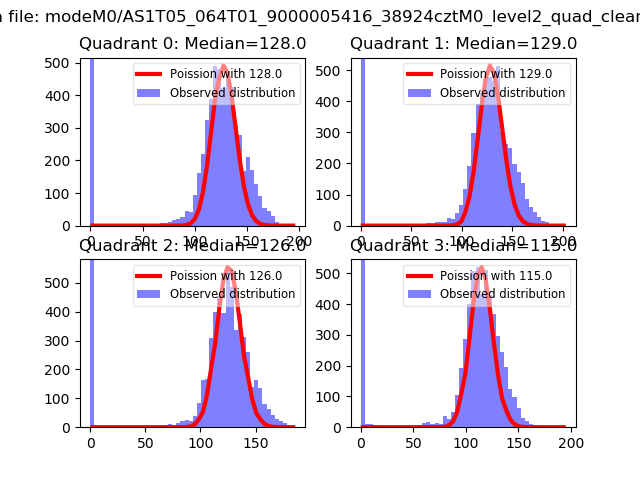 |
 |
| Quadrant-wise count rates Data is divided into 100 sec bins |
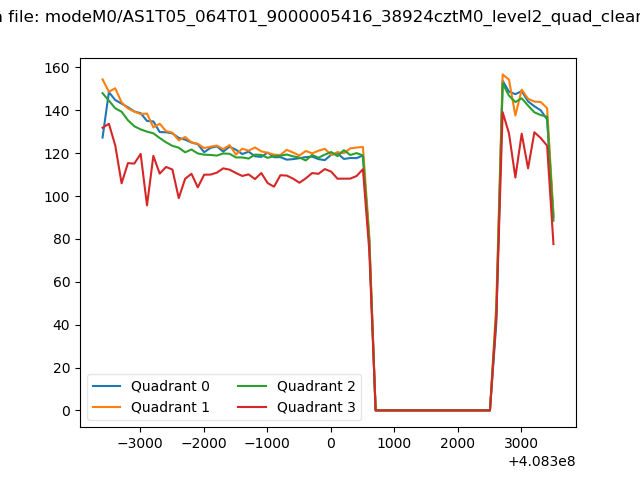 |
|
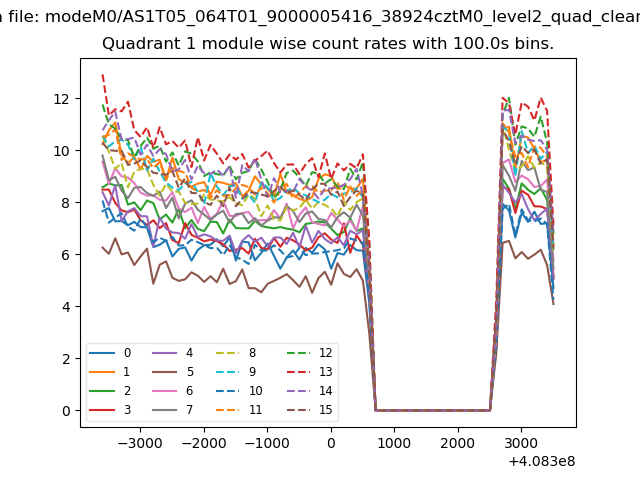
| Module-wise count rates for Quadrant A Data is divided into 100 sec bins |
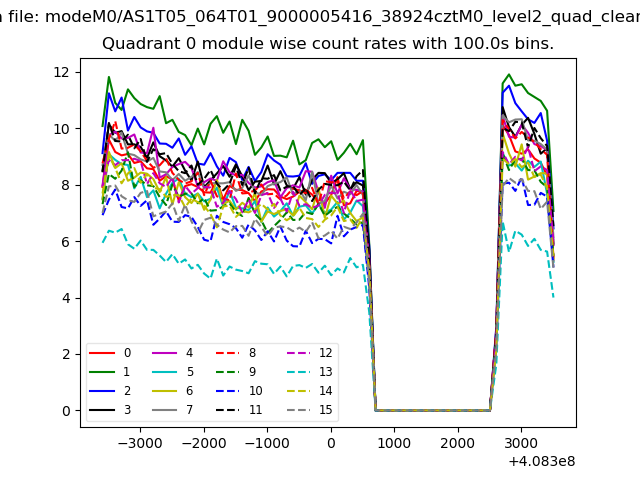 |
 |
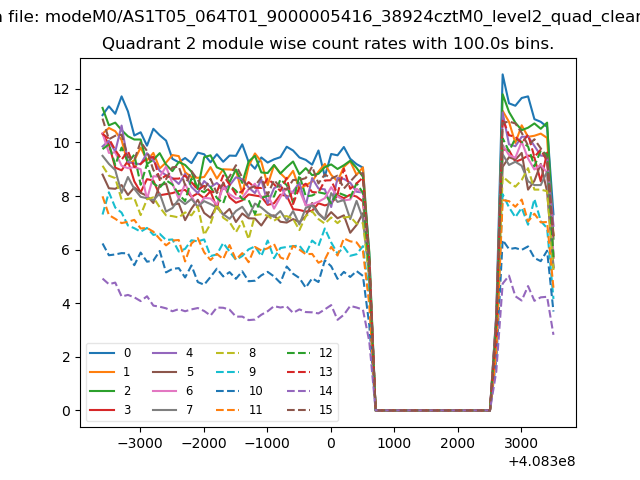
| Module-wise count rates for Quadrant B Data is divided into 100 sec bins |
 |
 |
| Module-wise count rates for Quadrant C Data is divided into 100 sec bins |
 |
 |
| Module-wise count rates for Quadrant D Data is divided into 100 sec bins |
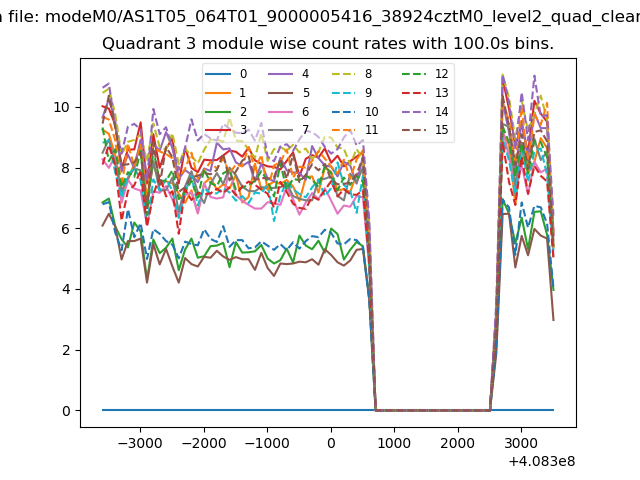 |
 |
| Parameter | Plot |
|---|---|
| CZT HV Monitor |  |
| D_VDD | 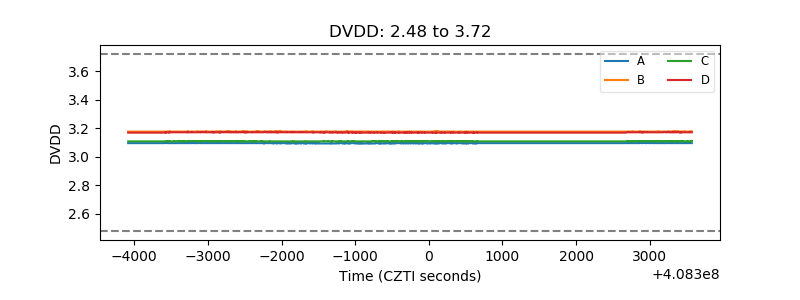 |
| Temperature 1 | 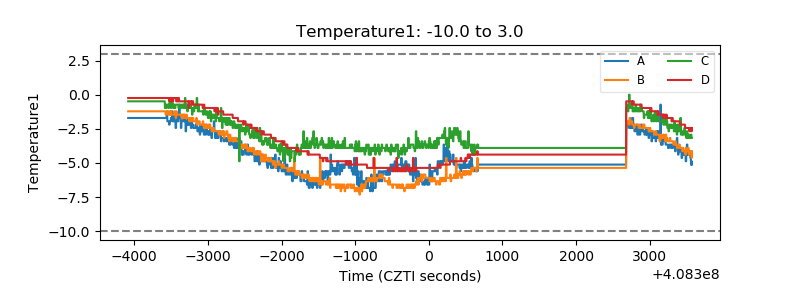 |
| Veto HV Monitor | 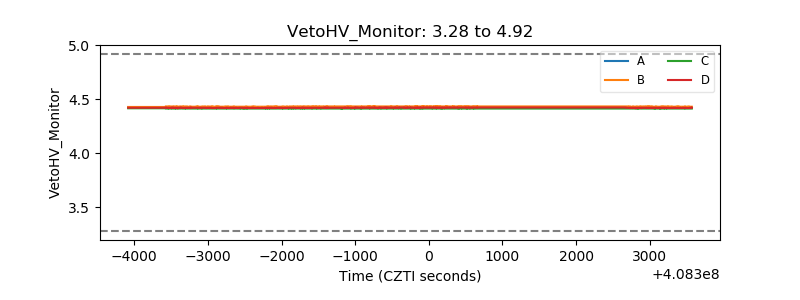 |
| Veto LLD | 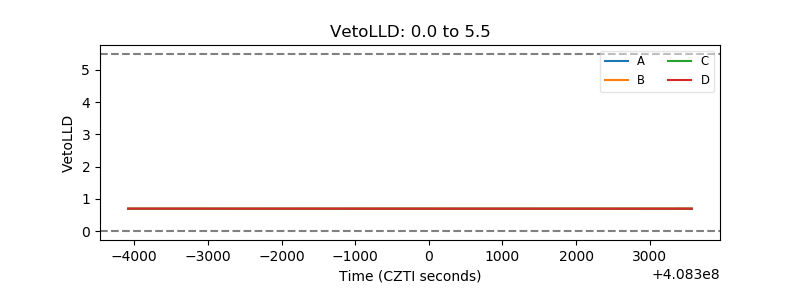 |
| Alpha Counter | 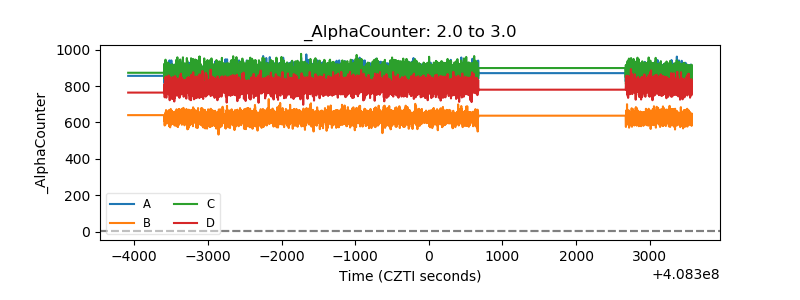 |
| _CPM_Rate | 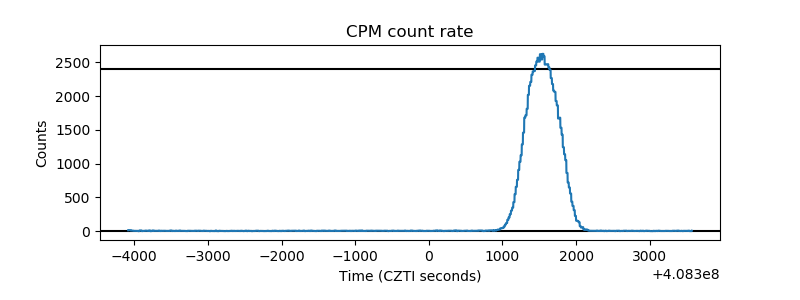 |
| CZT Counter | 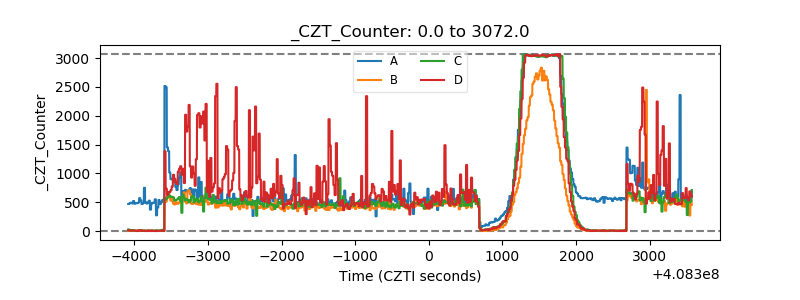 |
| +2.5 Volts monitor | 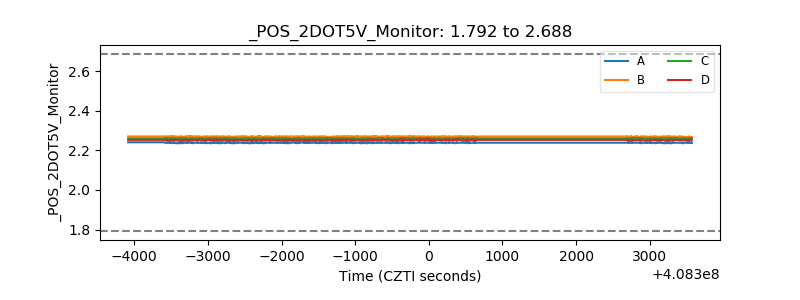 |
| +5 Volts monitor | 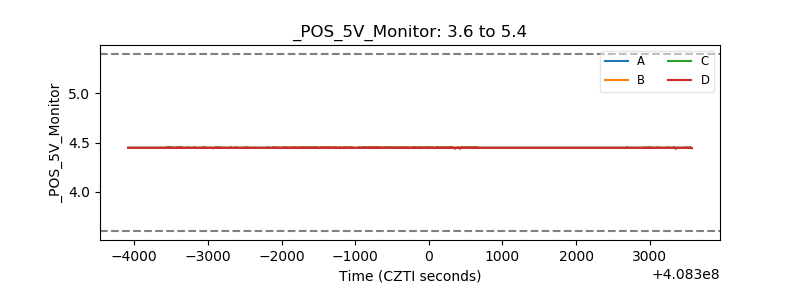 |
| _ROLL_ROT | 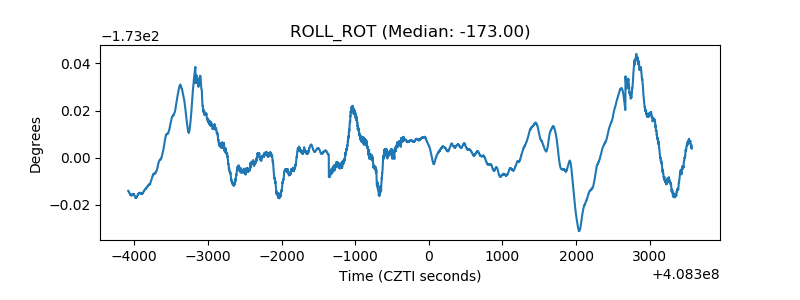 |
| _Roll_DEC | 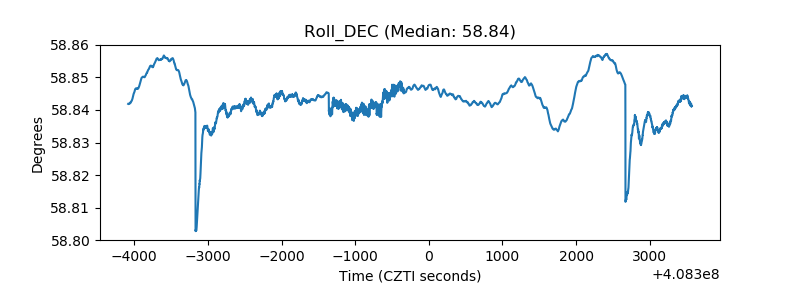 |
| _Roll_RA | 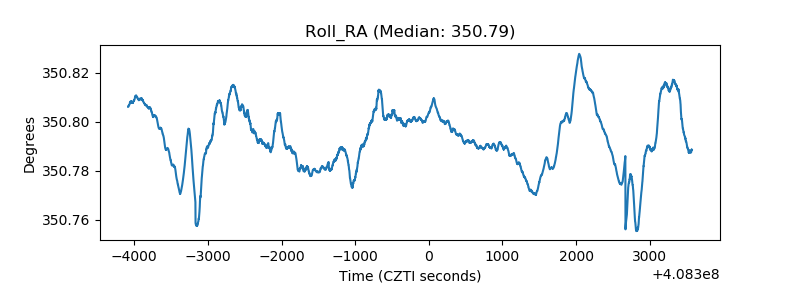 |
| Veto Counter | 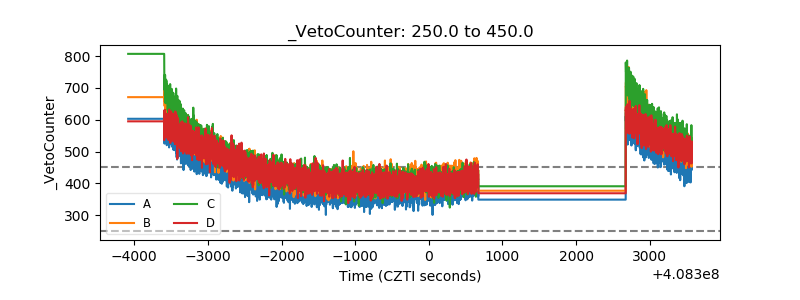 |