| Param | Original file | Final file |
|---|---|---|
| Filename | modeM0/AS1T05_064T01_9000005416_38926cztM0_level2.fits | modeM0/AS1T05_064T01_9000005416_38926cztM0_level2_quad_clean.evt |
| Size (bytes) | 338,253,120 | 88,850,880 |
| Size | 322.6 MB | 84.7 MB |
| Events in quadrant A | 4,168,371 | 550,905 |
| Events in quadrant B | 2,351,883 | 632,193 |
| Events in quadrant C | 2,470,213 | 612,862 |
| Events in quadrant D | 3,149,949 | 552,420 |
| Mode SS | |||
|---|---|---|---|
| Quadrant | BADHDUFLAG | Total packets | Discarded packets |
| A | 0 | 98 | 0 |
| B | 0 | 98 | 0 |
| C | 0 | 98 | 0 |
| D | 0 | 98 | 0 |
| Mode M9 | |||
|---|---|---|---|
| Quadrant | BADHDUFLAG | Total packets | Discarded packets |
| A | 0 | 27 | 0 |
| B | 0 | 27 | 0 |
| C | 0 | 27 | 0 |
| D | 0 | 28 | 0 |
| Mode M0 | |||
|---|---|---|---|
| Quadrant | BADHDUFLAG | Total packets | Discarded packets |
| A | 0 | 15477 | 2 |
| B | 0 | 10130 | 1 |
| C | 0 | 10184 | 1 |
| D | 0 | 12510 | 1 |
| Quadrant | Total seconds | Saturated seconds | Saturation percentage |
|---|---|---|---|
| A | 4884 | 562 | 11.506962% |
| B | 4884 | 24 | 0.491400% |
| C | 4884 | 18 | 0.368550% |
| D | 4884 | 128 | 2.620803% |
Noise dominated data is calculated using 1-second bins in cleaned event files. If a bin has >2000 counts, and if more than 50% of those come from <1% of pixels, then it is considered to be noise-dominated and hence unusable.
| Quadrant | # 1 sec bins | Bins with >0 counts | Bins with >2000 counts | High rate bins dominated by noise | Noise dominated (total time) | Noise dominated (detector-on time) | Marked lightcurve |
|---|---|---|---|---|---|---|---|
| A | 7037 | 4885 | 619 | 619 | 8.80% | 12.67% | 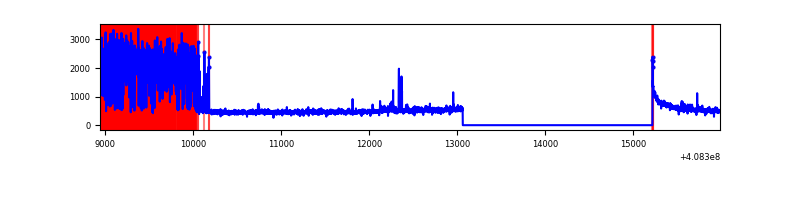 |
| B | 7037 | 4885 | 11 | 11 | 0.16% | 0.23% | 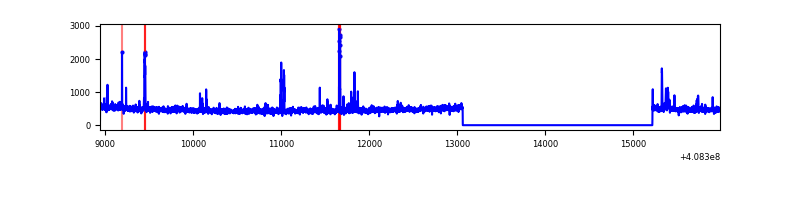 |
| C | 7037 | 4885 | 14 | 14 | 0.20% | 0.29% | 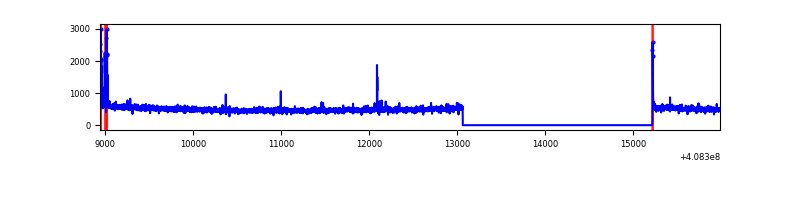 |
| D | 7037 | 4885 | 116 | 116 | 1.65% | 2.37% | 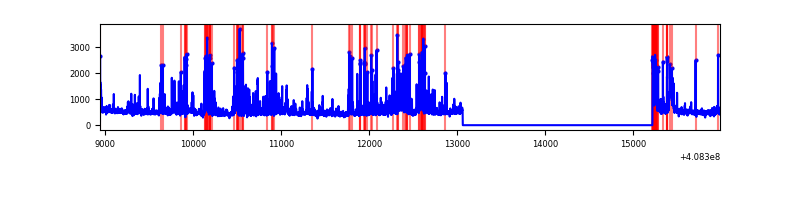 |
Top three noisy pixels from each quadrant. If the there are fewer than three noisy pixels in the level2.evt file, extra rows are filled as -1
| Pixel properties | Quadrant properties | ||||||
|---|---|---|---|---|---|---|---|
| Quadrant | DetID | PixID | Counts | Sigma | Mean | Median | Sigma |
| A | 6 | 10 | 1617020 | 14871.6 | 541 | 530 | 108.7 |
| A | 10 | 83 | 379998 | 3491.08 | 541 | 530 | 108.7 |
| A | 13 | 248 | 35392 | 320.73 | 541 | 530 | 108.7 |
| B | 5 | 172 | 36672 | 340.84 | 561 | 548 | 106.0 |
| B | 0 | 190 | 35407 | 328.9 | 561 | 548 | 106.0 |
| B | 5 | 200 | 26650 | 246.28 | 561 | 548 | 106.0 |
| C | 15 | 214 | 200958 | 1557.47 | 560 | 566 | 128.7 |
| C | 12 | 249 | 61107 | 470.53 | 560 | 566 | 128.7 |
| C | 0 | 10 | 20578 | 155.54 | 560 | 566 | 128.7 |
| D | 2 | 250 | 546991 | 4191.28 | 546 | 531 | 130.4 |
| D | 12 | 6 | 100053 | 763.32 | 546 | 531 | 130.4 |
| D | 2 | 153 | 89553 | 682.79 | 546 | 531 | 130.4 |
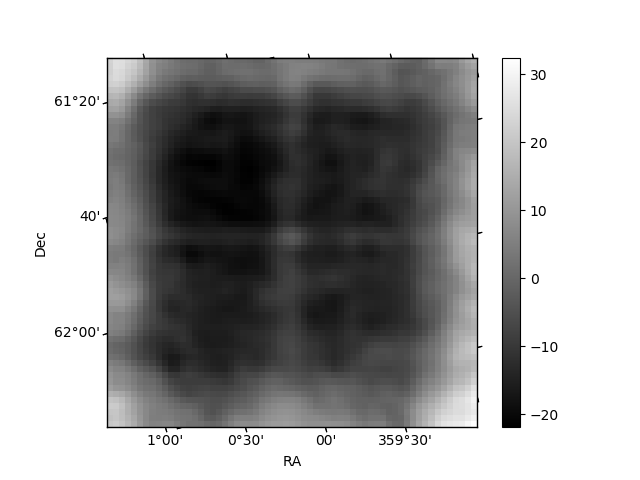
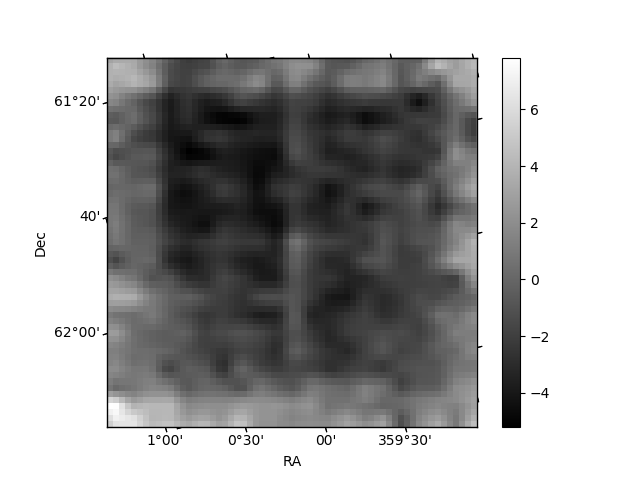
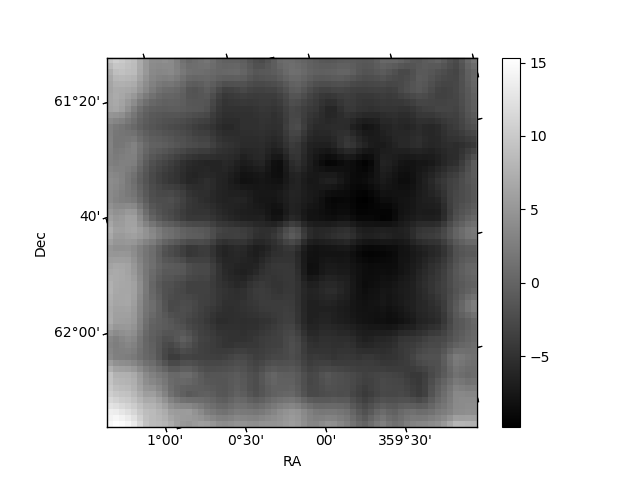
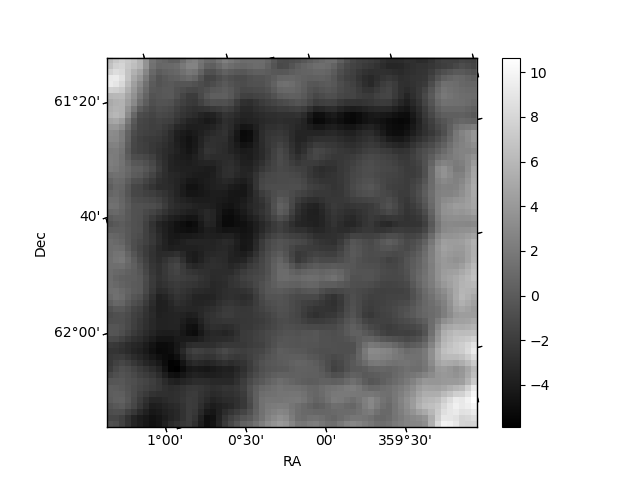
Histogram calculated using DETX and DETY for each event in the final _common_clean file
| Quadrant A | 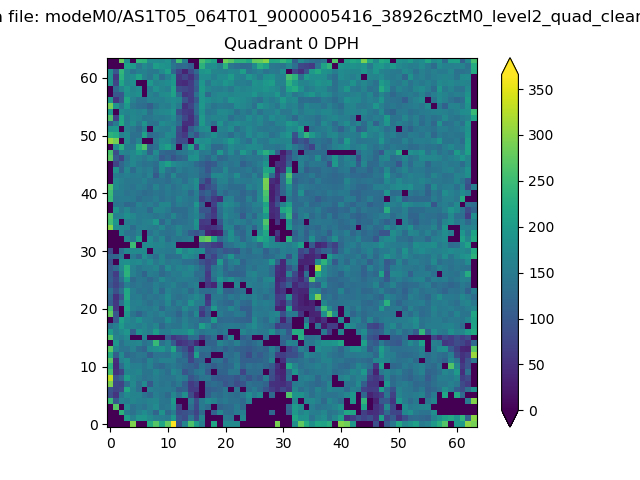 |
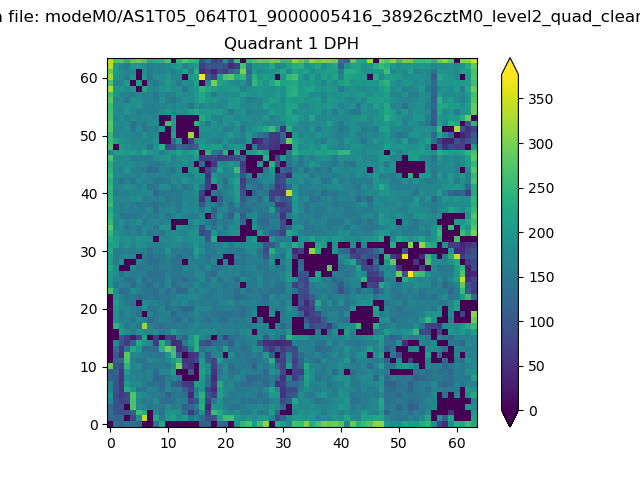 |
Quadrant B |
|---|---|---|---|
| Quadrant D |  |
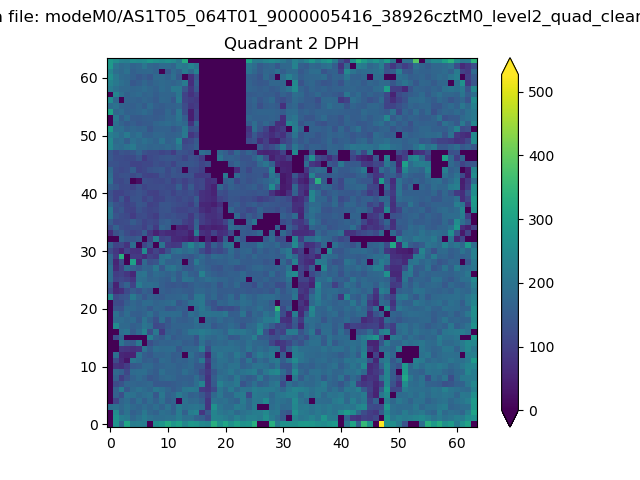 |
Quadrant C |
| Plot type | Count rate plots | Images |
|---|---|---|
| Comparison with Poisson distribution Blue bars denote a histogram of data divided into 1 sec bins. Red curve is a Poisson curve with rate = median count rate of data. |
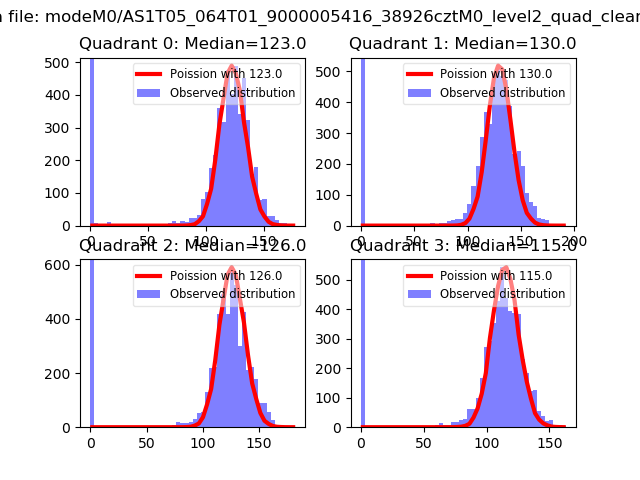 |
 |
| Quadrant-wise count rates Data is divided into 100 sec bins |
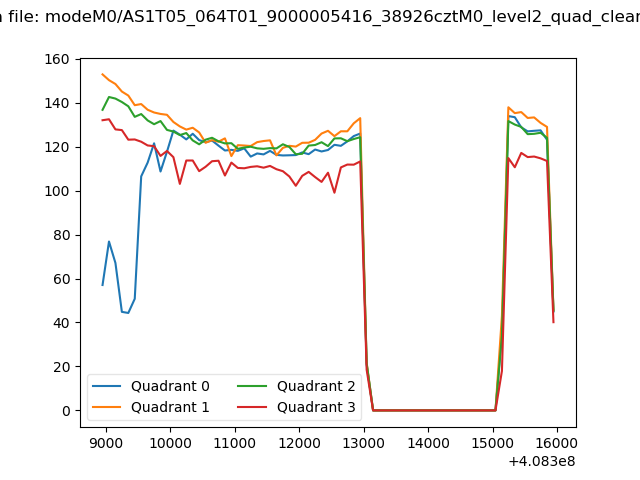 |
|
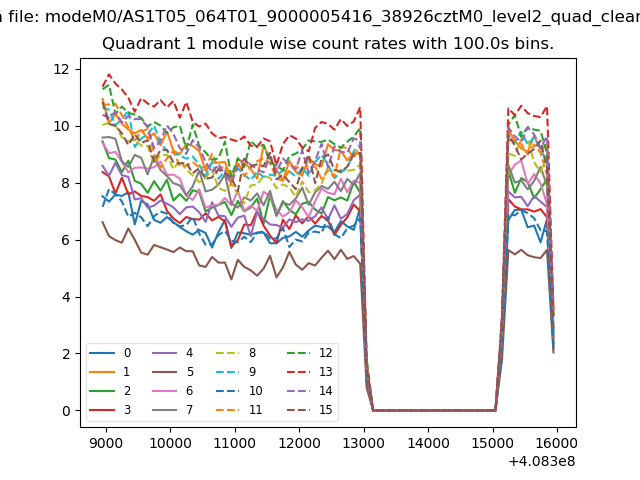
| Module-wise count rates for Quadrant A Data is divided into 100 sec bins |
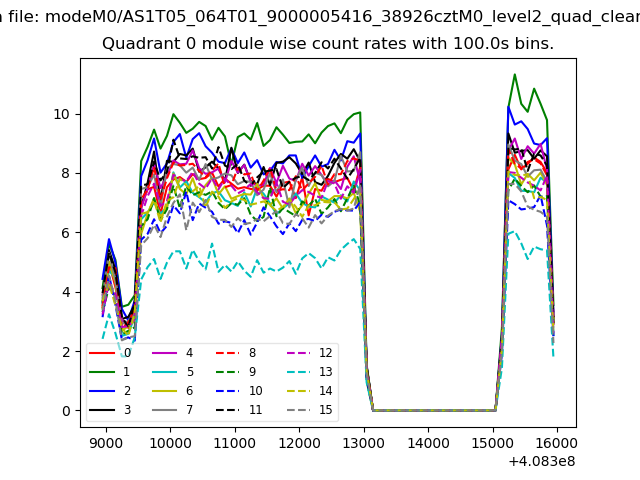 |
 |
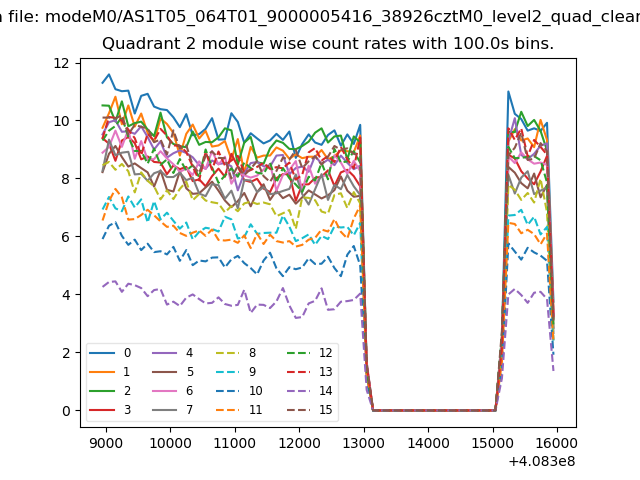
| Module-wise count rates for Quadrant B Data is divided into 100 sec bins |
 |
 |
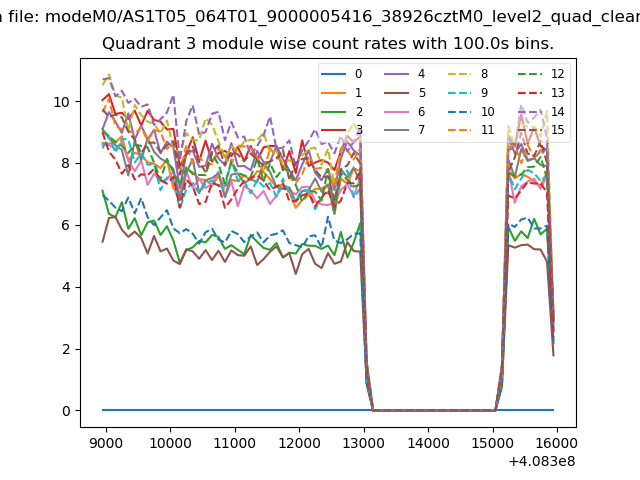
| Module-wise count rates for Quadrant C Data is divided into 100 sec bins |
 |
 |
| Module-wise count rates for Quadrant D Data is divided into 100 sec bins |
 |
 |
| Parameter | Plot |
|---|---|
| CZT HV Monitor |  |
| D_VDD | 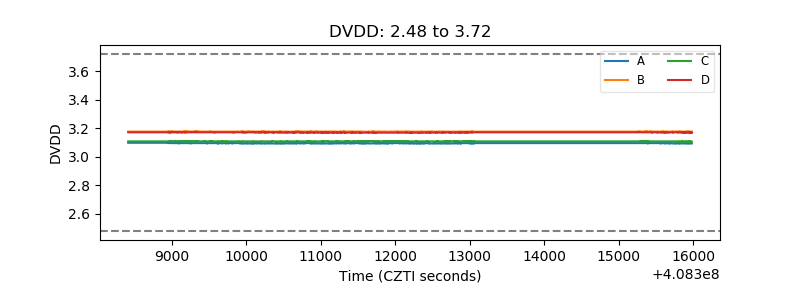 |
| Temperature 1 | 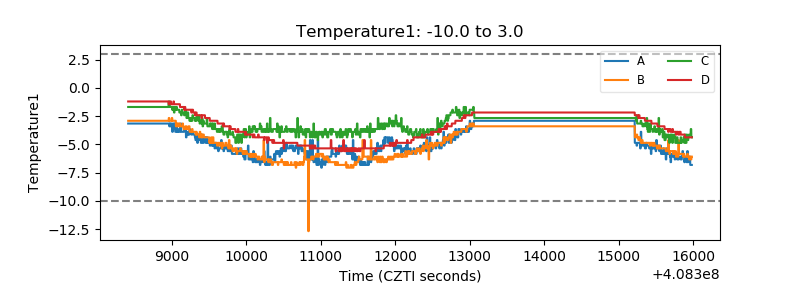 |
| Veto HV Monitor | 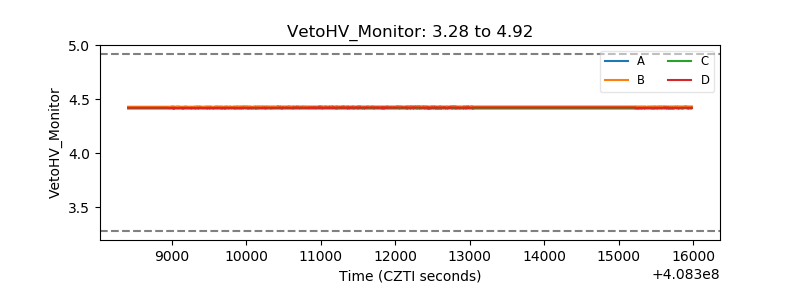 |
| Veto LLD | 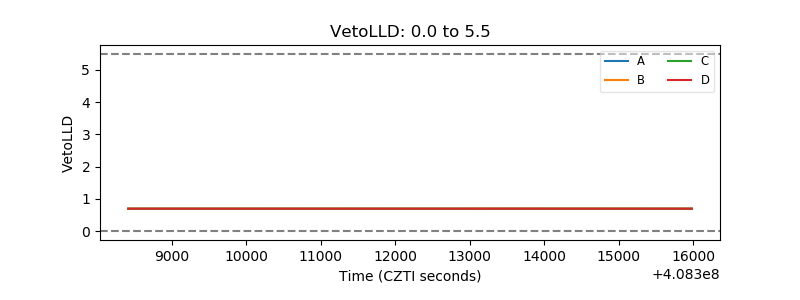 |
| Alpha Counter | 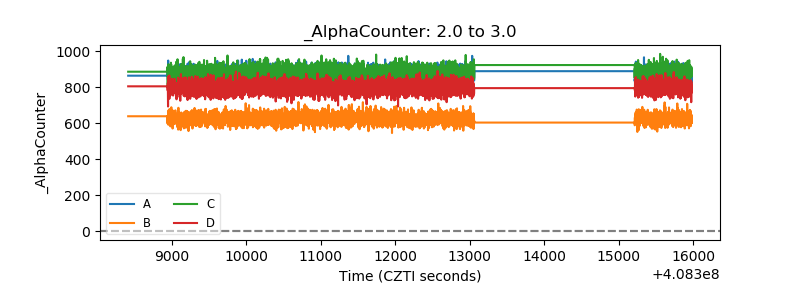 |
| _CPM_Rate | 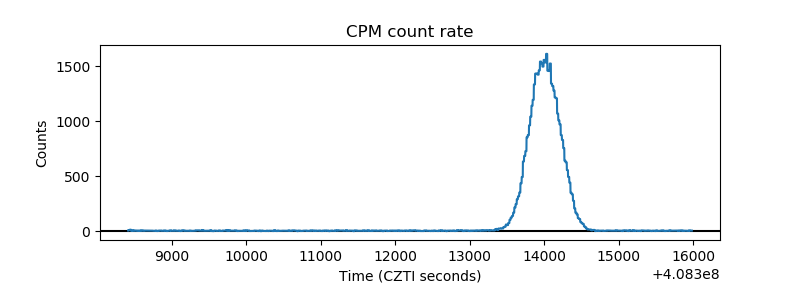 |
| CZT Counter | 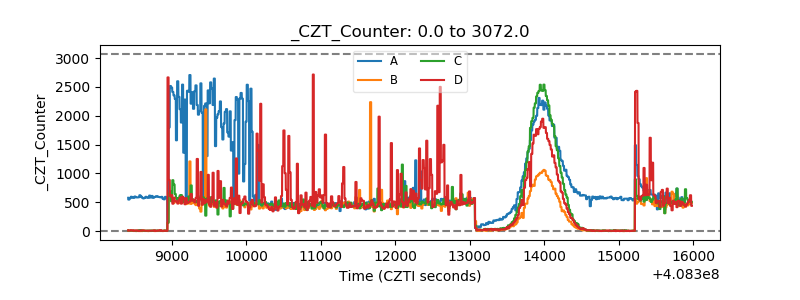 |
| +2.5 Volts monitor | 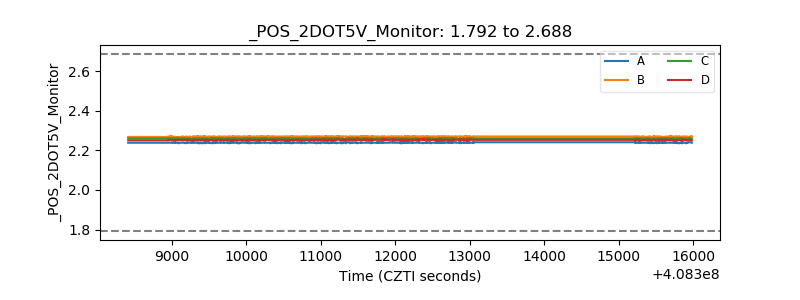 |
| +5 Volts monitor | 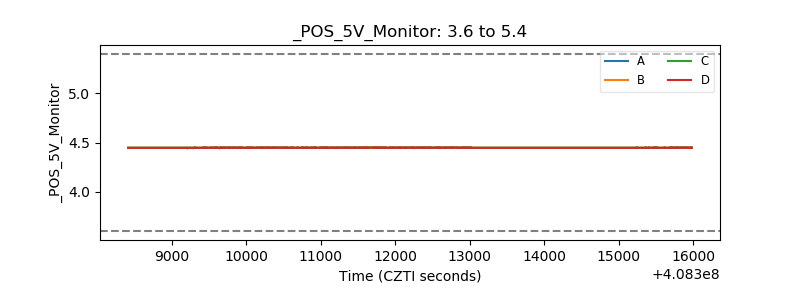 |
| _ROLL_ROT | 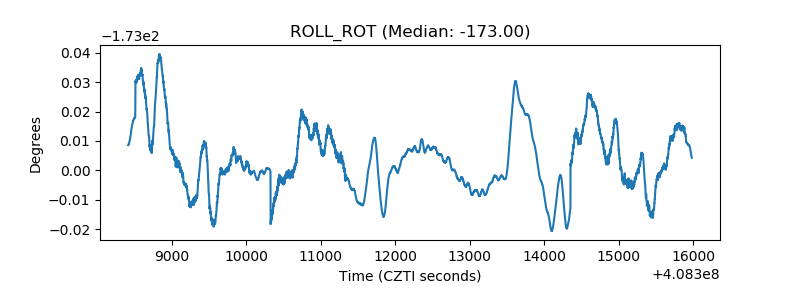 |
| _Roll_DEC | 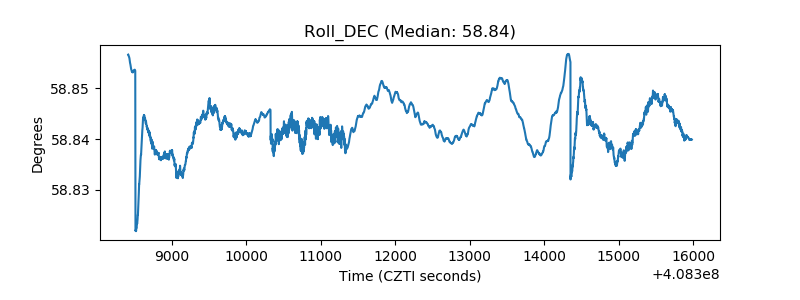 |
| _Roll_RA | 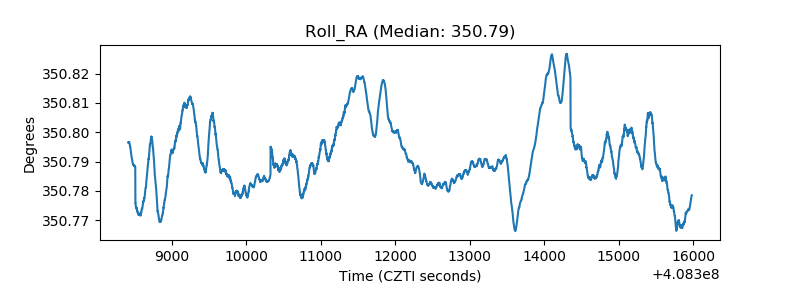 |
| Veto Counter | 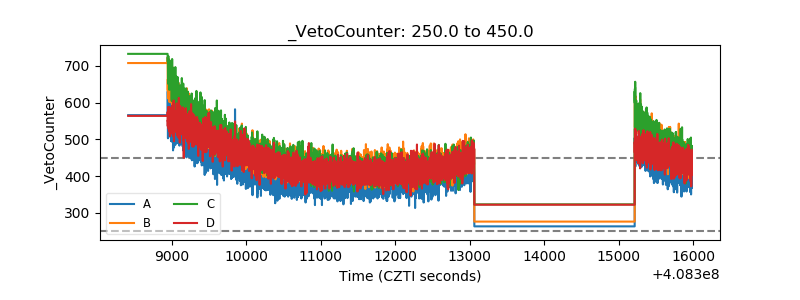 |