| Param | Original file | Final file |
|---|---|---|
| Filename | modeM0/AS1T05_064T01_9000005416_38927cztM0_level2.fits | modeM0/AS1T05_064T01_9000005416_38927cztM0_level2_quad_clean.evt |
| Size (bytes) | 313,289,280 | 87,203,520 |
| Size | 298.8 MB | 83.2 MB |
| Events in quadrant A | 2,617,851 | 586,696 |
| Events in quadrant B | 2,393,567 | 608,378 |
| Events in quadrant C | 2,554,148 | 584,633 |
| Events in quadrant D | 3,644,410 | 513,314 |
| Mode SS | |||
|---|---|---|---|
| Quadrant | BADHDUFLAG | Total packets | Discarded packets |
| A | 0 | 100 | 0 |
| B | 0 | 100 | 0 |
| C | 0 | 100 | 0 |
| D | 0 | 100 | 0 |
| Mode M9 | |||
|---|---|---|---|
| Quadrant | BADHDUFLAG | Total packets | Discarded packets |
| A | 0 | 32 | 0 |
| B | 0 | 32 | 0 |
| C | 0 | 32 | 0 |
| D | 0 | 33 | 0 |
| Mode M0 | |||
|---|---|---|---|
| Quadrant | BADHDUFLAG | Total packets | Discarded packets |
| A | 0 | 10914 | 2 |
| B | 0 | 10342 | 1 |
| C | 0 | 10635 | 1 |
| D | 0 | 14216 | 1 |
| Quadrant | Total seconds | Saturated seconds | Saturation percentage |
|---|---|---|---|
| A | 4962 | 13 | 0.261991% |
| B | 4962 | 11 | 0.221685% |
| C | 4962 | 36 | 0.725514% |
| D | 4962 | 350 | 7.053607% |
Noise dominated data is calculated using 1-second bins in cleaned event files. If a bin has >2000 counts, and if more than 50% of those come from <1% of pixels, then it is considered to be noise-dominated and hence unusable.
| Quadrant | # 1 sec bins | Bins with >0 counts | Bins with >2000 counts | High rate bins dominated by noise | Noise dominated (total time) | Noise dominated (detector-on time) | Marked lightcurve |
|---|---|---|---|---|---|---|---|
| A | 7085 | 4963 | 10 | 10 | 0.14% | 0.20% | 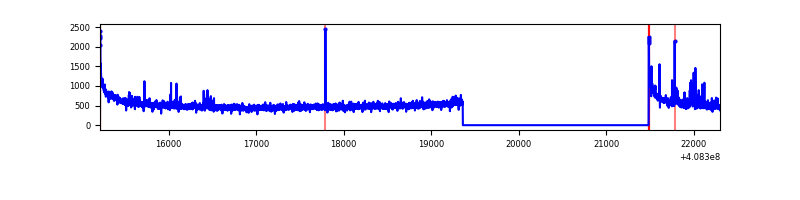 |
| B | 7085 | 4963 | 6 | 6 | 0.08% | 0.12% | 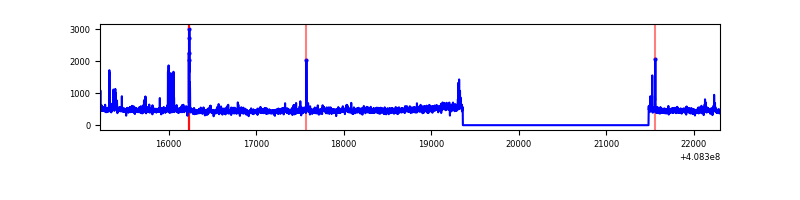 |
| C | 7085 | 4963 | 31 | 31 | 0.44% | 0.62% | 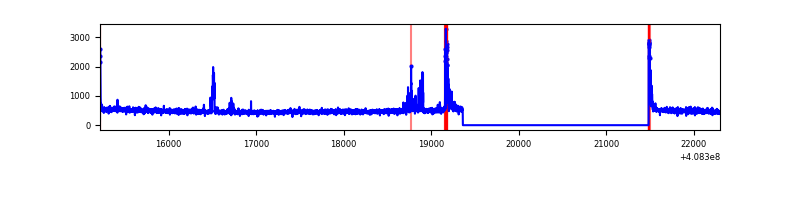 |
| D | 7085 | 4963 | 329 | 329 | 4.64% | 6.63% | 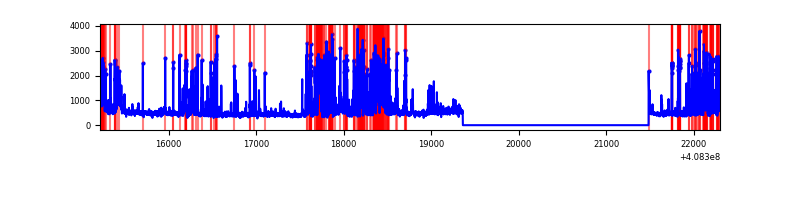 |
Top three noisy pixels from each quadrant. If the there are fewer than three noisy pixels in the level2.evt file, extra rows are filled as -1
| Pixel properties | Quadrant properties | ||||||
|---|---|---|---|---|---|---|---|
| Quadrant | DetID | PixID | Counts | Sigma | Mean | Median | Sigma |
| A | 10 | 83 | 393807 | 3572.0 | 546 | 534 | 110.1 |
| A | 13 | 248 | 82300 | 742.66 | 546 | 534 | 110.1 |
| A | 13 | 6 | 10770 | 92.97 | 546 | 534 | 110.1 |
| B | 0 | 230 | 50957 | 484.41 | 551 | 537 | 104.1 |
| B | 5 | 172 | 35276 | 333.75 | 551 | 537 | 104.1 |
| B | 0 | 190 | 31390 | 296.42 | 551 | 537 | 104.1 |
| C | 15 | 214 | 205109 | 1623.77 | 545 | 548 | 126.0 |
| C | 12 | 249 | 124915 | 987.21 | 545 | 548 | 126.0 |
| C | 0 | 10 | 57112 | 449.0 | 545 | 548 | 126.0 |
| D | 2 | 250 | 1147807 | 9115.68 | 524 | 511 | 125.9 |
| D | 12 | 6 | 128172 | 1014.31 | 524 | 511 | 125.9 |
| D | 2 | 153 | 85945 | 678.8 | 524 | 511 | 125.9 |
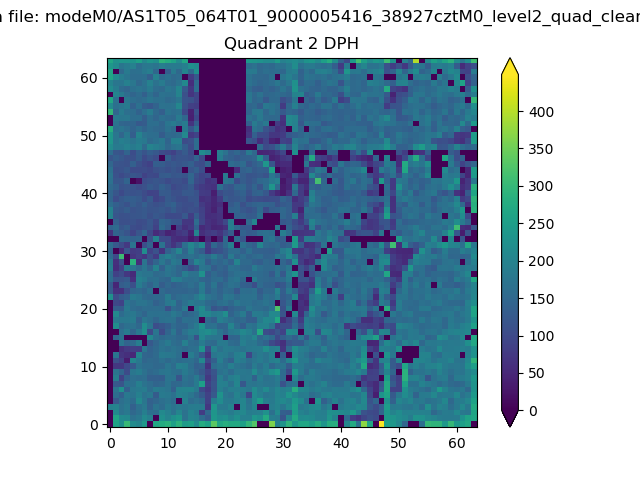
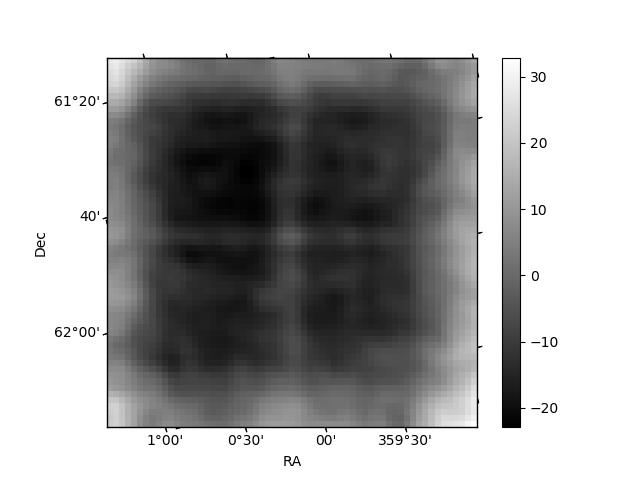
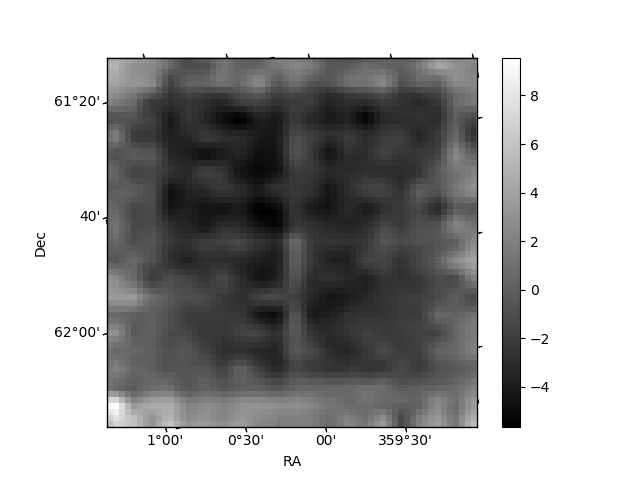
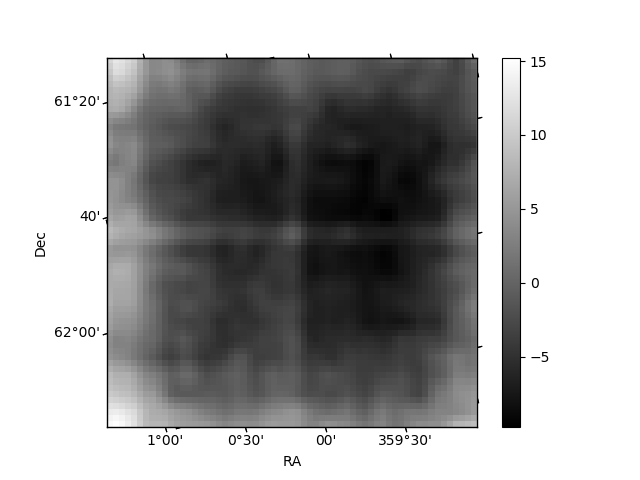
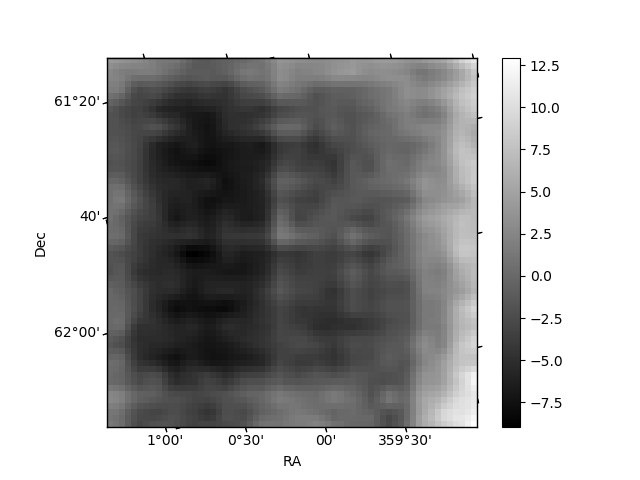
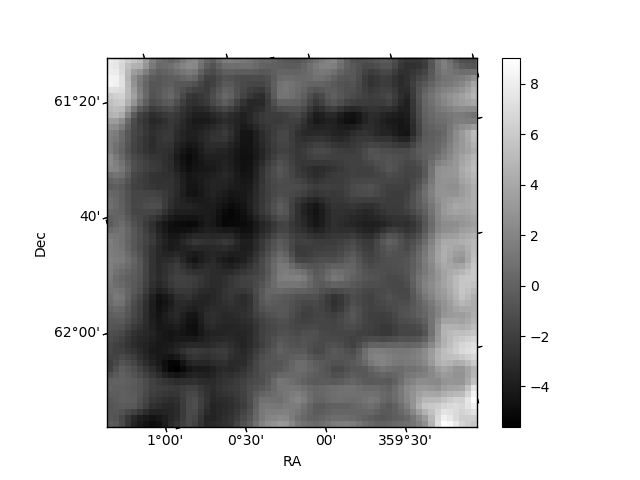
Histogram calculated using DETX and DETY for each event in the final _common_clean file
| Quadrant A | 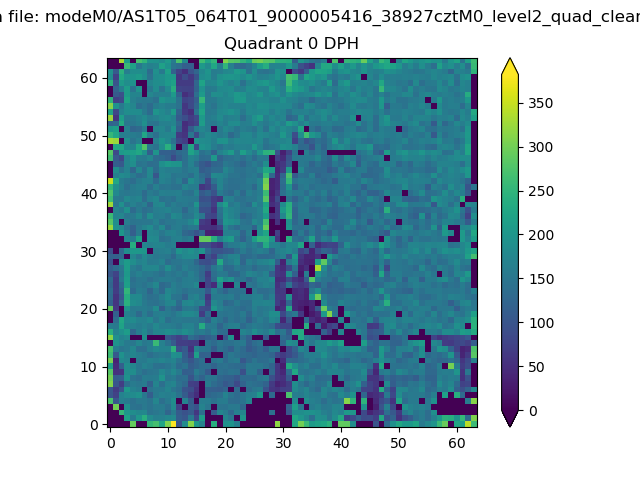 |
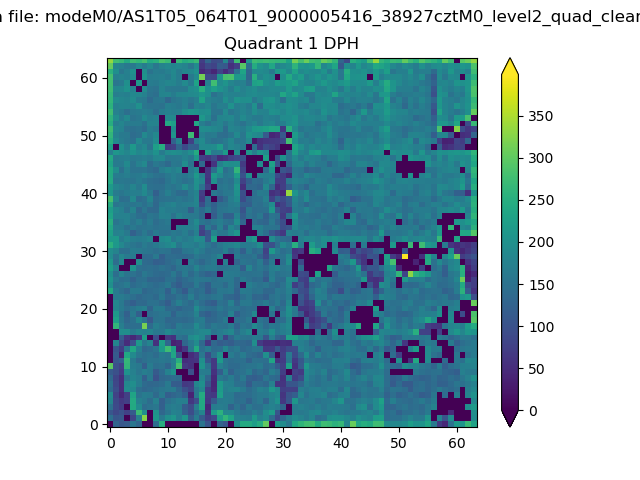 |
Quadrant B |
|---|---|---|---|
| Quadrant D | 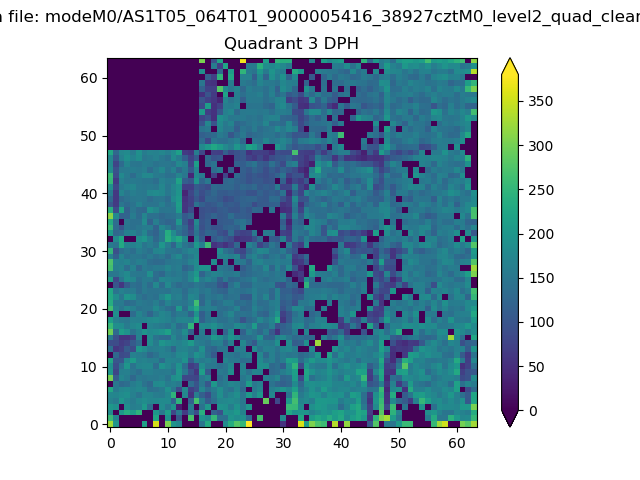 |
 |
Quadrant C |
| Plot type | Count rate plots | Images |
|---|---|---|
| Comparison with Poisson distribution Blue bars denote a histogram of data divided into 1 sec bins. Red curve is a Poisson curve with rate = median count rate of data. |
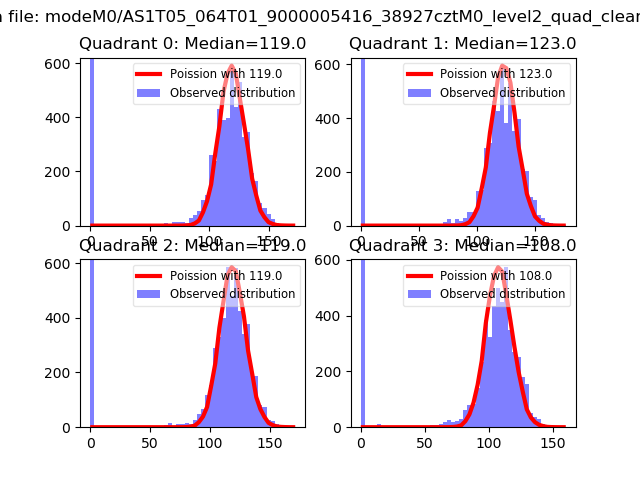 |
 |
| Quadrant-wise count rates Data is divided into 100 sec bins |
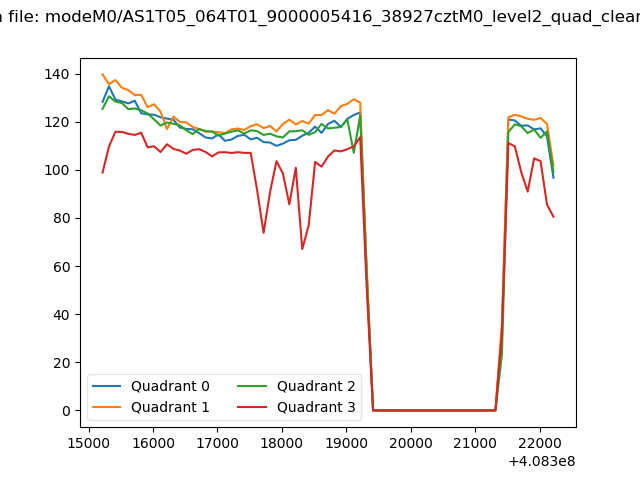 |
|
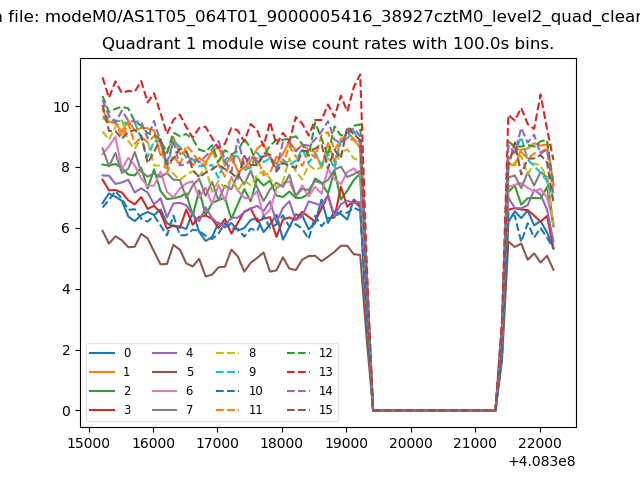
| Module-wise count rates for Quadrant A Data is divided into 100 sec bins |
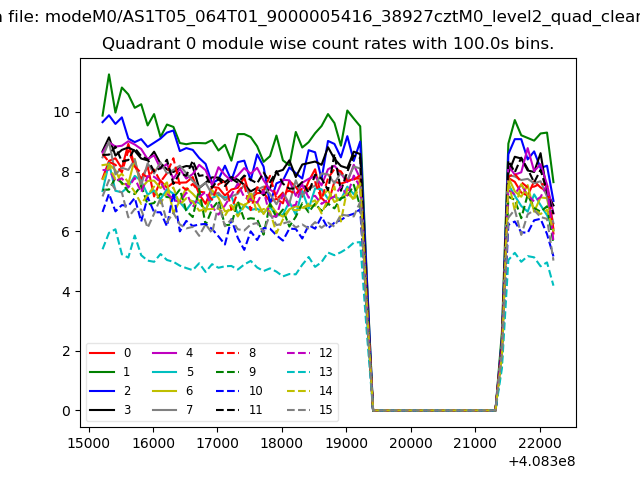 |
 |
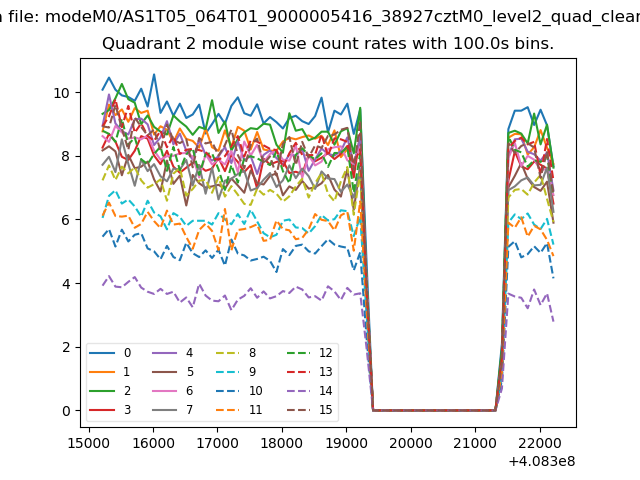
| Module-wise count rates for Quadrant B Data is divided into 100 sec bins |
 |
 |
| Module-wise count rates for Quadrant C Data is divided into 100 sec bins |
 |
 |
| Module-wise count rates for Quadrant D Data is divided into 100 sec bins |
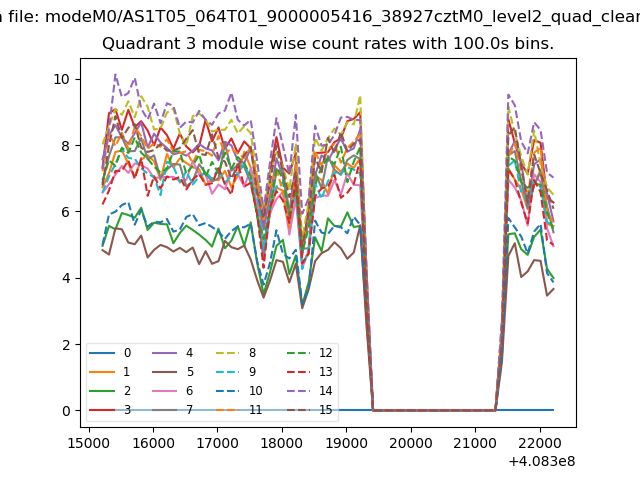 |
 |
| Parameter | Plot |
|---|---|
| CZT HV Monitor | 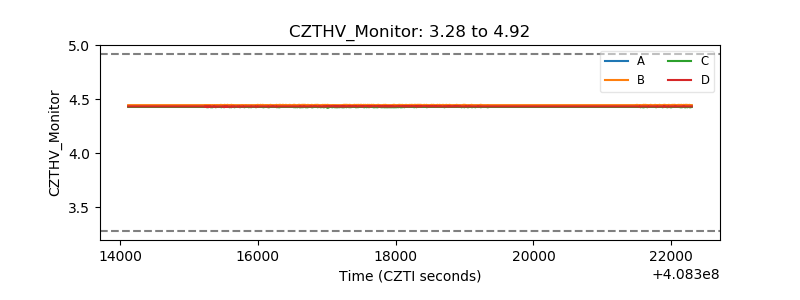 |
| D_VDD | 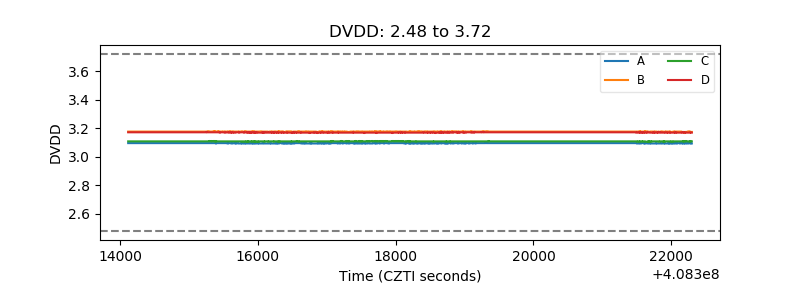 |
| Temperature 1 | 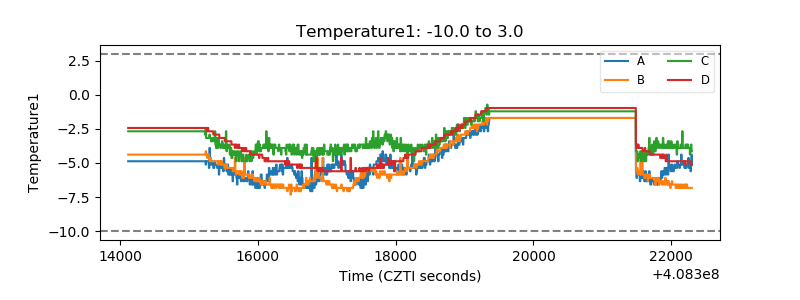 |
| Veto HV Monitor | 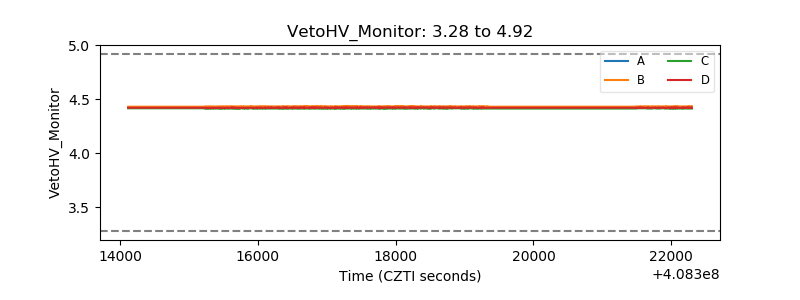 |
| Veto LLD | 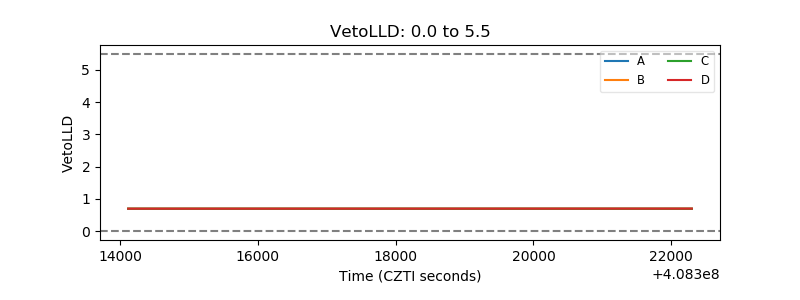 |
| Alpha Counter | 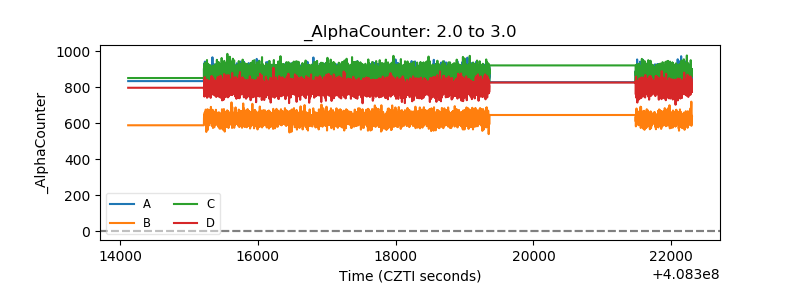 |
| _CPM_Rate | 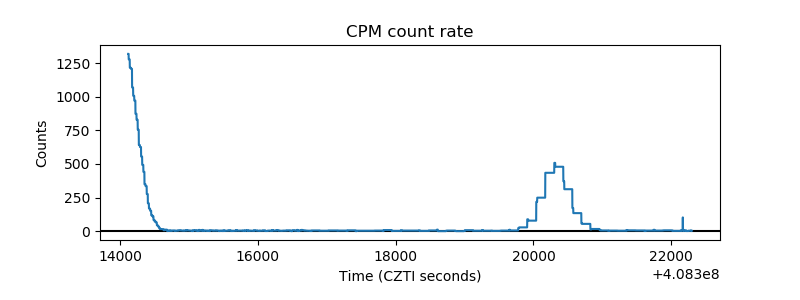 |
| CZT Counter | 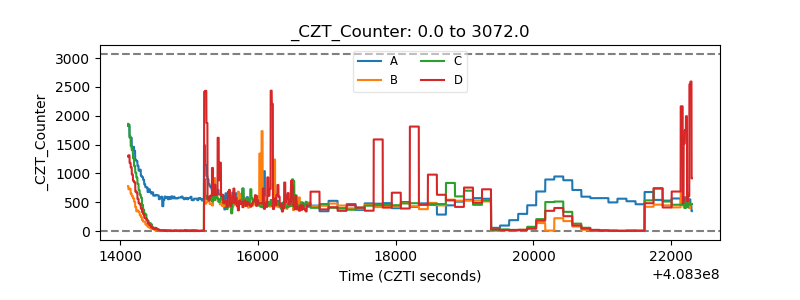 |
| +2.5 Volts monitor | 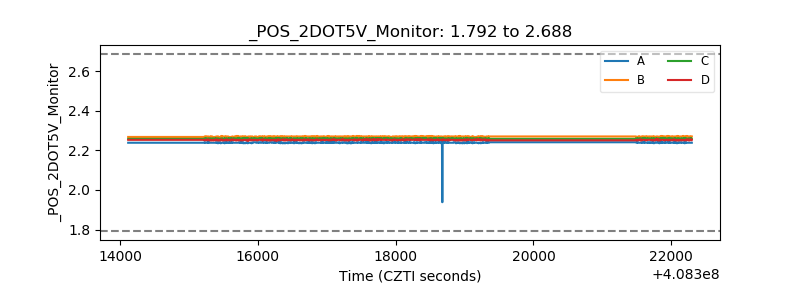 |
| +5 Volts monitor | 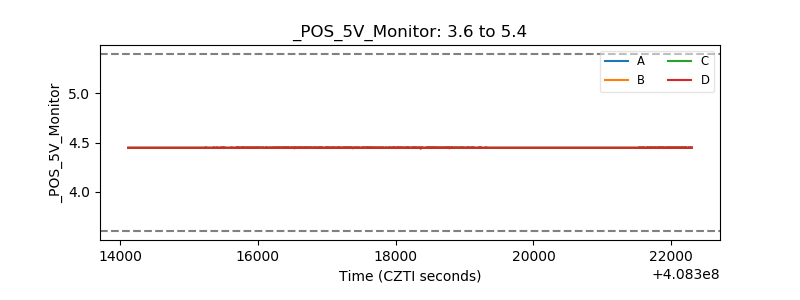 |
| _ROLL_ROT | 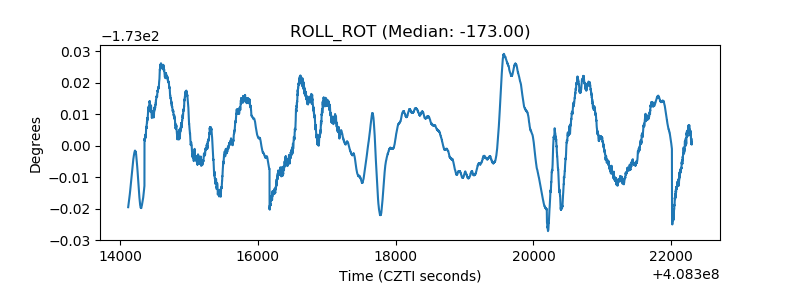 |
| _Roll_DEC | 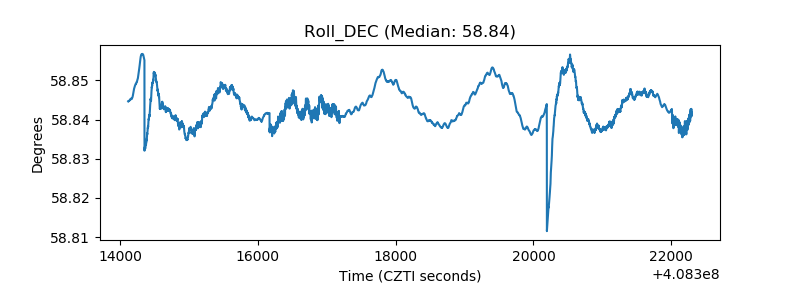 |
| _Roll_RA |  |
| Veto Counter | 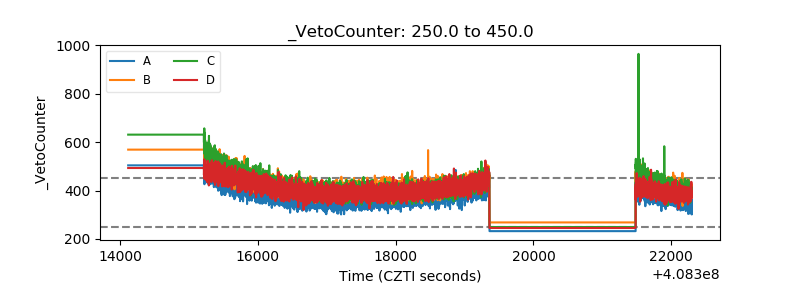 |