| Param | Original file | Final file |
|---|---|---|
| Filename | modeM0/AS1T05_064T01_9000005416_38928cztM0_level2.fits | modeM0/AS1T05_064T01_9000005416_38928cztM0_level2_quad_clean.evt |
| Size (bytes) | 327,965,760 | 85,959,360 |
| Size | 312.8 MB | 82.0 MB |
| Events in quadrant A | 2,655,928 | 575,524 |
| Events in quadrant B | 2,594,380 | 586,767 |
| Events in quadrant C | 2,404,411 | 577,334 |
| Events in quadrant D | 4,086,852 | 505,253 |
| Mode SS | |||
|---|---|---|---|
| Quadrant | BADHDUFLAG | Total packets | Discarded packets |
| A | 0 | 102 | 0 |
| B | 0 | 102 | 0 |
| C | 0 | 102 | 0 |
| D | 0 | 102 | 0 |
| Mode M9 | |||
|---|---|---|---|
| Quadrant | BADHDUFLAG | Total packets | Discarded packets |
| A | 0 | 35 | 0 |
| B | 0 | 35 | 0 |
| C | 0 | 35 | 0 |
| D | 0 | 36 | 0 |
| Mode M0 | |||
|---|---|---|---|
| Quadrant | BADHDUFLAG | Total packets | Discarded packets |
| A | 0 | 11147 | 3 |
| B | 0 | 11178 | 2 |
| C | 0 | 10420 | 2 |
| D | 0 | 15669 | 2 |
| Quadrant | Total seconds | Saturated seconds | Saturation percentage |
|---|---|---|---|
| A | 5114 | 12 | 0.234650% |
| B | 5114 | 93 | 1.818537% |
| C | 5114 | 16 | 0.312867% |
| D | 5114 | 336 | 6.570199% |
Noise dominated data is calculated using 1-second bins in cleaned event files. If a bin has >2000 counts, and if more than 50% of those come from <1% of pixels, then it is considered to be noise-dominated and hence unusable.
| Quadrant | # 1 sec bins | Bins with >0 counts | Bins with >2000 counts | High rate bins dominated by noise | Noise dominated (total time) | Noise dominated (detector-on time) | Marked lightcurve |
|---|---|---|---|---|---|---|---|
| A | 7027 | 5115 | 8 | 8 | 0.11% | 0.16% | 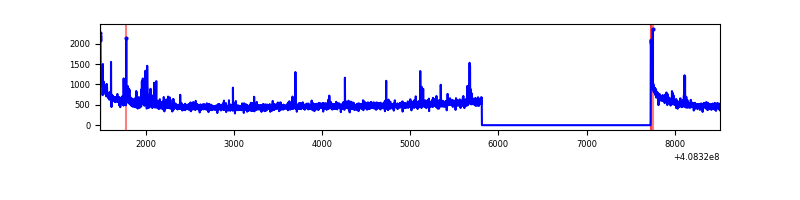 |
| B | 7027 | 5115 | 73 | 73 | 1.04% | 1.43% | 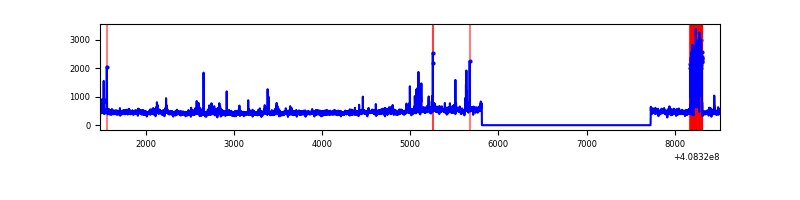 |
| C | 7027 | 5115 | 10 | 10 | 0.14% | 0.20% | 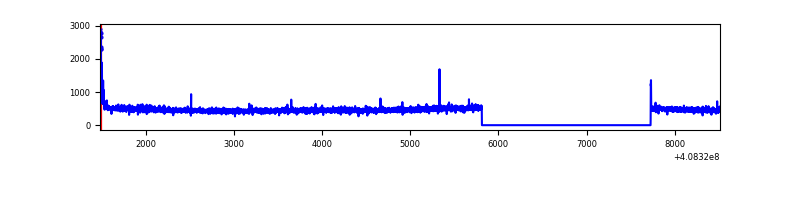 |
| D | 7027 | 5115 | 335 | 335 | 4.77% | 6.55% | 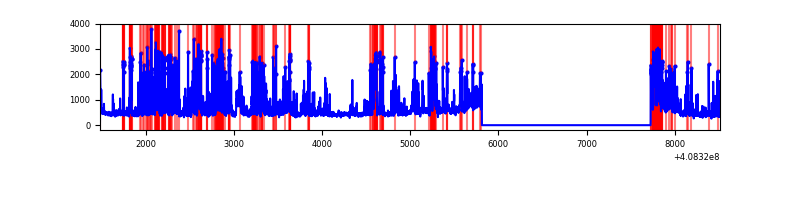 |
Top three noisy pixels from each quadrant. If the there are fewer than three noisy pixels in the level2.evt file, extra rows are filled as -1
| Pixel properties | Quadrant properties | ||||||
|---|---|---|---|---|---|---|---|
| Quadrant | DetID | PixID | Counts | Sigma | Mean | Median | Sigma |
| A | 10 | 83 | 398392 | 3516.11 | 554 | 542 | 113.2 |
| A | 13 | 248 | 95832 | 842.15 | 554 | 542 | 113.2 |
| A | 13 | 6 | 10480 | 87.83 | 554 | 542 | 113.2 |
| B | 5 | 172 | 238141 | 2245.14 | 551 | 535 | 105.8 |
| B | 0 | 190 | 70138 | 657.68 | 551 | 535 | 105.8 |
| B | 0 | 155 | 53709 | 502.44 | 551 | 535 | 105.8 |
| C | 15 | 214 | 210421 | 1651.23 | 547 | 551 | 127.1 |
| C | 0 | 10 | 48994 | 381.14 | 547 | 551 | 127.1 |
| C | 14 | 67 | 5923 | 42.27 | 547 | 551 | 127.1 |
| D | 2 | 250 | 1003565 | 7840.27 | 528 | 513 | 127.9 |
| D | 12 | 227 | 372222 | 2905.43 | 528 | 513 | 127.9 |
| D | 13 | 249 | 157283 | 1225.38 | 528 | 513 | 127.9 |
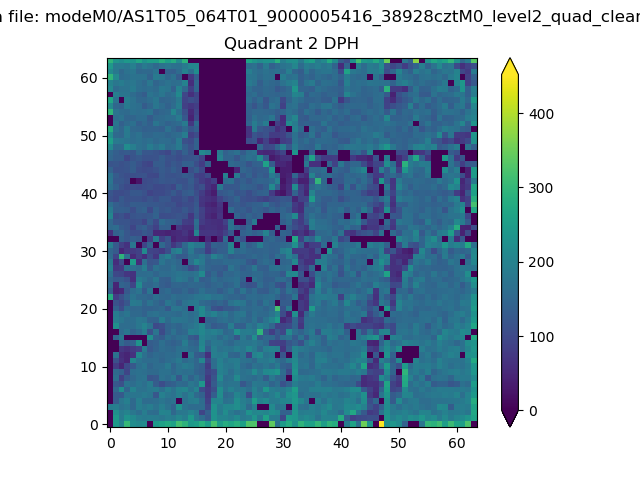
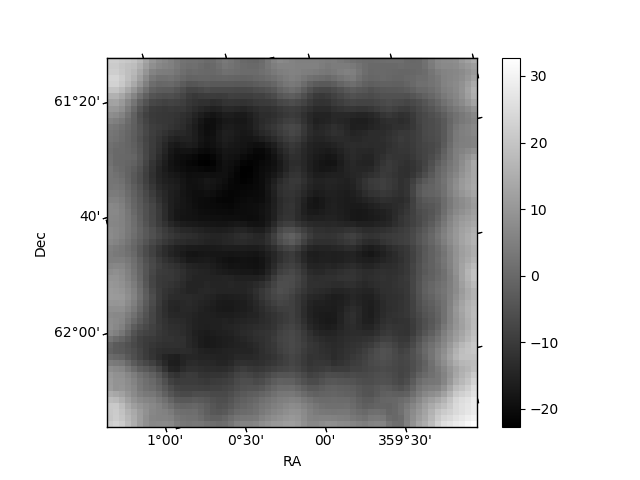
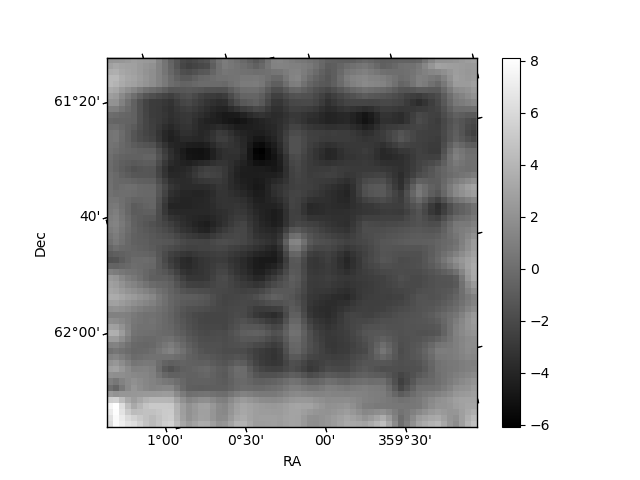
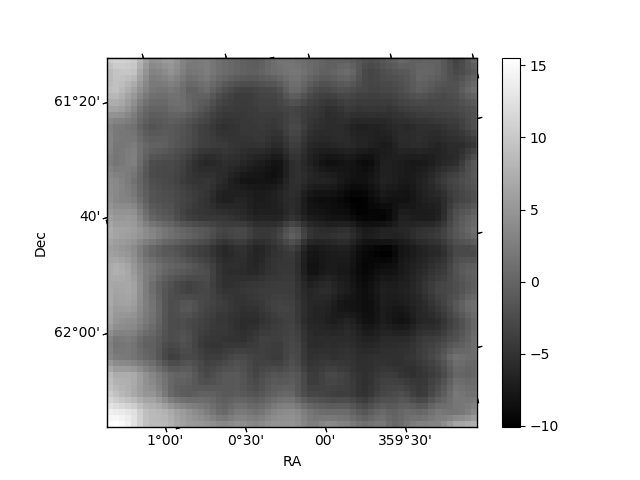
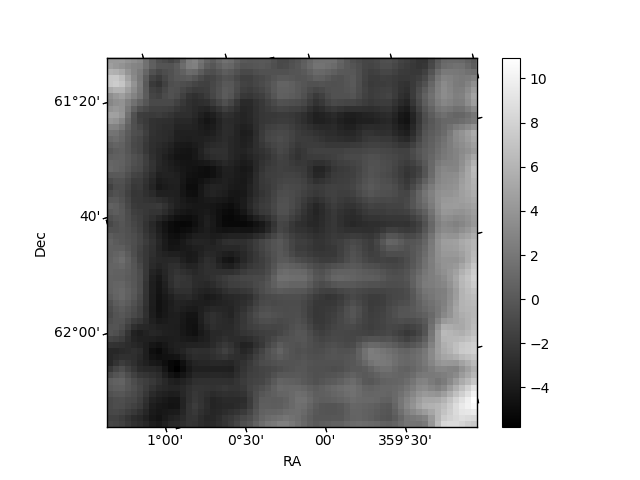
Histogram calculated using DETX and DETY for each event in the final _common_clean file
| Quadrant A | 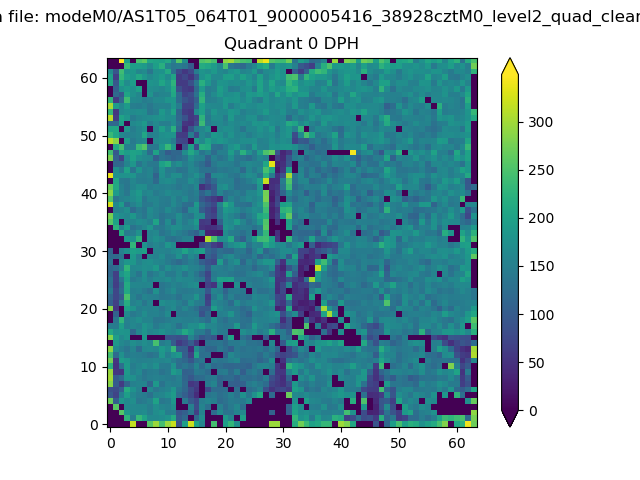 |
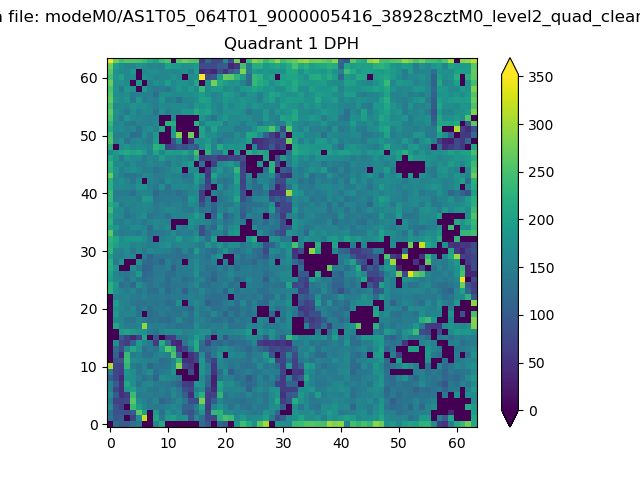 |
Quadrant B |
|---|---|---|---|
| Quadrant D | 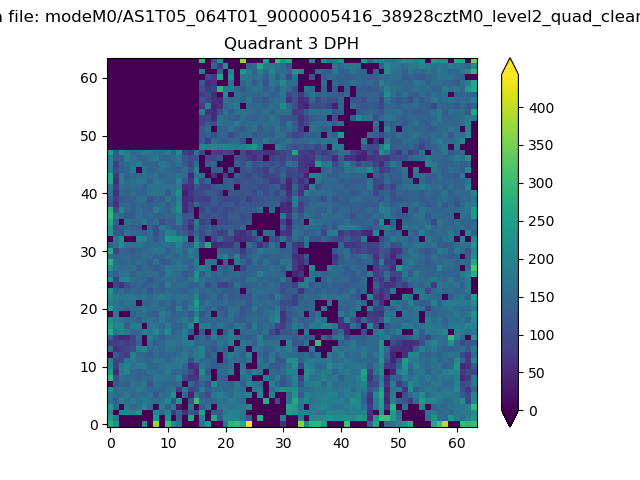 |
 |
Quadrant C |
| Plot type | Count rate plots | Images |
|---|---|---|
| Comparison with Poisson distribution Blue bars denote a histogram of data divided into 1 sec bins. Red curve is a Poisson curve with rate = median count rate of data. |
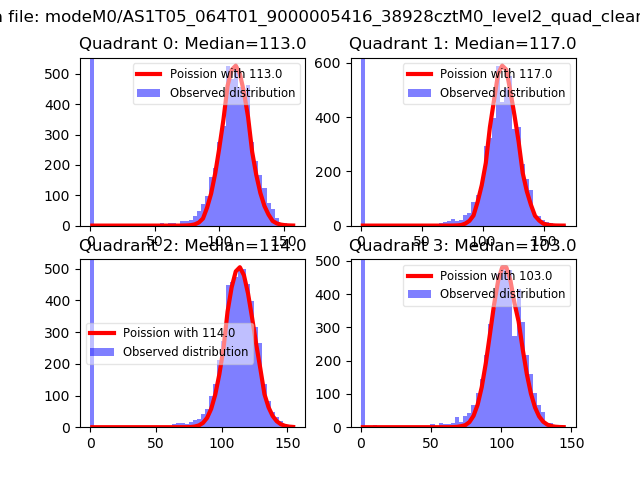 |
 |
| Quadrant-wise count rates Data is divided into 100 sec bins |
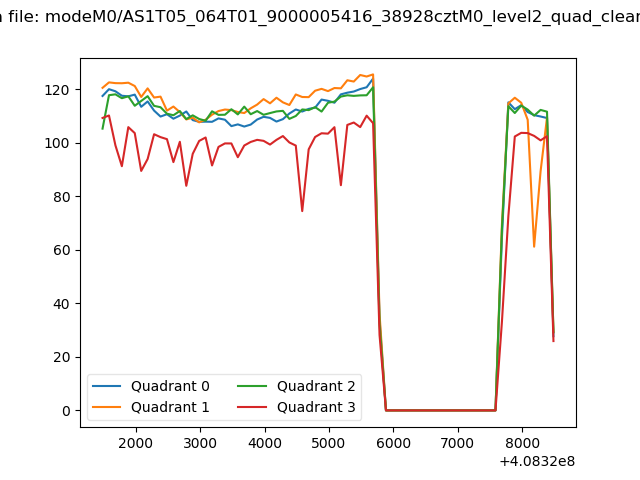 |
|
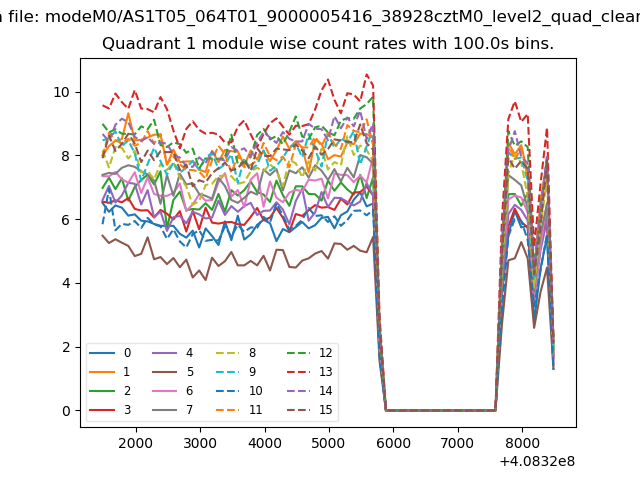
| Module-wise count rates for Quadrant A Data is divided into 100 sec bins |
 |
 |
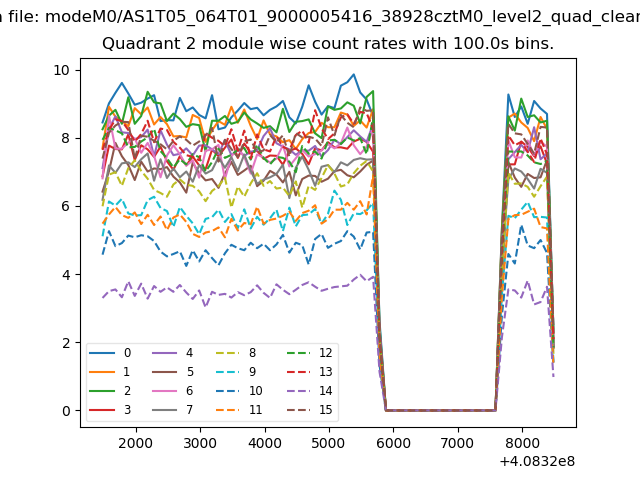
| Module-wise count rates for Quadrant B Data is divided into 100 sec bins |
 |
 |
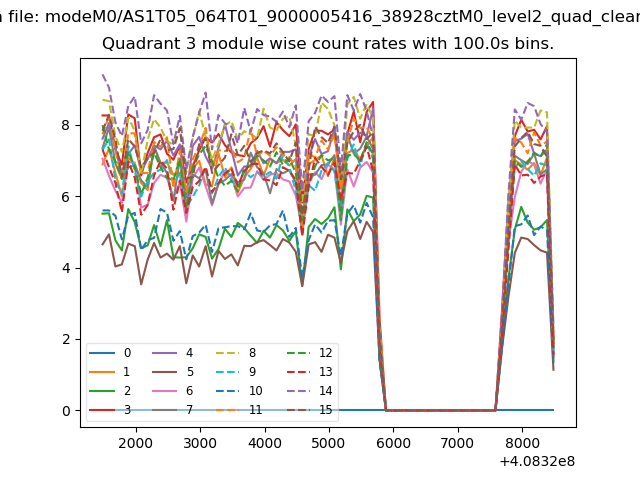
| Module-wise count rates for Quadrant C Data is divided into 100 sec bins |
 |
 |
| Module-wise count rates for Quadrant D Data is divided into 100 sec bins |
 |
 |
| Parameter | Plot |
|---|---|
| CZT HV Monitor | 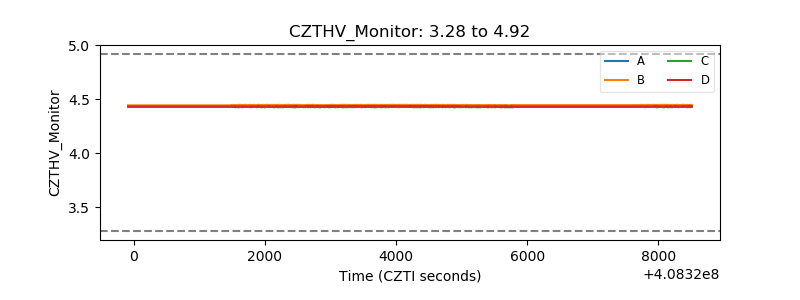 |
| D_VDD | 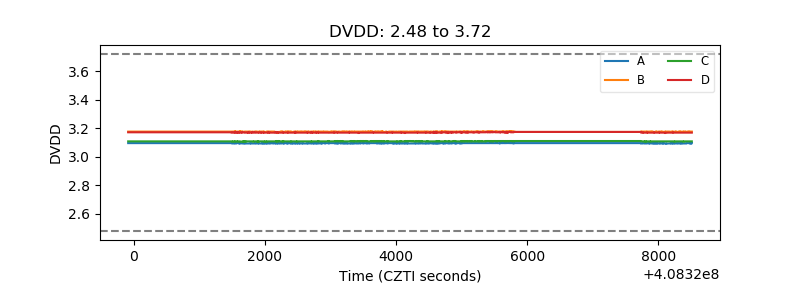 |
| Temperature 1 | 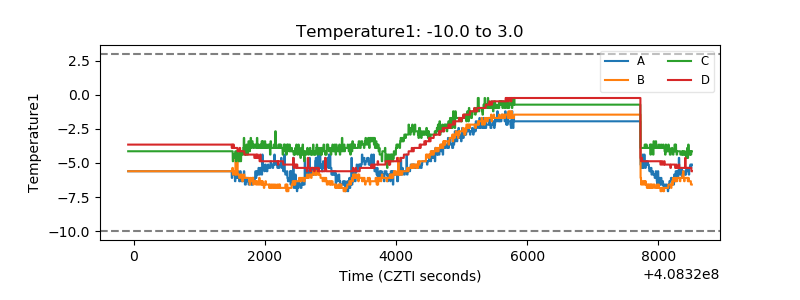 |
| Veto HV Monitor | 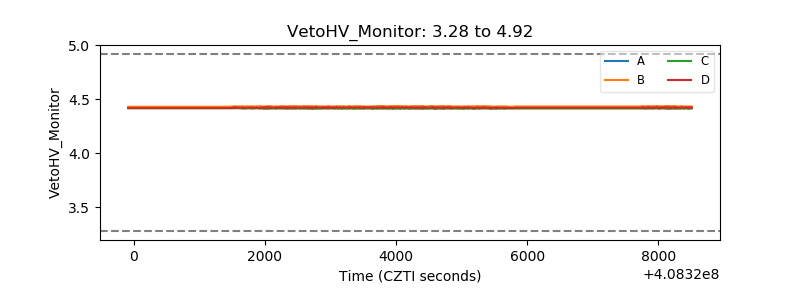 |
| Veto LLD | 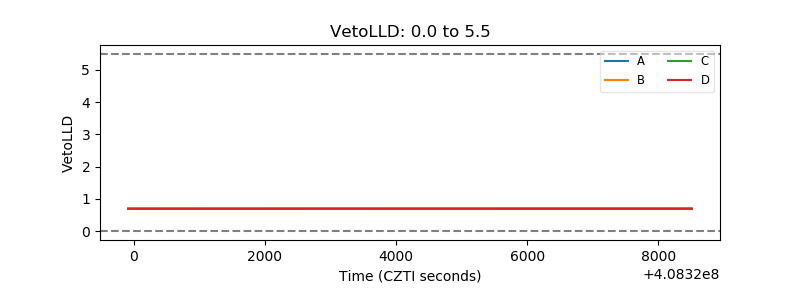 |
| Alpha Counter | 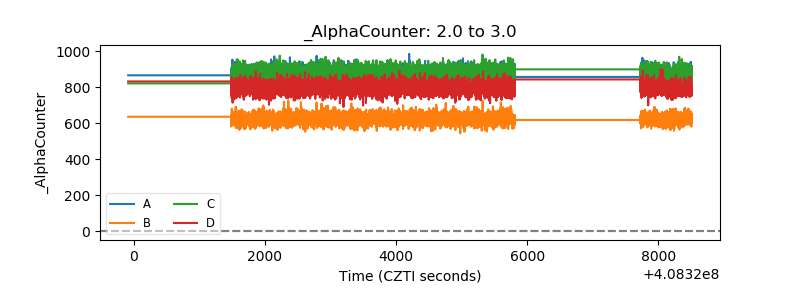 |
| _CPM_Rate | 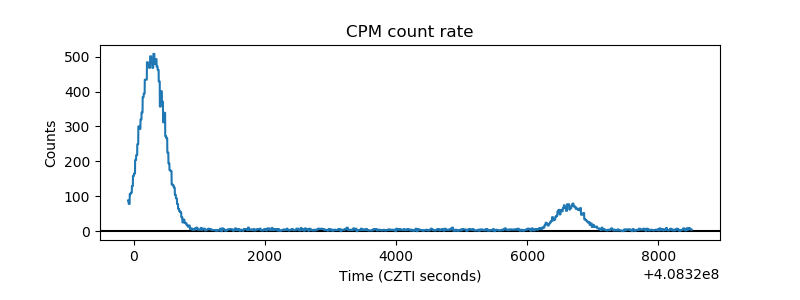 |
| CZT Counter | 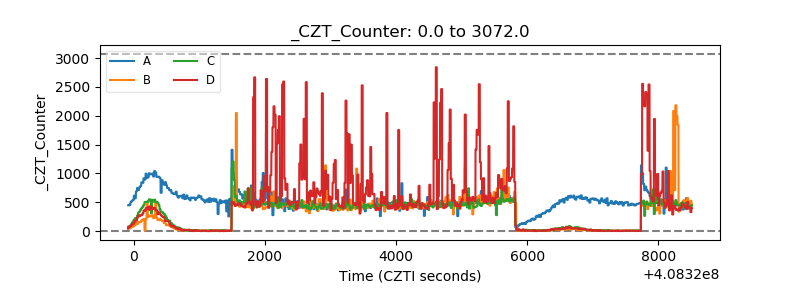 |
| +2.5 Volts monitor | 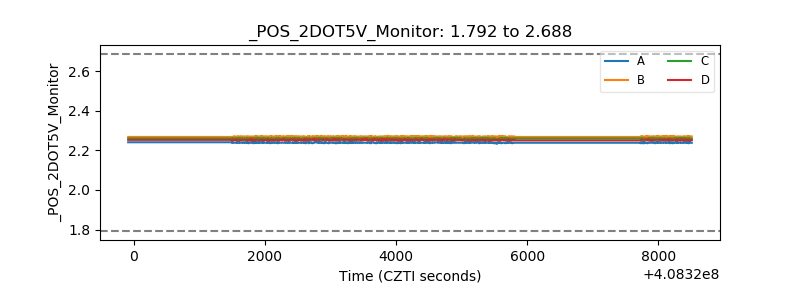 |
| +5 Volts monitor | 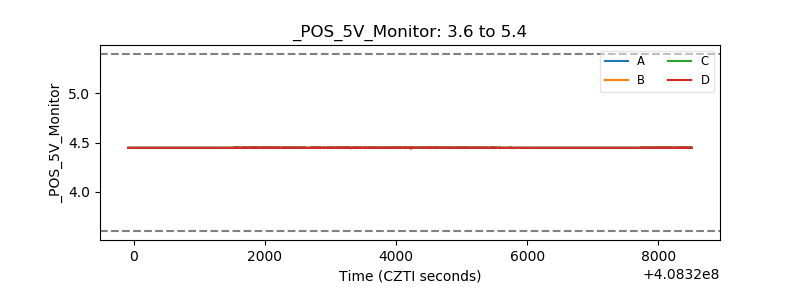 |
| _ROLL_ROT | 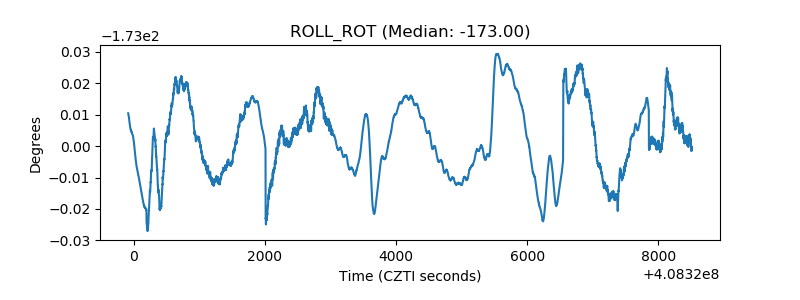 |
| _Roll_DEC | 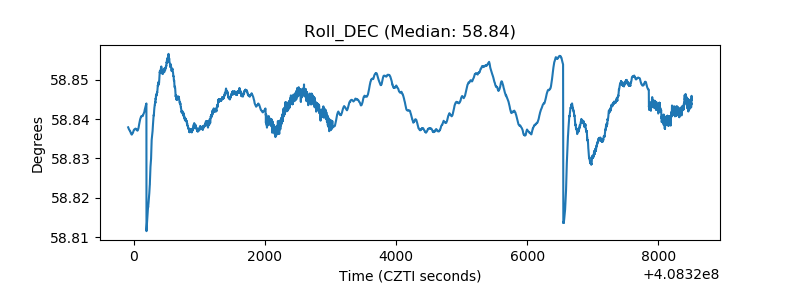 |
| _Roll_RA | 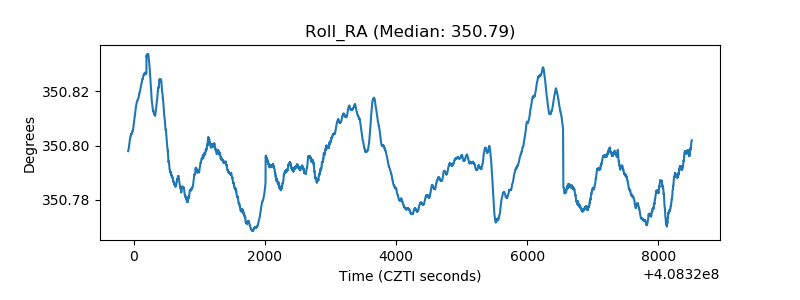 |
| Veto Counter | 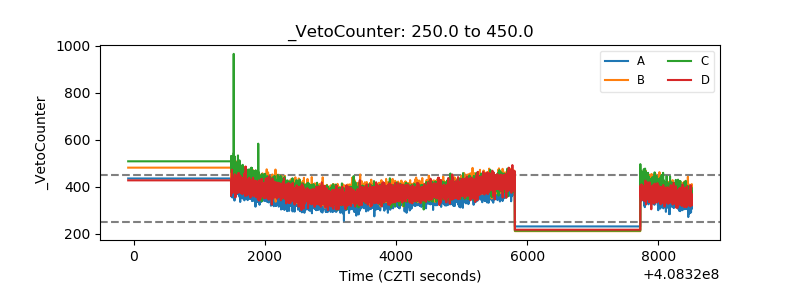 |