| Param | Original file | Final file |
|---|---|---|
| Filename | modeM0/AS1T05_064T01_9000005416_38929cztM0_level2.fits | modeM0/AS1T05_064T01_9000005416_38929cztM0_level2_quad_clean.evt |
| Size (bytes) | 350,861,760 | 95,685,120 |
| Size | 334.6 MB | 91.3 MB |
| Events in quadrant A | 3,289,816 | 629,563 |
| Events in quadrant B | 3,103,062 | 646,127 |
| Events in quadrant C | 2,698,813 | 638,276 |
| Events in quadrant D | 3,445,017 | 579,238 |
| Mode SS | |||
|---|---|---|---|
| Quadrant | BADHDUFLAG | Total packets | Discarded packets |
| A | 0 | 118 | 0 |
| B | 0 | 118 | 0 |
| C | 0 | 118 | 0 |
| D | 0 | 118 | 0 |
| Mode M9 | |||
|---|---|---|---|
| Quadrant | BADHDUFLAG | Total packets | Discarded packets |
| A | 0 | 36 | 0 |
| B | 0 | 36 | 0 |
| C | 0 | 36 | 0 |
| D | 0 | 36 | 0 |
| Mode M0 | |||
|---|---|---|---|
| Quadrant | BADHDUFLAG | Total packets | Discarded packets |
| A | 0 | 13400 | 3 |
| B | 0 | 13101 | 2 |
| C | 0 | 11708 | 2 |
| D | 0 | 14467 | 2 |
| Quadrant | Total seconds | Saturated seconds | Saturation percentage |
|---|---|---|---|
| A | 5786 | 124 | 2.143104% |
| B | 5786 | 134 | 2.315935% |
| C | 5786 | 6 | 0.103699% |
| D | 5786 | 164 | 2.834428% |
Noise dominated data is calculated using 1-second bins in cleaned event files. If a bin has >2000 counts, and if more than 50% of those come from <1% of pixels, then it is considered to be noise-dominated and hence unusable.
| Quadrant | # 1 sec bins | Bins with >0 counts | Bins with >2000 counts | High rate bins dominated by noise | Noise dominated (total time) | Noise dominated (detector-on time) | Marked lightcurve |
|---|---|---|---|---|---|---|---|
| A | 9282 | 5788 | 117 | 117 | 1.26% | 2.02% | 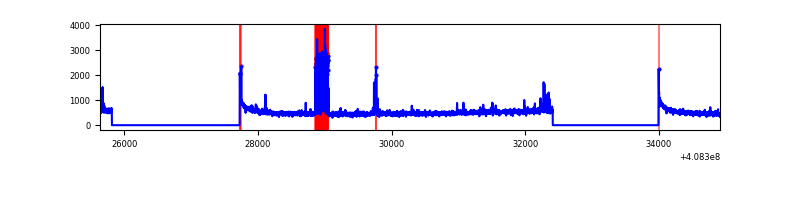 |
| B | 9282 | 5788 | 104 | 104 | 1.12% | 1.80% | 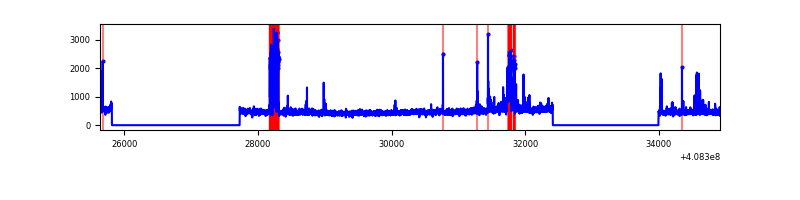 |
| C | 9282 | 5788 | 4 | 4 | 0.04% | 0.07% | 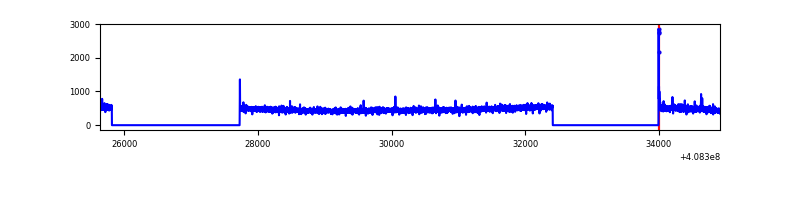 |
| D | 9282 | 5788 | 152 | 152 | 1.64% | 2.63% | 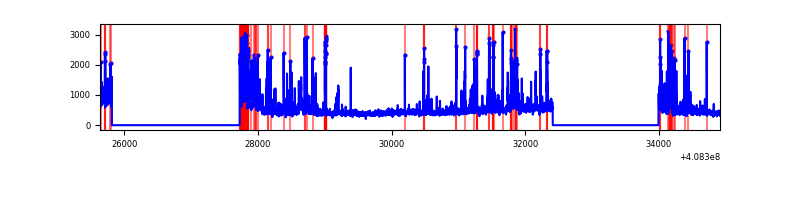 |
Top three noisy pixels from each quadrant. If the there are fewer than three noisy pixels in the level2.evt file, extra rows are filled as -1
| Pixel properties | Quadrant properties | ||||||
|---|---|---|---|---|---|---|---|
| Quadrant | DetID | PixID | Counts | Sigma | Mean | Median | Sigma |
| A | 10 | 83 | 435130 | 3417.66 | 625 | 612 | 127.1 |
| A | 13 | 248 | 406968 | 3196.15 | 625 | 612 | 127.1 |
| A | 13 | 6 | 13872 | 104.3 | 625 | 612 | 127.1 |
| B | 5 | 172 | 347951 | 2874.54 | 622 | 605 | 120.8 |
| B | 0 | 155 | 112461 | 925.69 | 622 | 605 | 120.8 |
| B | 0 | 190 | 63184 | 517.89 | 622 | 605 | 120.8 |
| C | 15 | 214 | 236309 | 1637.93 | 620 | 624 | 143.9 |
| C | 0 | 10 | 20288 | 136.66 | 620 | 624 | 143.9 |
| C | 14 | 254 | 15460 | 103.11 | 620 | 624 | 143.9 |
| D | 2 | 250 | 357100 | 2408.43 | 611 | 594 | 148.0 |
| D | 2 | 153 | 204146 | 1375.13 | 611 | 594 | 148.0 |
| D | 12 | 6 | 146879 | 988.25 | 611 | 594 | 148.0 |
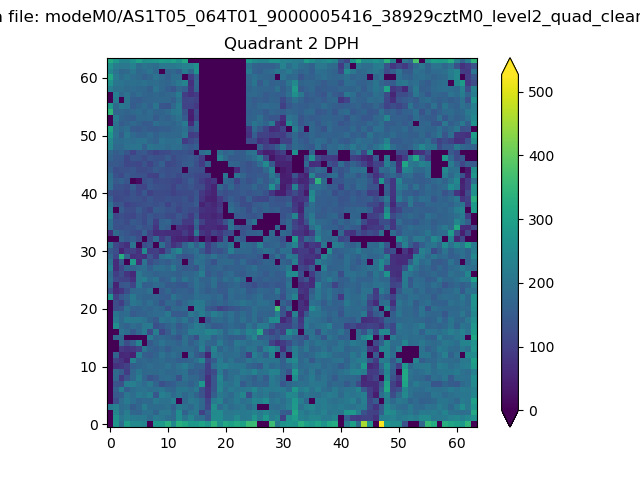
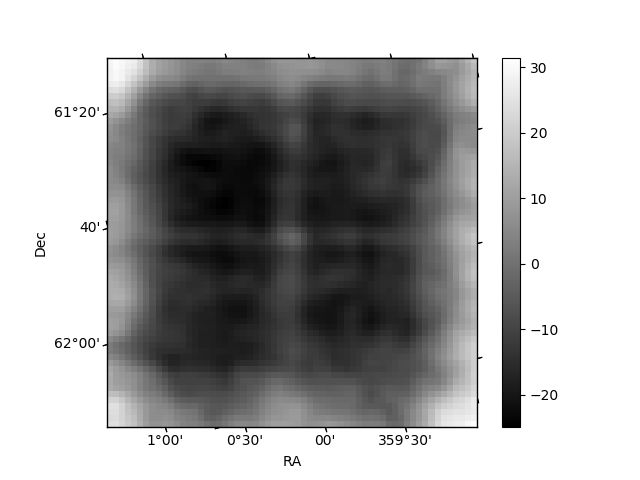
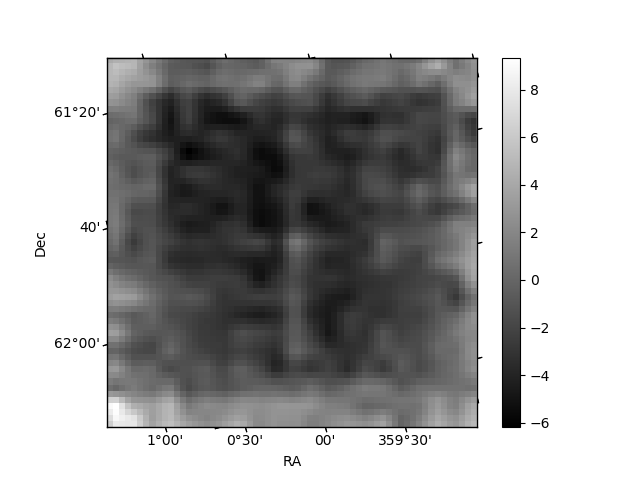
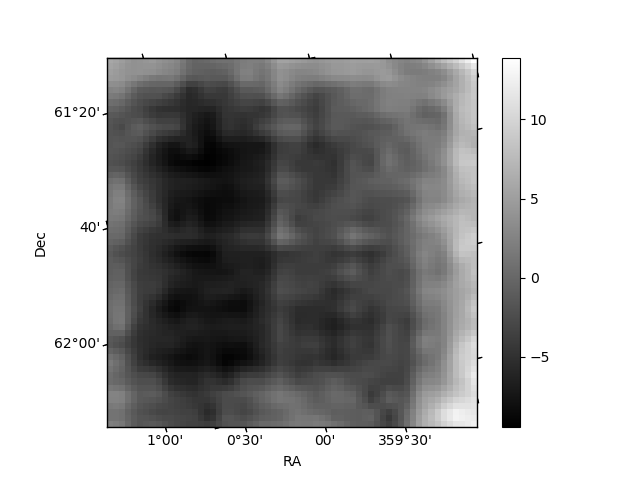
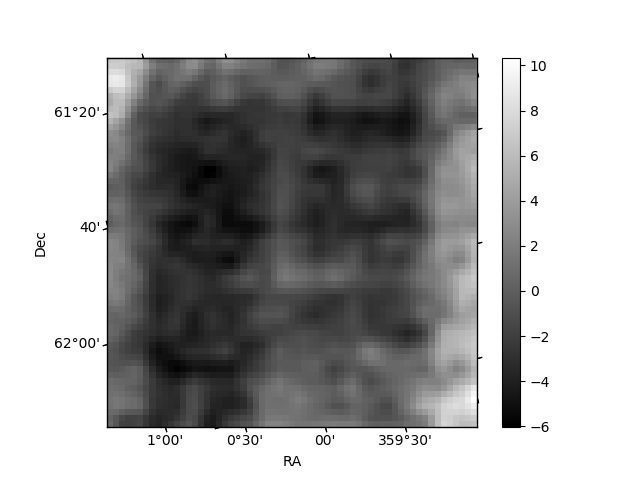
Histogram calculated using DETX and DETY for each event in the final _common_clean file
| Quadrant A | 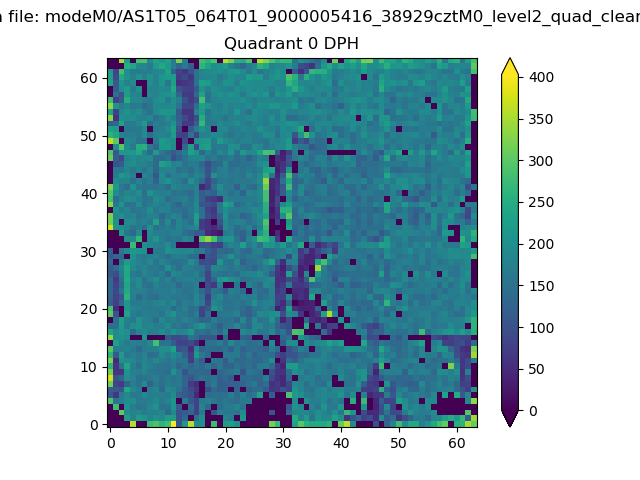 |
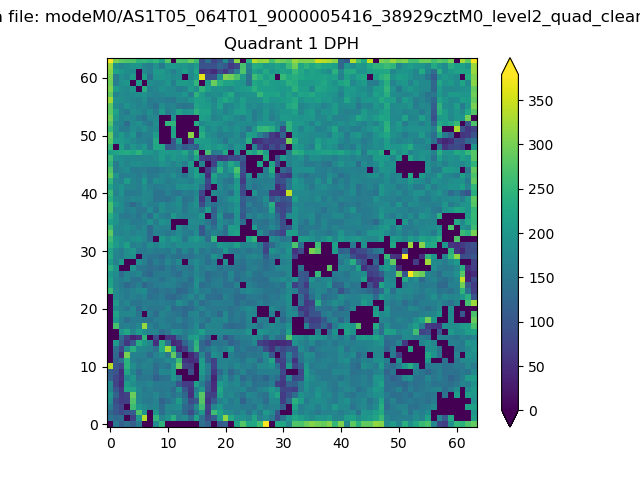 |
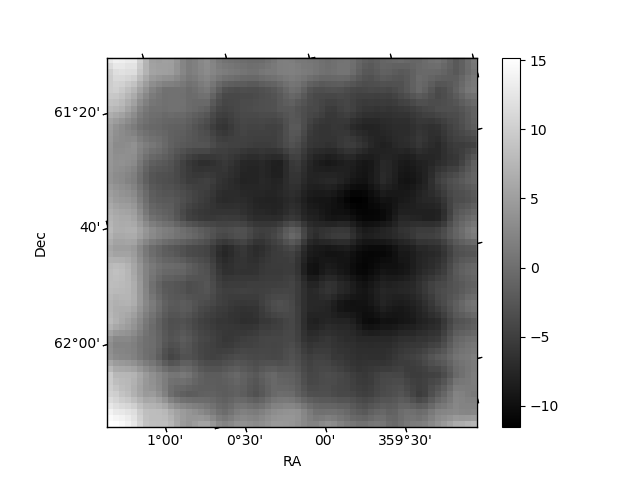
Quadrant B |
|---|---|---|---|
| Quadrant D | 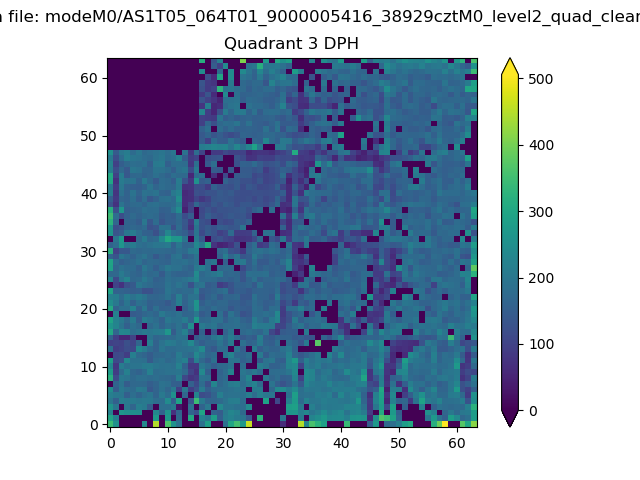 |
 |
Quadrant C |
| Plot type | Count rate plots | Images |
|---|---|---|
| Comparison with Poisson distribution Blue bars denote a histogram of data divided into 1 sec bins. Red curve is a Poisson curve with rate = median count rate of data. |
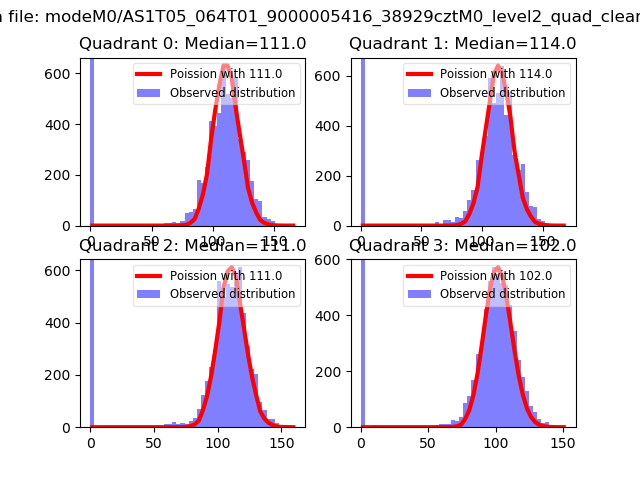 |
 |
| Quadrant-wise count rates Data is divided into 100 sec bins |
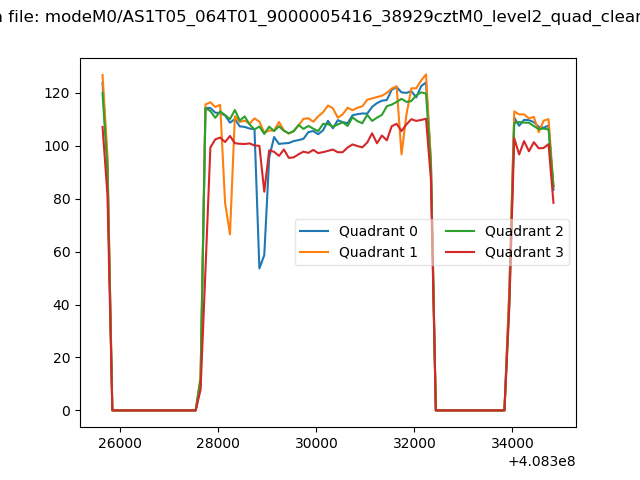 |
|
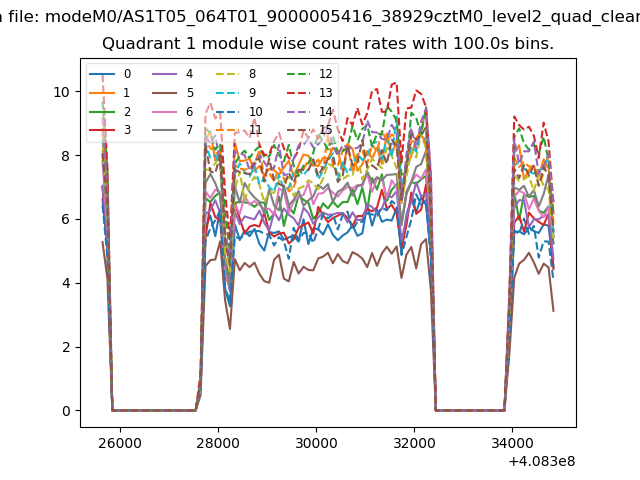
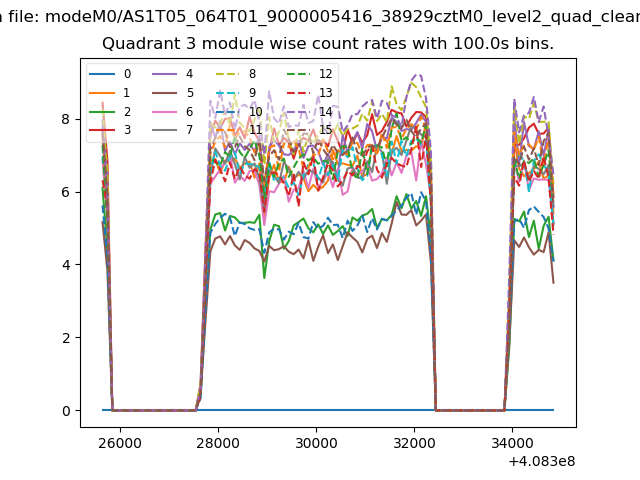
| Module-wise count rates for Quadrant A Data is divided into 100 sec bins |
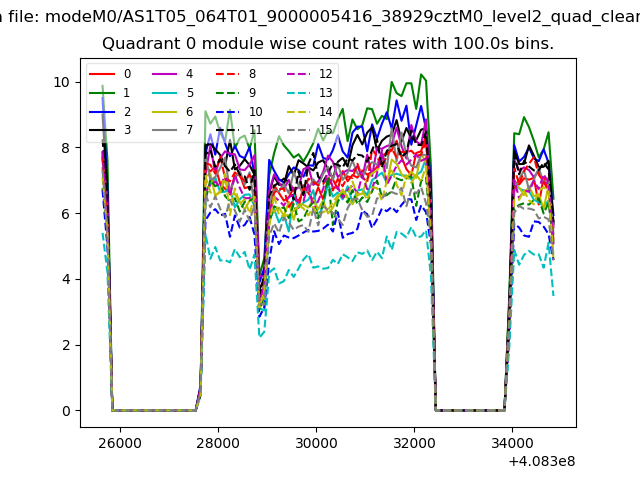 |
 |
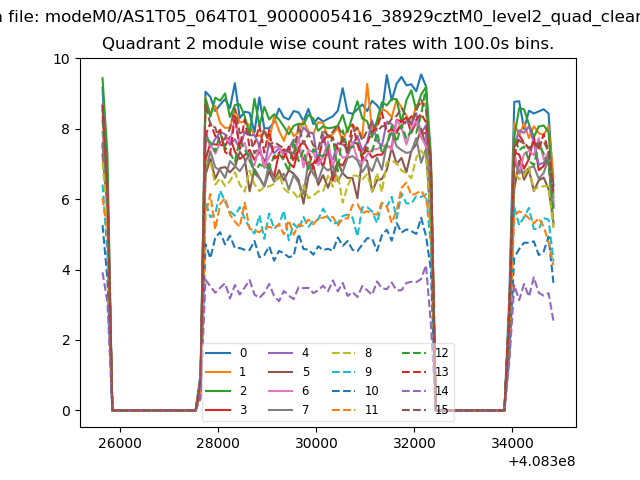
| Module-wise count rates for Quadrant B Data is divided into 100 sec bins |
 |
 |
| Module-wise count rates for Quadrant C Data is divided into 100 sec bins |
 |
 |
| Module-wise count rates for Quadrant D Data is divided into 100 sec bins |
 |
 |
| Parameter | Plot |
|---|---|
| CZT HV Monitor | 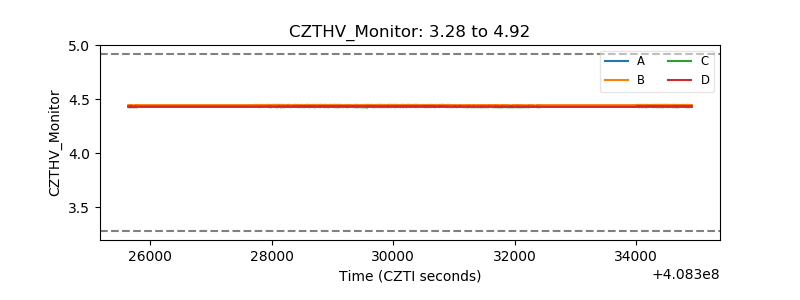 |
| D_VDD | 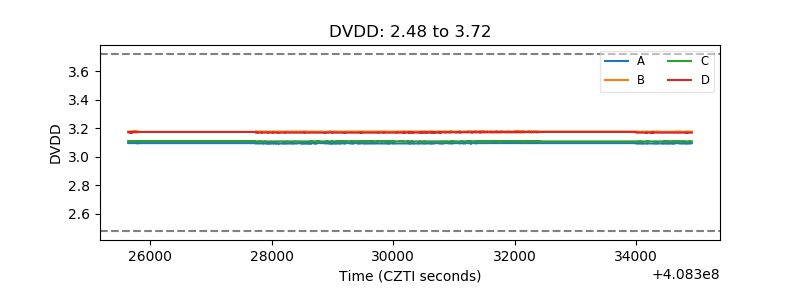 |
| Temperature 1 | 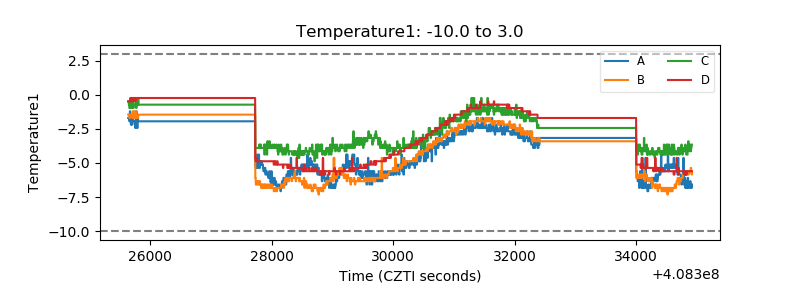 |
| Veto HV Monitor | 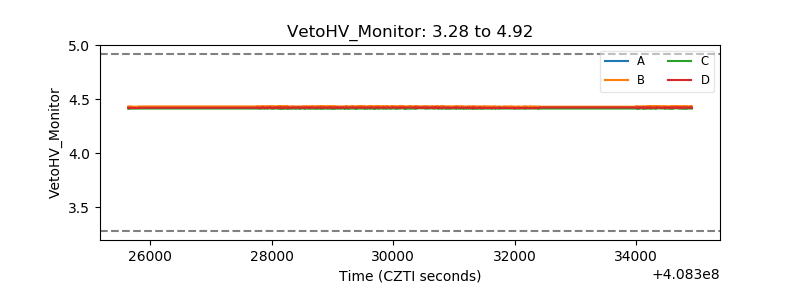 |
| Veto LLD | 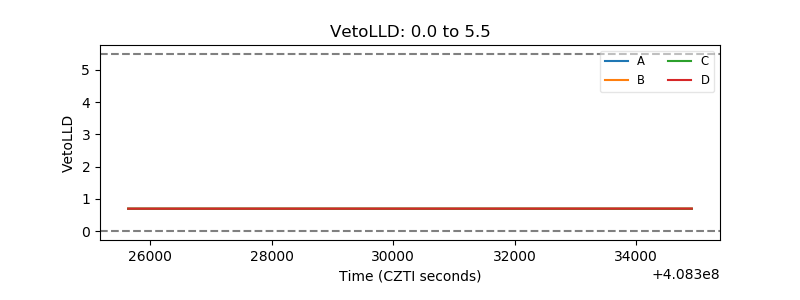 |
| Alpha Counter | 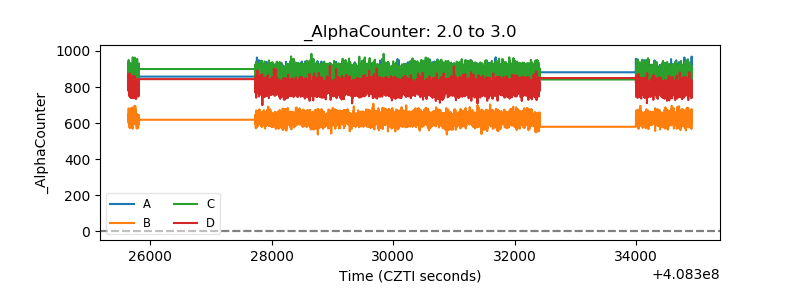 |
| _CPM_Rate | 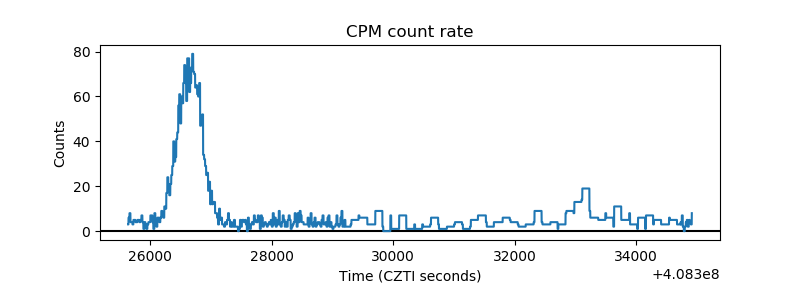 |
| CZT Counter | 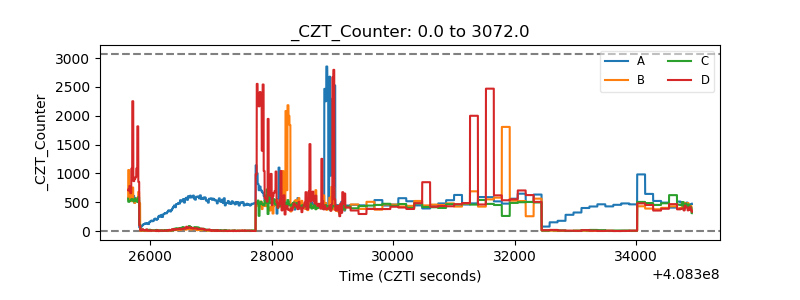 |
| +2.5 Volts monitor | 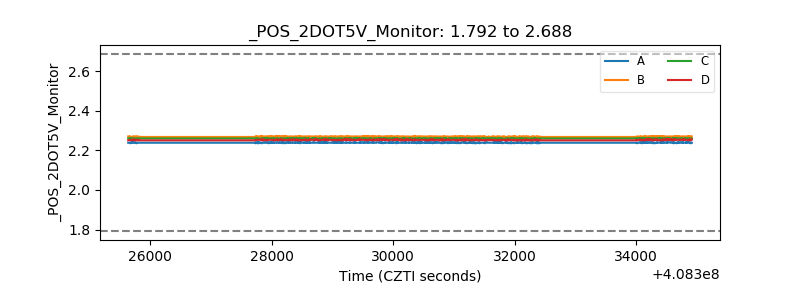 |
| +5 Volts monitor |  |
| _ROLL_ROT | 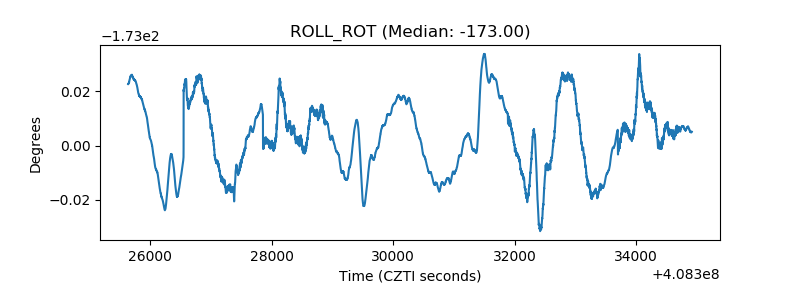 |
| _Roll_DEC | 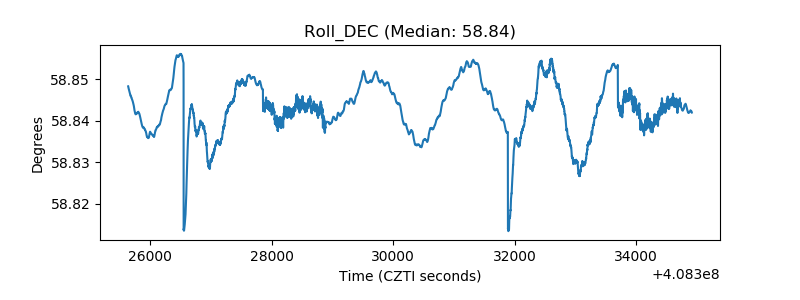 |
| _Roll_RA | 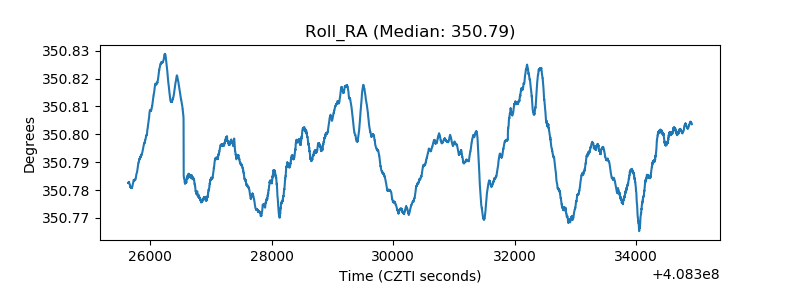 |
| Veto Counter | 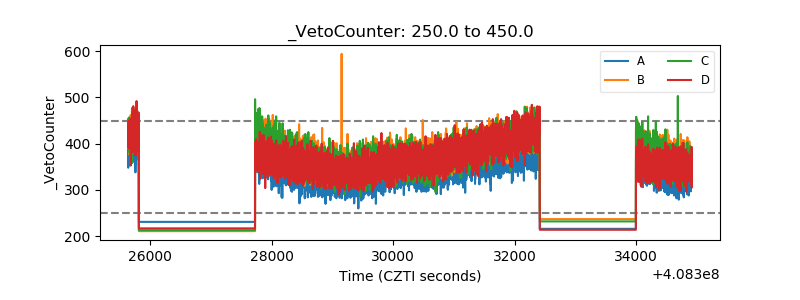 |