| Param | Original file | Final file |
|---|---|---|
| Filename | modeM0/AS1T05_064T01_9000005416_38930cztM0_level2.fits | modeM0/AS1T05_064T01_9000005416_38930cztM0_level2_quad_clean.evt |
| Size (bytes) | 339,252,480 | 97,997,760 |
| Size | 323.5 MB | 93.5 MB |
| Events in quadrant A | 3,086,206 | 649,582 |
| Events in quadrant B | 3,155,968 | 657,639 |
| Events in quadrant C | 2,802,417 | 644,988 |
| Events in quadrant D | 3,048,744 | 598,194 |
| Mode SS | |||
|---|---|---|---|
| Quadrant | BADHDUFLAG | Total packets | Discarded packets |
| A | 0 | 122 | 0 |
| B | 0 | 122 | 0 |
| C | 0 | 122 | 0 |
| D | 0 | 122 | 0 |
| Mode M9 | |||
|---|---|---|---|
| Quadrant | BADHDUFLAG | Total packets | Discarded packets |
| A | 0 | 22 | 0 |
| B | 0 | 22 | 0 |
| C | 0 | 22 | 0 |
| D | 0 | 23 | 0 |
| Mode M0 | |||
|---|---|---|---|
| Quadrant | BADHDUFLAG | Total packets | Discarded packets |
| A | 0 | 12833 | 3 |
| B | 0 | 13362 | 2 |
| C | 0 | 12090 | 2 |
| D | 0 | 13345 | 2 |
| Quadrant | Total seconds | Saturated seconds | Saturation percentage |
|---|---|---|---|
| A | 5964 | 32 | 0.536553% |
| B | 5964 | 126 | 2.112676% |
| C | 5964 | 8 | 0.134138% |
| D | 5964 | 54 | 0.905433% |
Noise dominated data is calculated using 1-second bins in cleaned event files. If a bin has >2000 counts, and if more than 50% of those come from <1% of pixels, then it is considered to be noise-dominated and hence unusable.
| Quadrant | # 1 sec bins | Bins with >0 counts | Bins with >2000 counts | High rate bins dominated by noise | Noise dominated (total time) | Noise dominated (detector-on time) | Marked lightcurve |
|---|---|---|---|---|---|---|---|
| A | 7307 | 5965 | 19 | 19 | 0.26% | 0.32% | 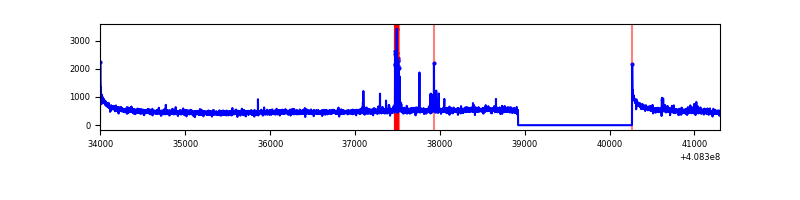 |
| B | 7307 | 5965 | 96 | 96 | 1.31% | 1.61% | 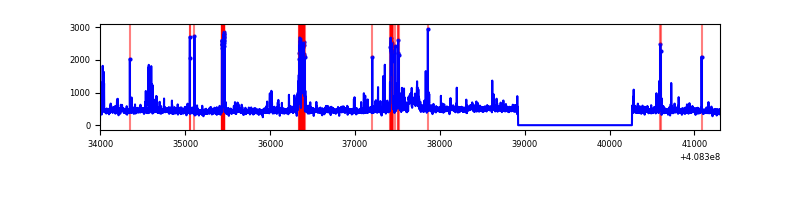 |
| C | 7307 | 5965 | 5 | 5 | 0.07% | 0.08% |  |
| D | 7307 | 5965 | 53 | 53 | 0.73% | 0.89% | 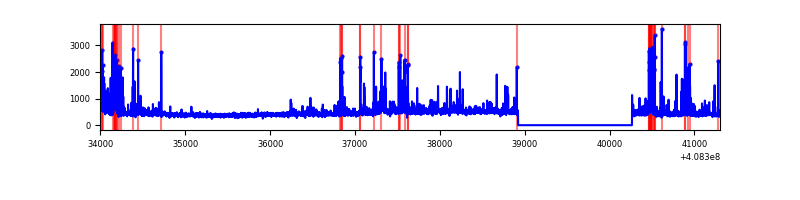 |
Top three noisy pixels from each quadrant. If the there are fewer than three noisy pixels in the level2.evt file, extra rows are filled as -1
| Pixel properties | Quadrant properties | ||||||
|---|---|---|---|---|---|---|---|
| Quadrant | DetID | PixID | Counts | Sigma | Mean | Median | Sigma |
| A | 10 | 83 | 446553 | 3374.78 | 651 | 633 | 132.1 |
| A | 13 | 248 | 80805 | 606.75 | 651 | 633 | 132.1 |
| A | 6 | 10 | 22654 | 166.66 | 651 | 633 | 132.1 |
| B | 5 | 172 | 328577 | 2644.88 | 644 | 625 | 124.0 |
| B | 0 | 190 | 201605 | 1620.87 | 644 | 625 | 124.0 |
| B | 0 | 155 | 61183 | 488.39 | 644 | 625 | 124.0 |
| C | 15 | 214 | 244531 | 1631.59 | 640 | 643 | 149.5 |
| C | 0 | 10 | 22063 | 143.29 | 640 | 643 | 149.5 |
| C | 14 | 254 | 15165 | 97.15 | 640 | 643 | 149.5 |
| D | 2 | 250 | 202377 | 1299.91 | 636 | 620 | 155.2 |
| D | 2 | 249 | 99888 | 639.58 | 636 | 620 | 155.2 |
| D | 13 | 249 | 80106 | 512.12 | 636 | 620 | 155.2 |
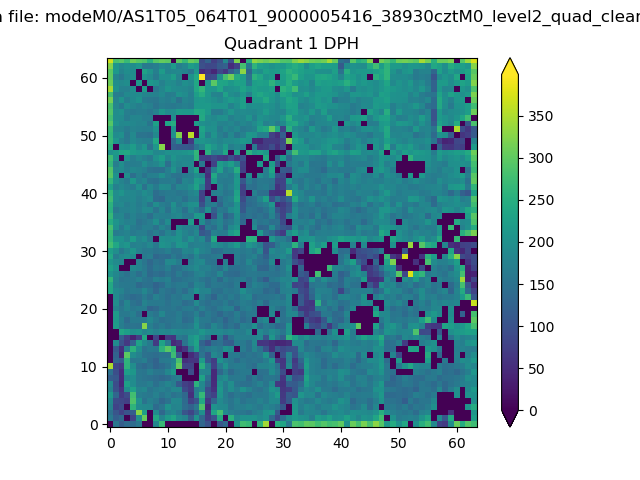
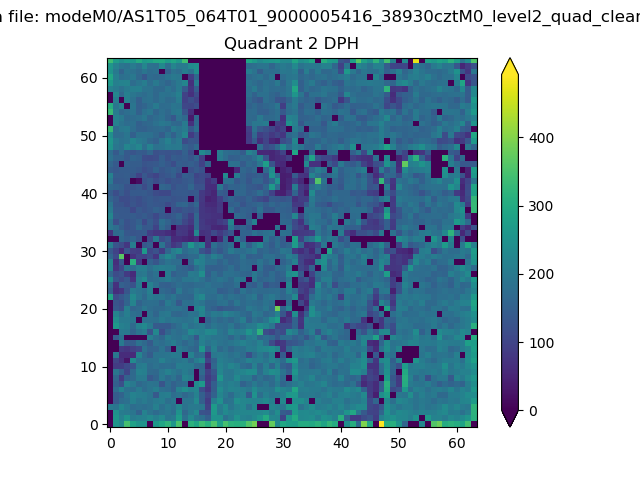
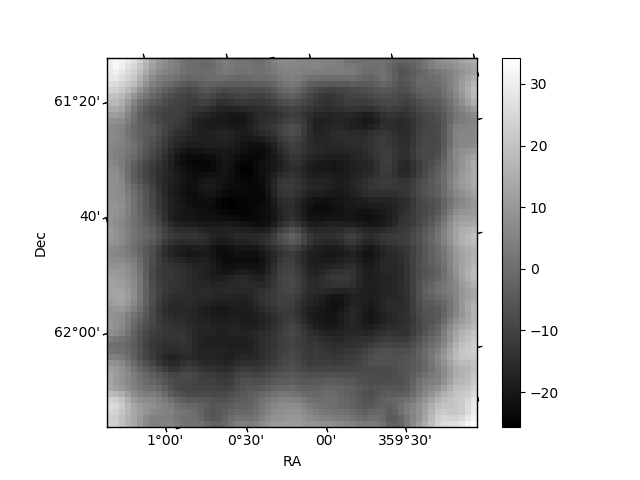
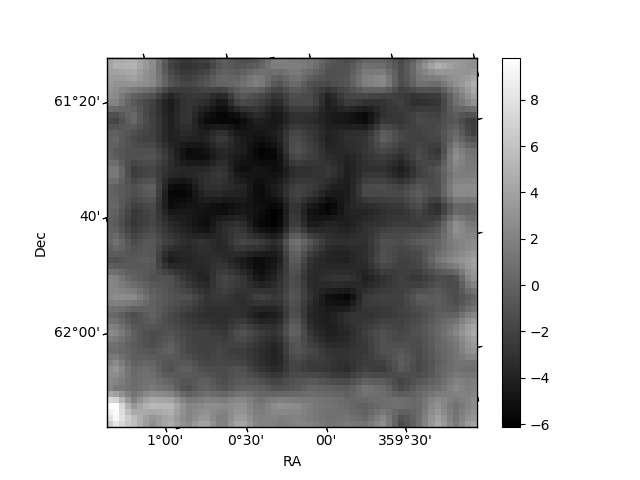
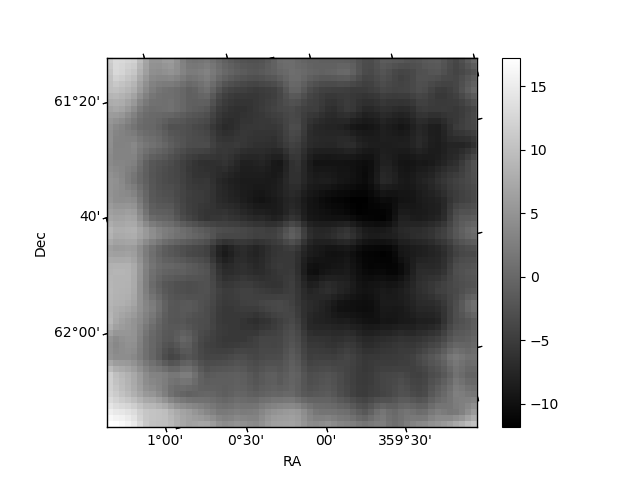
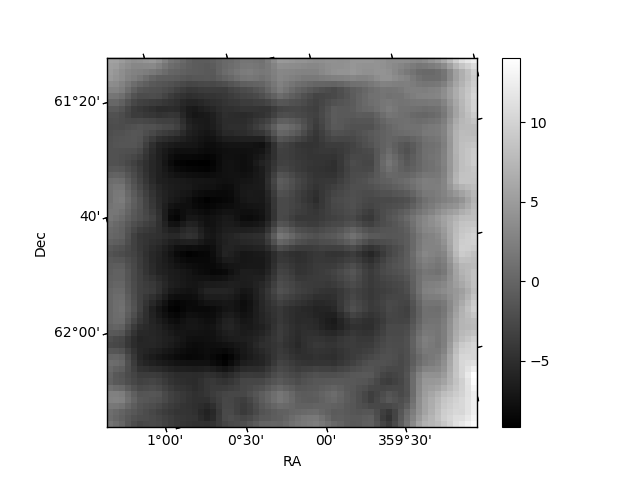
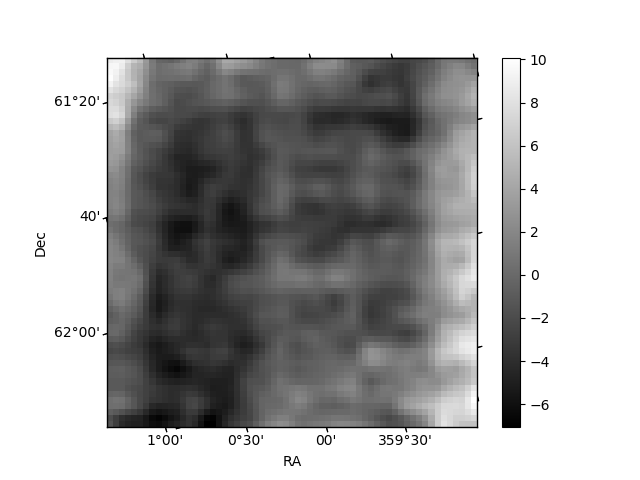
Histogram calculated using DETX and DETY for each event in the final _common_clean file
| Quadrant A | 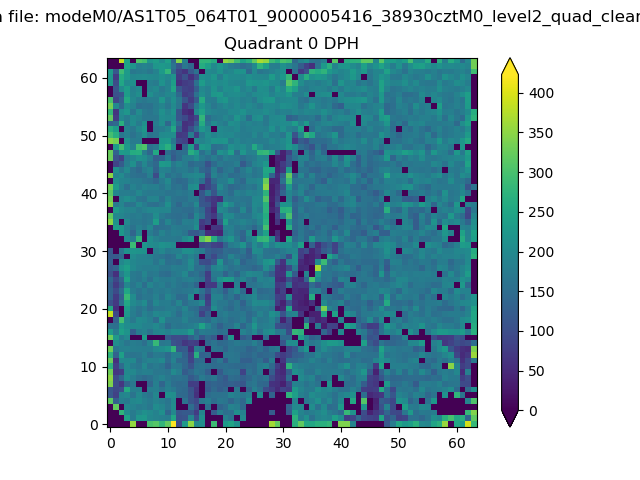 |
 |
Quadrant B |
|---|---|---|---|
| Quadrant D | 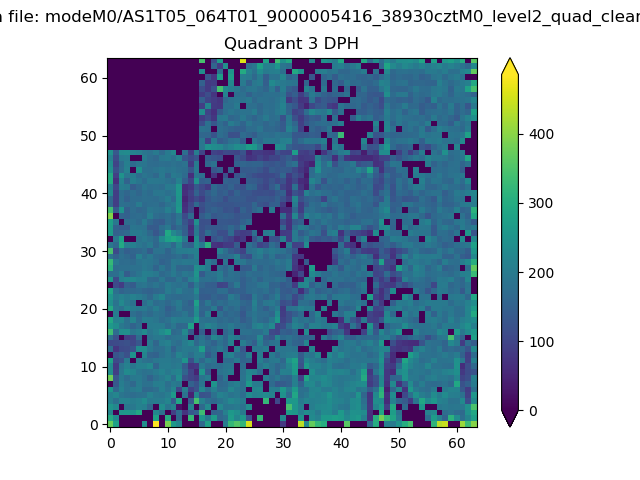 |
 |
Quadrant C |
| Plot type | Count rate plots | Images |
|---|---|---|
| Comparison with Poisson distribution Blue bars denote a histogram of data divided into 1 sec bins. Red curve is a Poisson curve with rate = median count rate of data. |
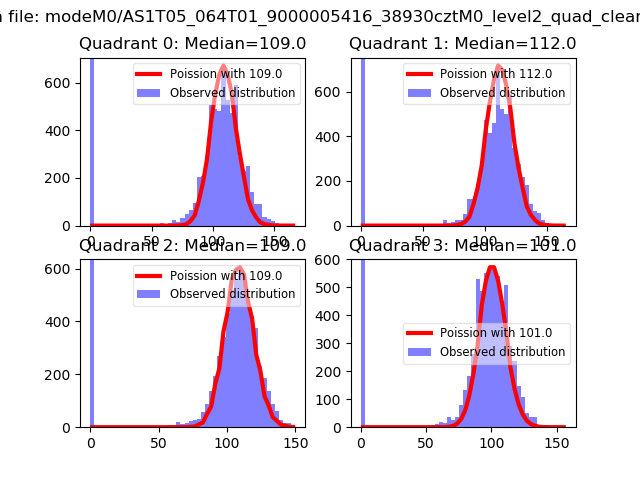 |
 |
| Quadrant-wise count rates Data is divided into 100 sec bins |
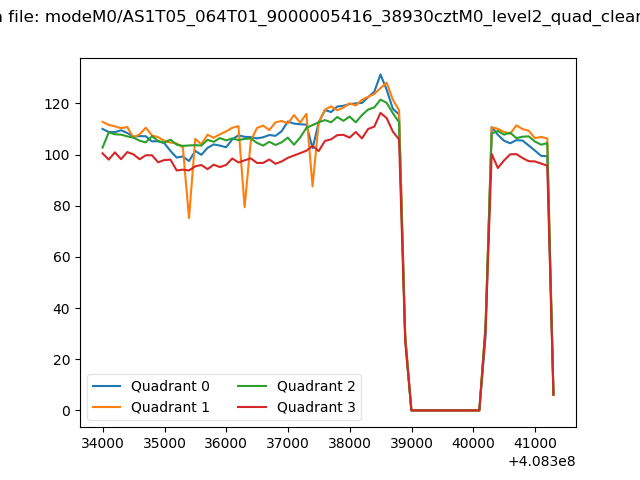 |
|
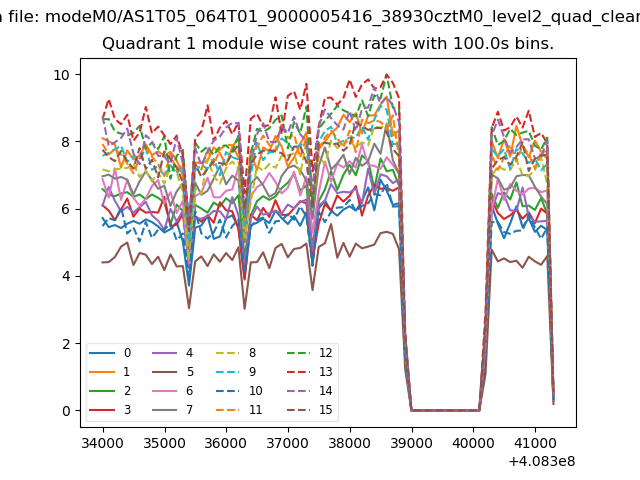
| Module-wise count rates for Quadrant A Data is divided into 100 sec bins |
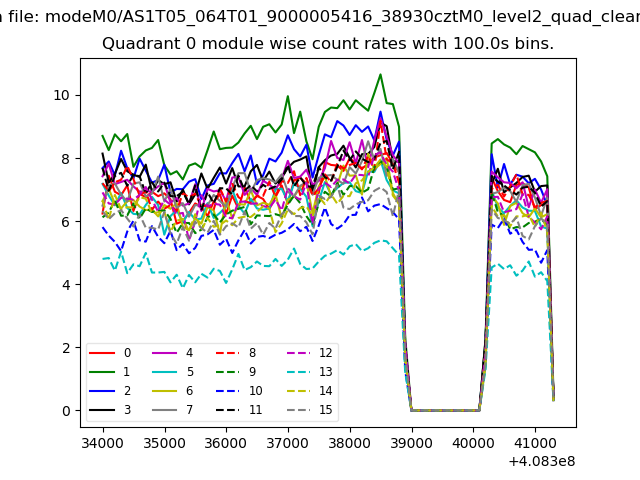 |
 |
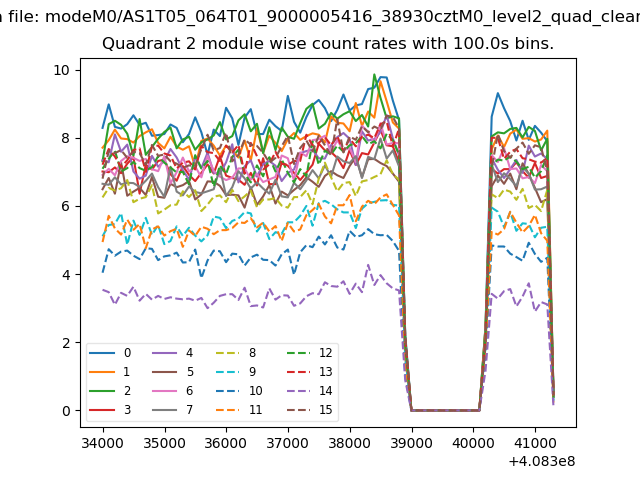
| Module-wise count rates for Quadrant B Data is divided into 100 sec bins |
 |
 |
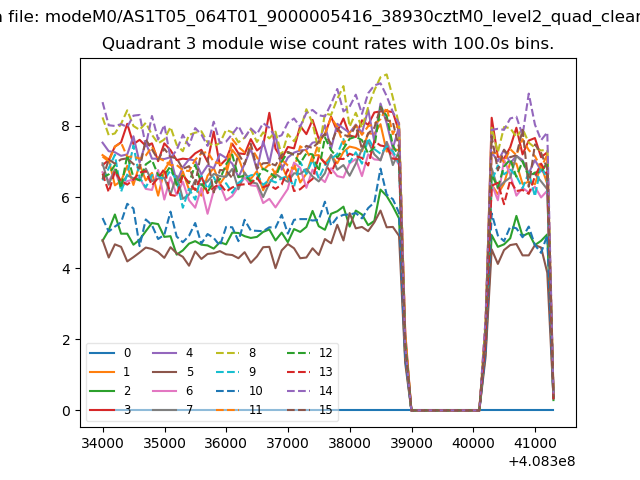
| Module-wise count rates for Quadrant C Data is divided into 100 sec bins |
 |
 |
| Module-wise count rates for Quadrant D Data is divided into 100 sec bins |
 |
 |
| Parameter | Plot |
|---|---|
| CZT HV Monitor | 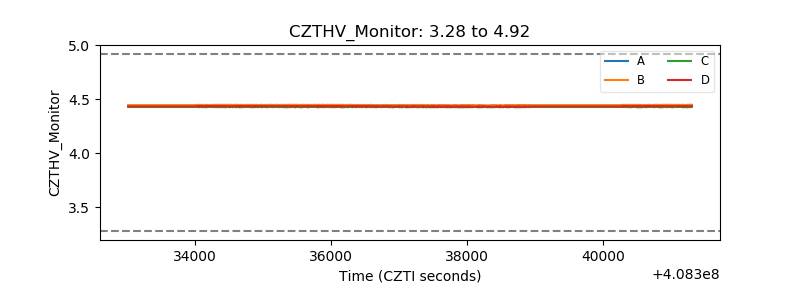 |
| D_VDD | 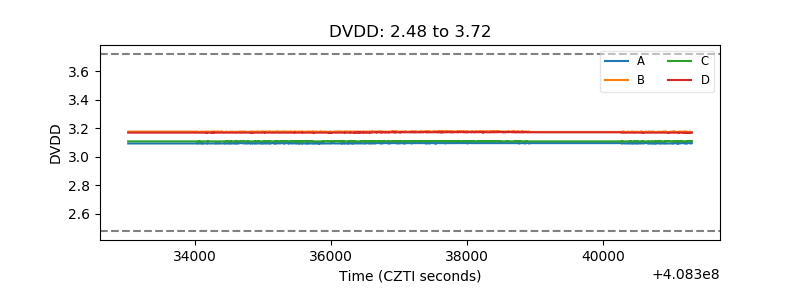 |
| Temperature 1 | 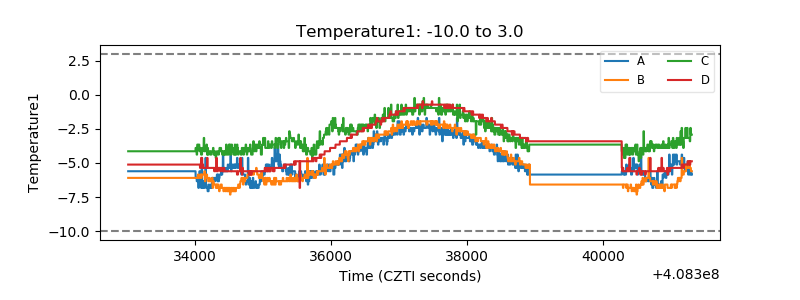 |
| Veto HV Monitor |  |
| Veto LLD | 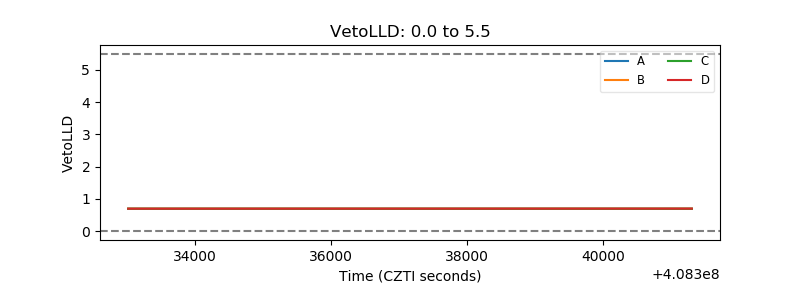 |
| Alpha Counter | 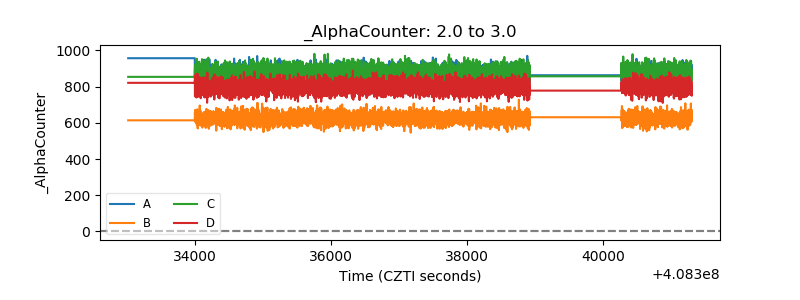 |
| _CPM_Rate | 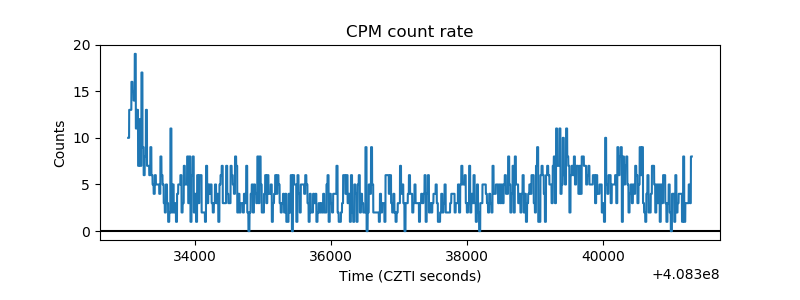 |
| CZT Counter | 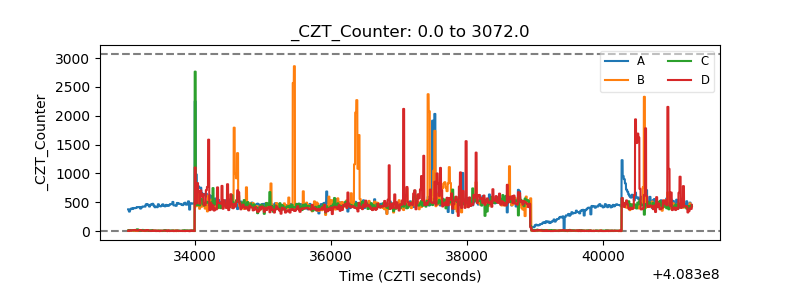 |
| +2.5 Volts monitor | 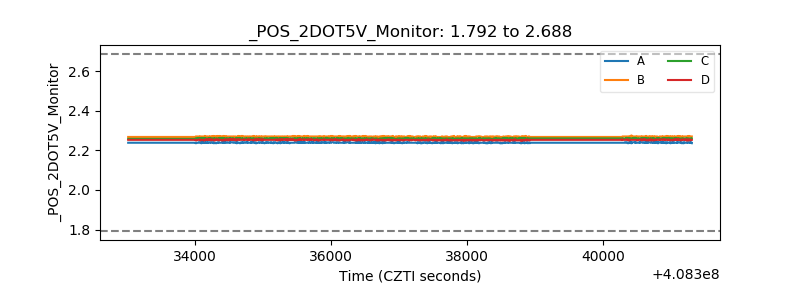 |
| +5 Volts monitor | 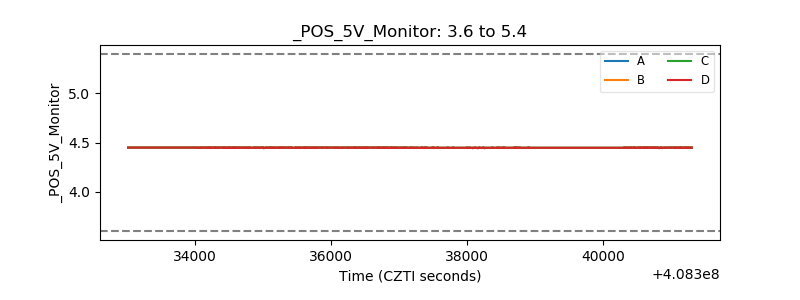 |
| _ROLL_ROT | 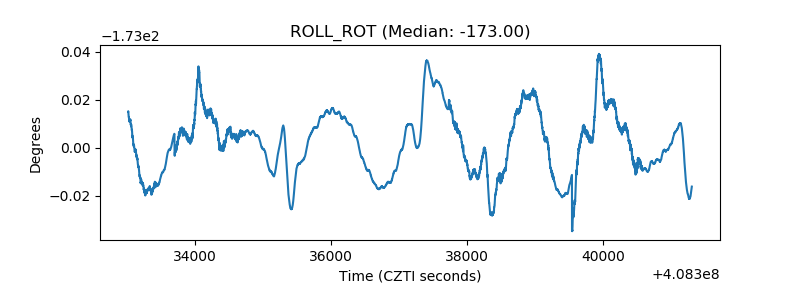 |
| _Roll_DEC | 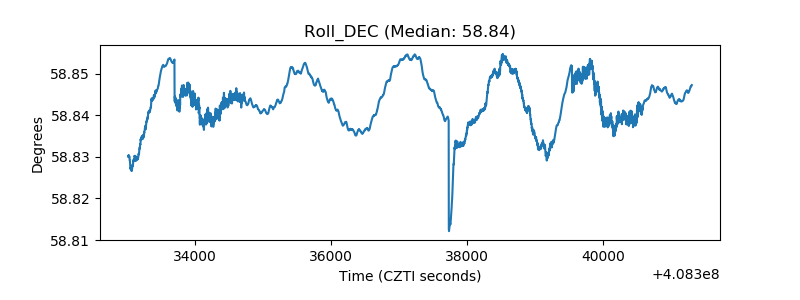 |
| _Roll_RA | 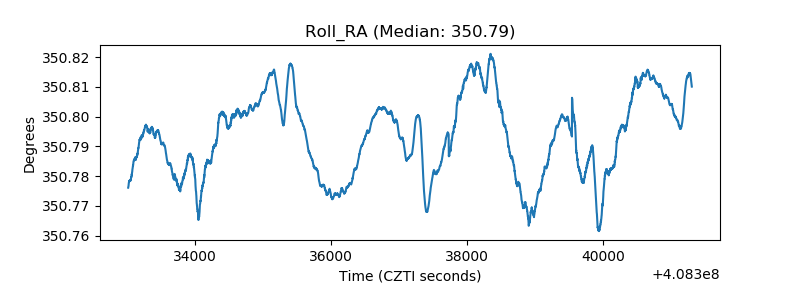 |
| Veto Counter | 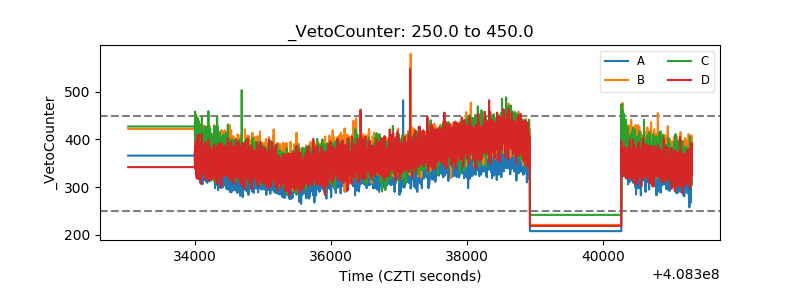 |