| Param | Original file | Final file |
|---|---|---|
| Filename | modeM0/AS1T05_064T01_9000005416_38931cztM0_level2.fits | modeM0/AS1T05_064T01_9000005416_38931cztM0_level2_quad_clean.evt |
| Size (bytes) | 429,048,000 | 100,555,200 |
| Size | 409.2 MB | 95.9 MB |
| Events in quadrant A | 3,320,890 | 685,653 |
| Events in quadrant B | 3,516,896 | 692,369 |
| Events in quadrant C | 2,947,854 | 684,028 |
| Events in quadrant D | 5,606,449 | 543,204 |
| Mode SS | |||
|---|---|---|---|
| Quadrant | BADHDUFLAG | Total packets | Discarded packets |
| A | 0 | 130 | 0 |
| B | 0 | 130 | 0 |
| C | 0 | 130 | 0 |
| D | 0 | 130 | 0 |
| Mode M9 | |||
|---|---|---|---|
| Quadrant | BADHDUFLAG | Total packets | Discarded packets |
| A | 0 | 26 | 0 |
| B | 0 | 26 | 0 |
| C | 0 | 26 | 0 |
| D | 0 | 26 | 0 |
| Mode M0 | |||
|---|---|---|---|
| Quadrant | BADHDUFLAG | Total packets | Discarded packets |
| A | 0 | 13602 | 3 |
| B | 0 | 14641 | 2 |
| C | 0 | 12677 | 2 |
| D | 0 | 20974 | 2 |
| Quadrant | Total seconds | Saturated seconds | Saturation percentage |
|---|---|---|---|
| A | 6294 | 29 | 0.460756% |
| B | 6294 | 193 | 3.066412% |
| C | 6294 | 5 | 0.079441% |
| D | 6294 | 977 | 15.522720% |
Noise dominated data is calculated using 1-second bins in cleaned event files. If a bin has >2000 counts, and if more than 50% of those come from <1% of pixels, then it is considered to be noise-dominated and hence unusable.
| Quadrant | # 1 sec bins | Bins with >0 counts | Bins with >2000 counts | High rate bins dominated by noise | Noise dominated (total time) | Noise dominated (detector-on time) | Marked lightcurve |
|---|---|---|---|---|---|---|---|
| A | 8919 | 6296 | 20 | 20 | 0.22% | 0.32% | 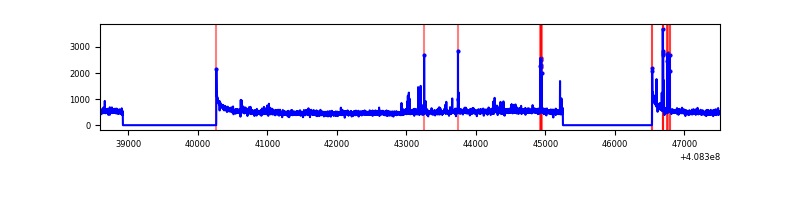 |
| B | 8919 | 6296 | 151 | 151 | 1.69% | 2.40% | 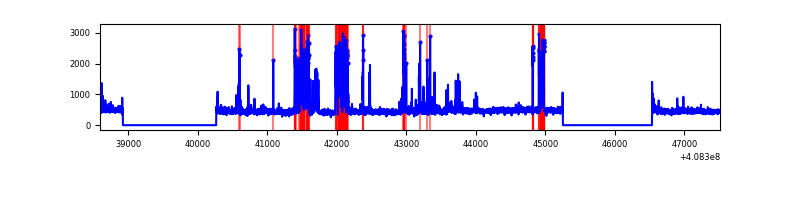 |
| C | 8919 | 6296 | 1 | 1 | 0.01% | 0.02% | 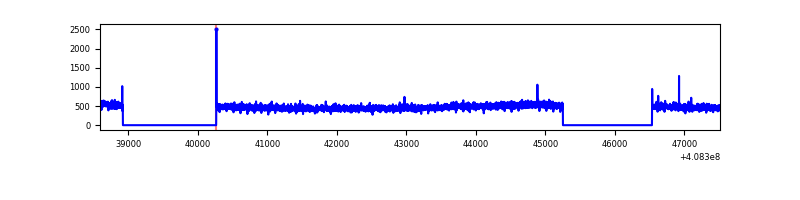 |
| D | 8919 | 6295 | 925 | 925 | 10.37% | 14.69% | 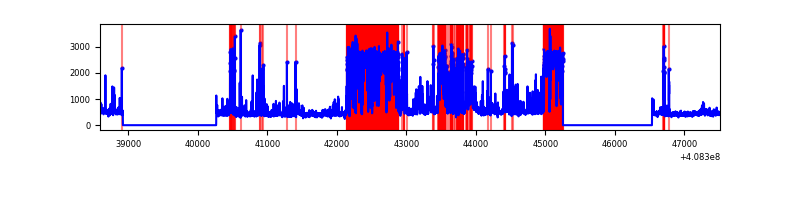 |
Top three noisy pixels from each quadrant. If the there are fewer than three noisy pixels in the level2.evt file, extra rows are filled as -1
| Pixel properties | Quadrant properties | ||||||
|---|---|---|---|---|---|---|---|
| Quadrant | DetID | PixID | Counts | Sigma | Mean | Median | Sigma |
| A | 10 | 83 | 467571 | 3320.7 | 697 | 682 | 140.6 |
| A | 13 | 248 | 68011 | 478.87 | 697 | 682 | 140.6 |
| A | 6 | 10 | 41402 | 289.62 | 697 | 682 | 140.6 |
| B | 5 | 172 | 695700 | 5223.4 | 687 | 667 | 133.1 |
| B | 0 | 190 | 50839 | 377.06 | 687 | 667 | 133.1 |
| B | 0 | 155 | 34318 | 252.89 | 687 | 667 | 133.1 |
| C | 15 | 214 | 258302 | 1615.76 | 685 | 689 | 159.4 |
| C | 0 | 10 | 7316 | 41.56 | 685 | 689 | 159.4 |
| C | 13 | 61 | 4617 | 24.64 | 685 | 689 | 159.4 |
| D | 2 | 250 | 2559299 | 16758.32 | 624 | 604 | 152.7 |
| D | 12 | 227 | 269753 | 1762.81 | 624 | 604 | 152.7 |
| D | 2 | 153 | 101828 | 662.97 | 624 | 604 | 152.7 |
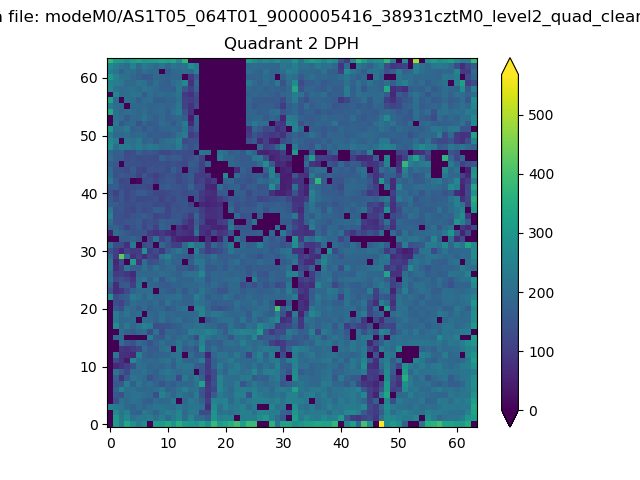
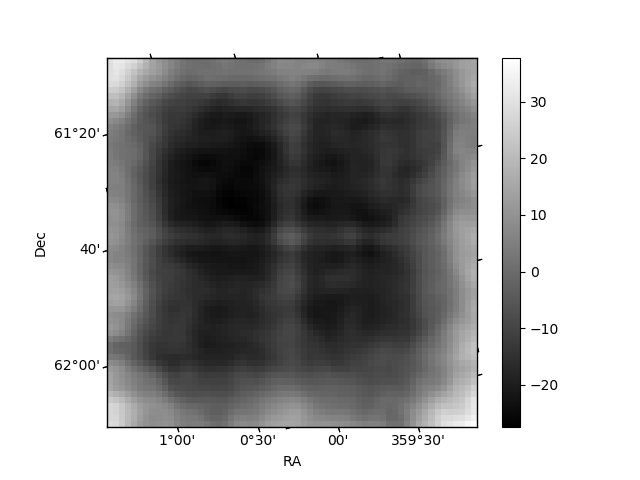
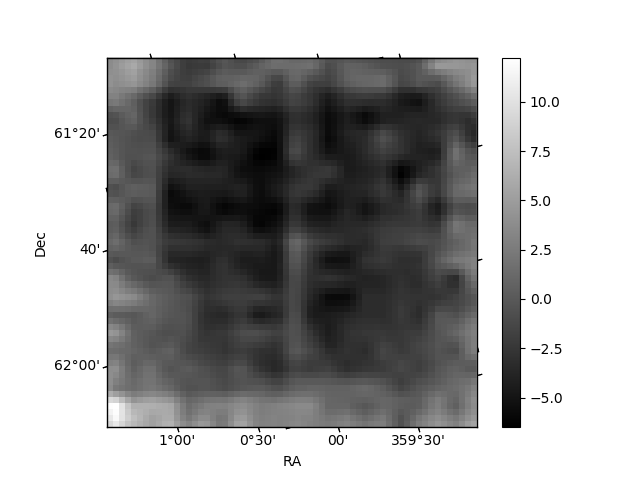
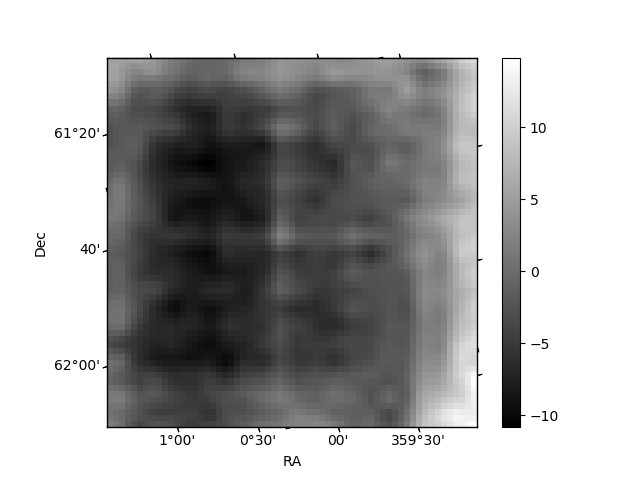
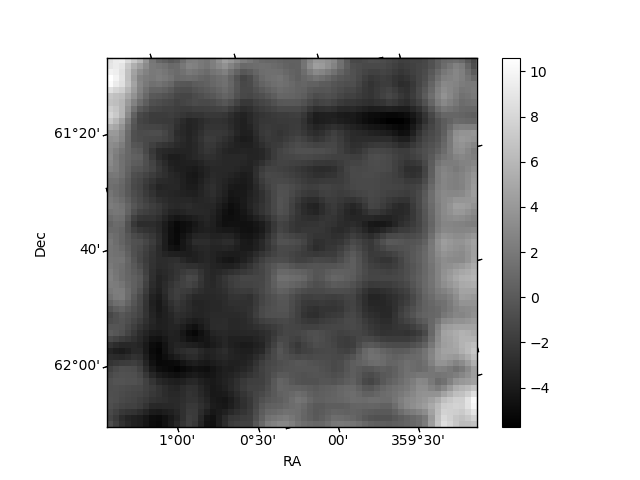
Histogram calculated using DETX and DETY for each event in the final _common_clean file
| Quadrant A | 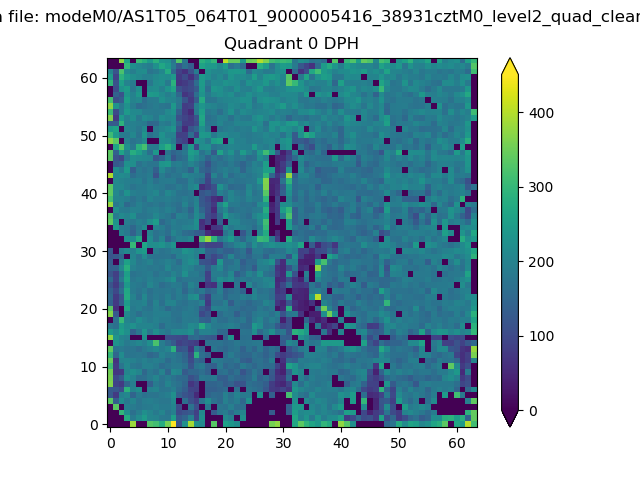 |
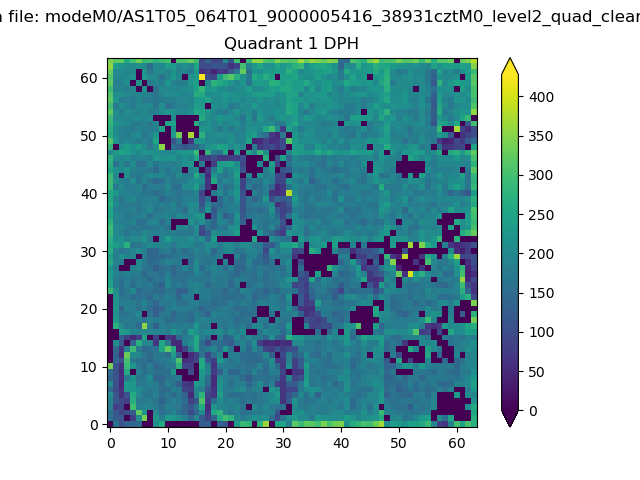 |
Quadrant B |
|---|---|---|---|
| Quadrant D | 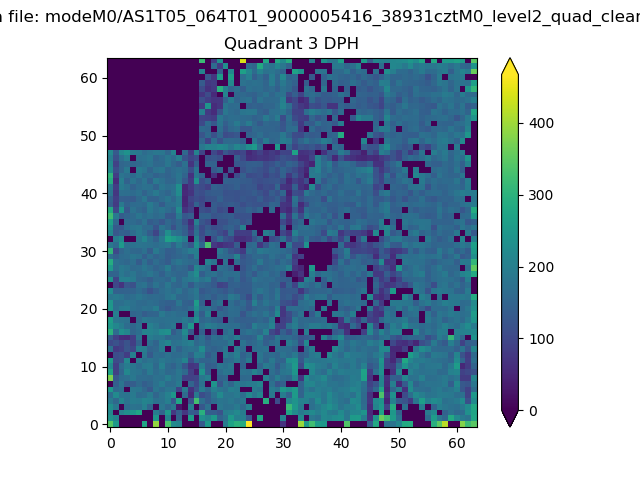 |
 |
Quadrant C |
| Plot type | Count rate plots | Images |
|---|---|---|
| Comparison with Poisson distribution Blue bars denote a histogram of data divided into 1 sec bins. Red curve is a Poisson curve with rate = median count rate of data. |
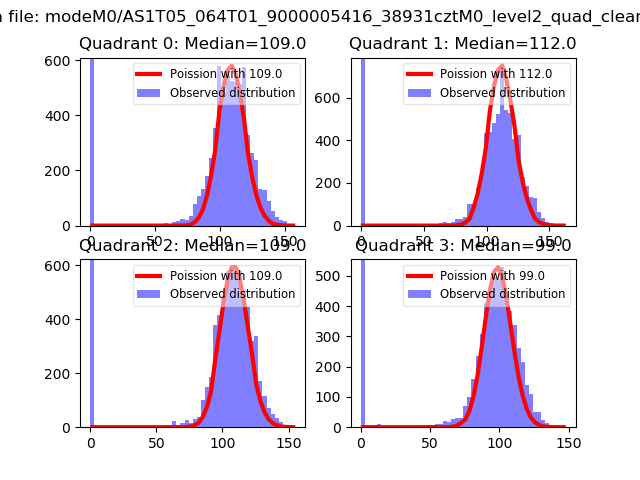 |
 |
| Quadrant-wise count rates Data is divided into 100 sec bins |
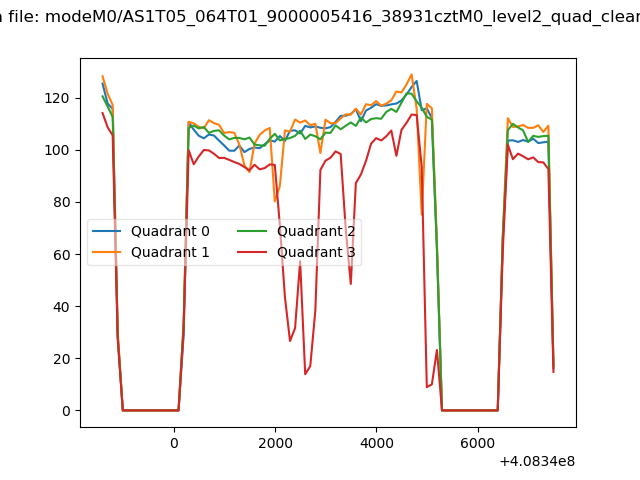 |
|
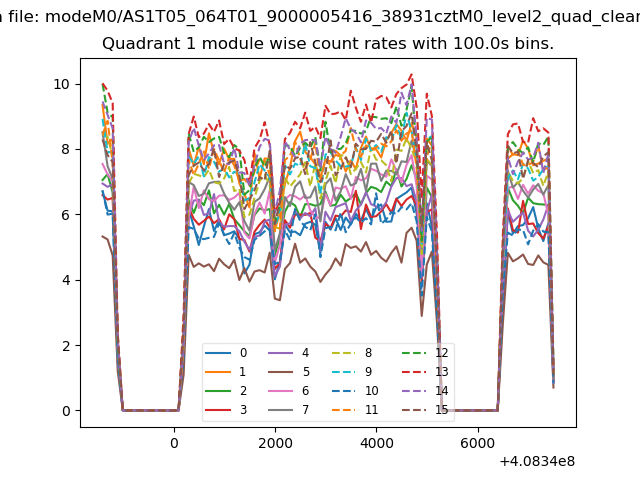
| Module-wise count rates for Quadrant A Data is divided into 100 sec bins |
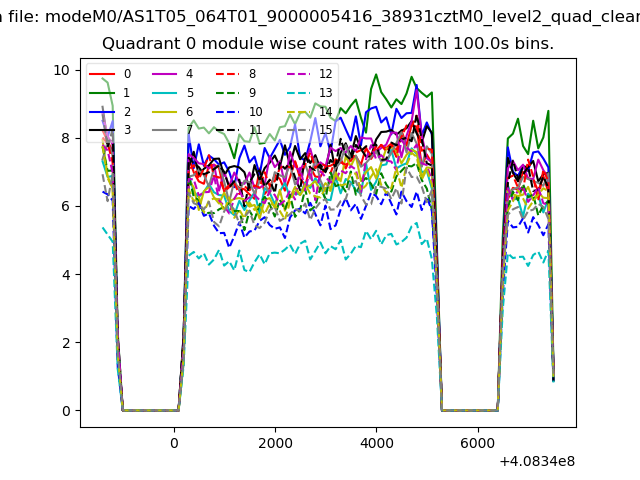 |
 |
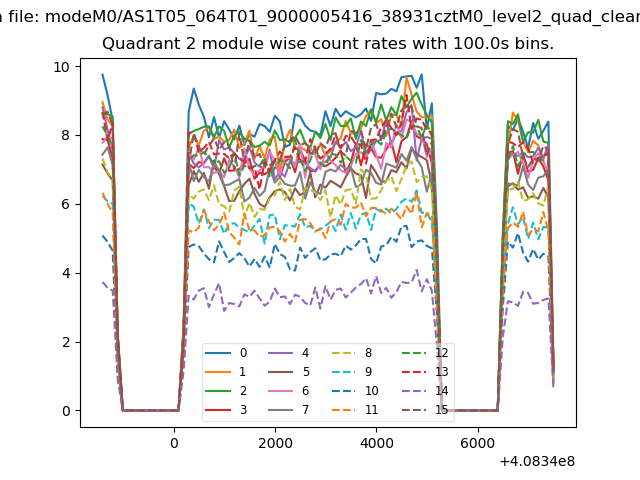
| Module-wise count rates for Quadrant B Data is divided into 100 sec bins |
 |
 |
| Module-wise count rates for Quadrant C Data is divided into 100 sec bins |
 |
 |
| Module-wise count rates for Quadrant D Data is divided into 100 sec bins |
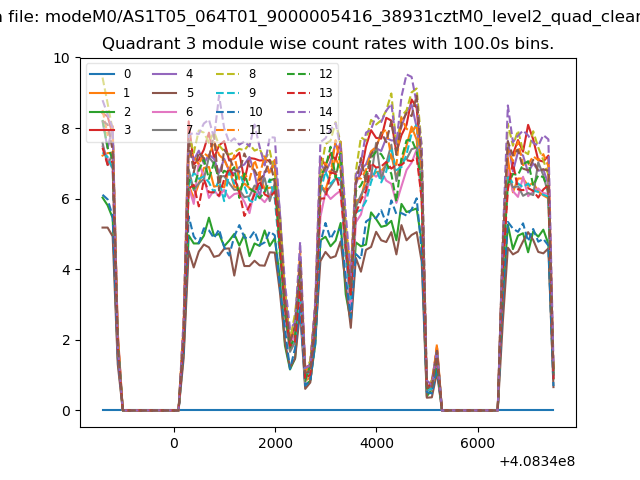 |
 |
| Parameter | Plot |
|---|---|
| CZT HV Monitor | 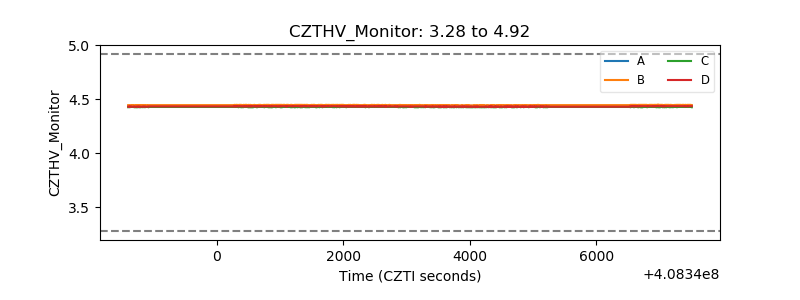 |
| D_VDD | 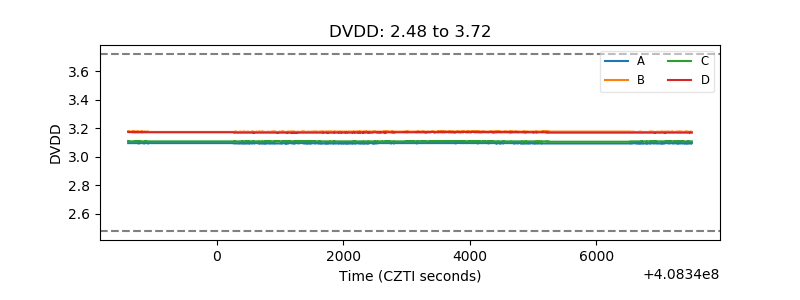 |
| Temperature 1 | 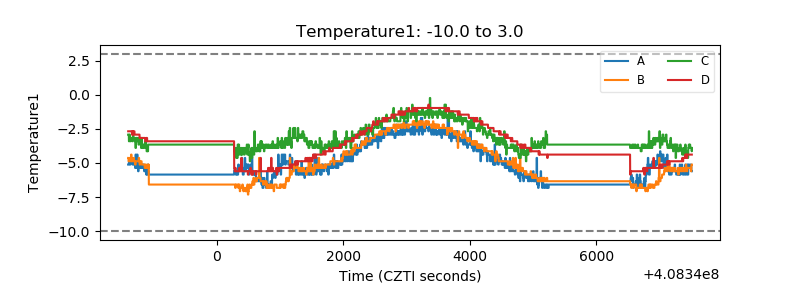 |
| Veto HV Monitor | 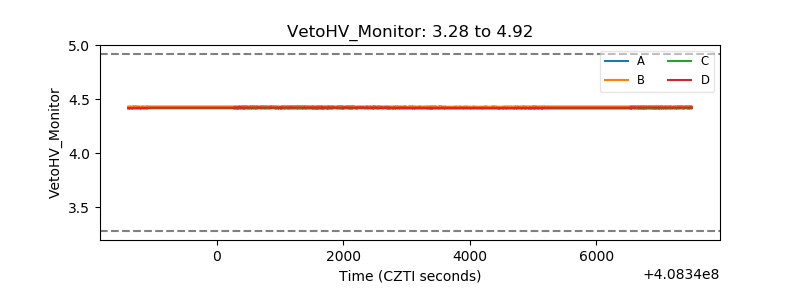 |
| Veto LLD | 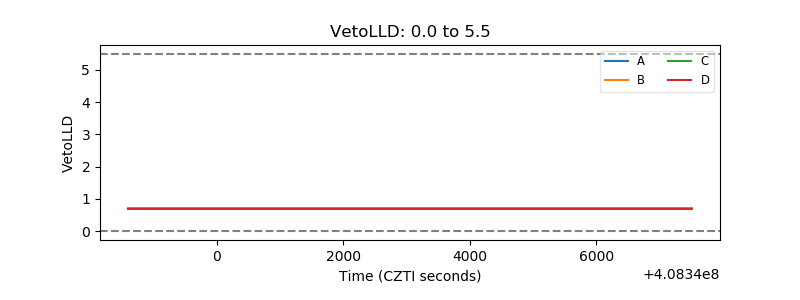 |
| Alpha Counter | 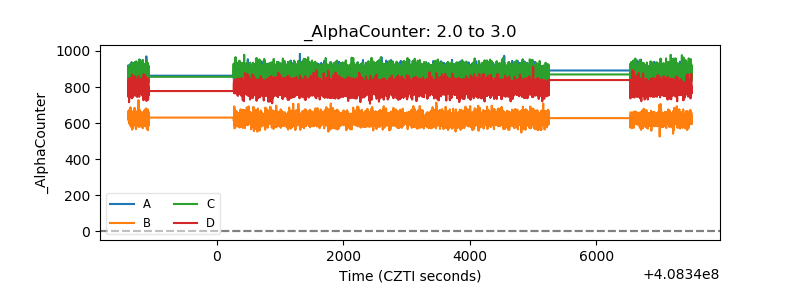 |
| _CPM_Rate | 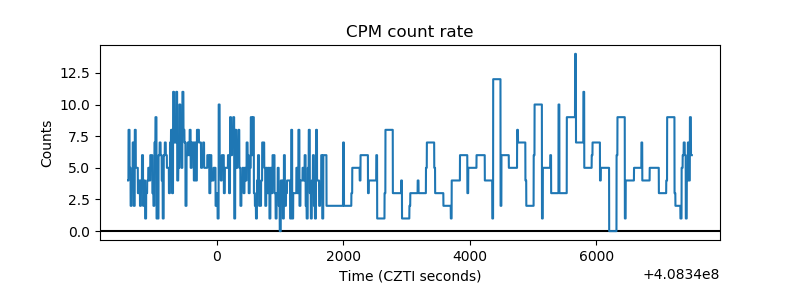 |
| CZT Counter | 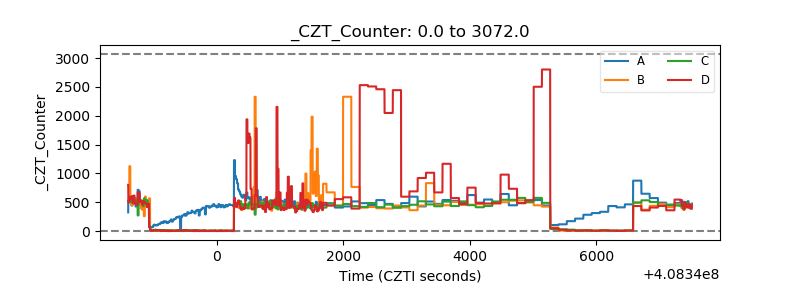 |
| +2.5 Volts monitor | 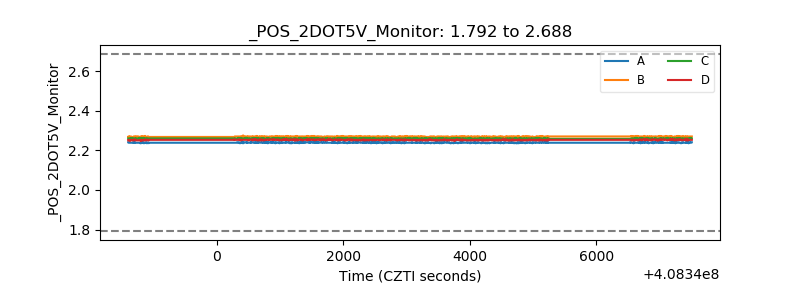 |
| +5 Volts monitor | 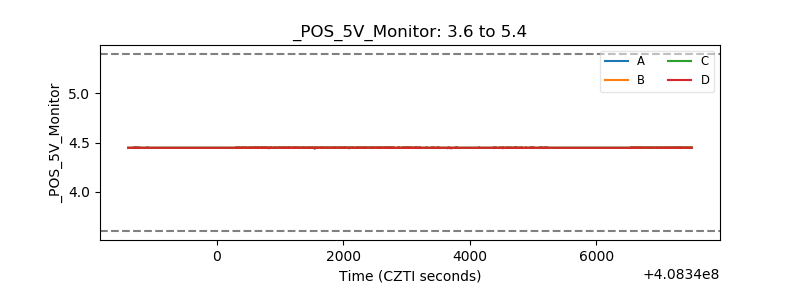 |
| _ROLL_ROT | 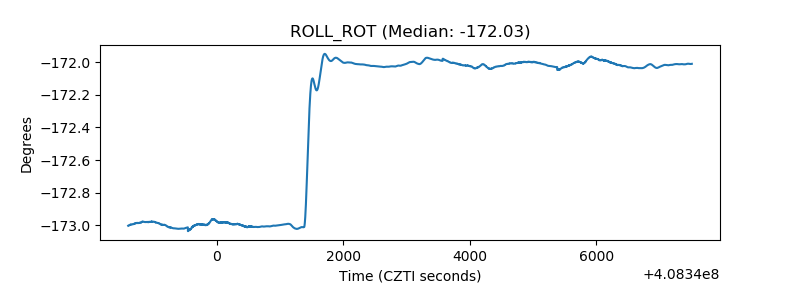 |
| _Roll_DEC | 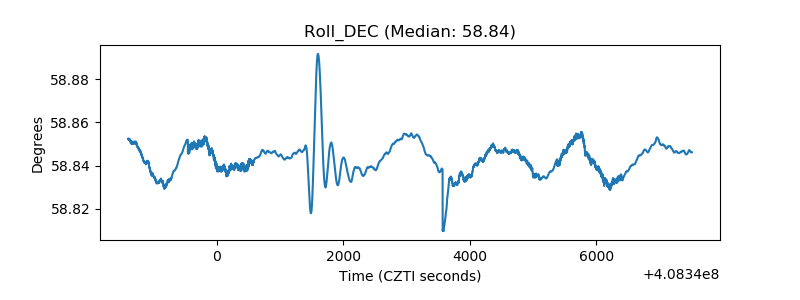 |
| _Roll_RA | 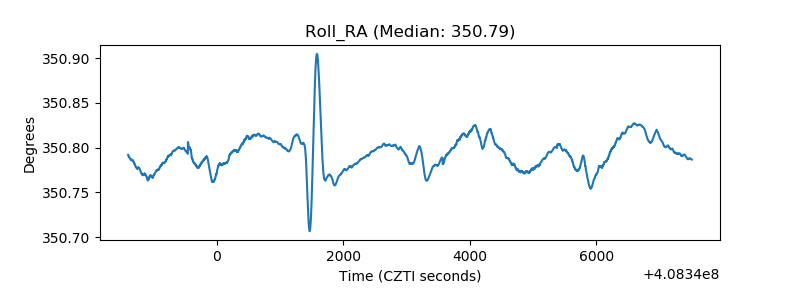 |
| Veto Counter |  |