| Param | Original file | Final file |
|---|---|---|
| Filename | modeM0/AS1T05_064T01_9000005416_38933cztM0_level2.fits | modeM0/AS1T05_064T01_9000005416_38933cztM0_level2_quad_clean.evt |
| Size (bytes) | 686,168,640 | 175,608,000 |
| Size | 654.4 MB | 167.5 MB |
| Events in quadrant A | 5,674,907 | 1,176,224 |
| Events in quadrant B | 5,486,274 | 1,206,592 |
| Events in quadrant C | 5,075,068 | 1,159,787 |
| Events in quadrant D | 8,320,908 | 1,021,771 |
| Mode SS | |||
|---|---|---|---|
| Quadrant | BADHDUFLAG | Total packets | Discarded packets |
| A | 0 | 222 | 0 |
| B | 0 | 222 | 0 |
| C | 0 | 222 | 0 |
| D | 0 | 222 | 0 |
| Mode M9 | |||
|---|---|---|---|
| Quadrant | BADHDUFLAG | Total packets | Discarded packets |
| A | 0 | 35 | 0 |
| B | 0 | 35 | 0 |
| C | 0 | 35 | 0 |
| D | 0 | 36 | 0 |
| Mode M0 | |||
|---|---|---|---|
| Quadrant | BADHDUFLAG | Total packets | Discarded packets |
| A | 0 | 23326 | 12 |
| B | 0 | 23588 | 13 |
| C | 0 | 21947 | 14 |
| D | 0 | 32114 | 14 |
| Quadrant | Total seconds | Saturated seconds | Saturation percentage |
|---|---|---|---|
| A | 10869 | 36 | 0.331217% |
| B | 10867 | 95 | 0.874206% |
| C | 10866 | 12 | 0.110436% |
| D | 10870 | 593 | 5.455382% |
Noise dominated data is calculated using 1-second bins in cleaned event files. If a bin has >2000 counts, and if more than 50% of those come from <1% of pixels, then it is considered to be noise-dominated and hence unusable.
| Quadrant | # 1 sec bins | Bins with >0 counts | Bins with >2000 counts | High rate bins dominated by noise | Noise dominated (total time) | Noise dominated (detector-on time) | Marked lightcurve |
|---|---|---|---|---|---|---|---|
| A | 13649 | 10874 | 22 | 22 | 0.16% | 0.20% | 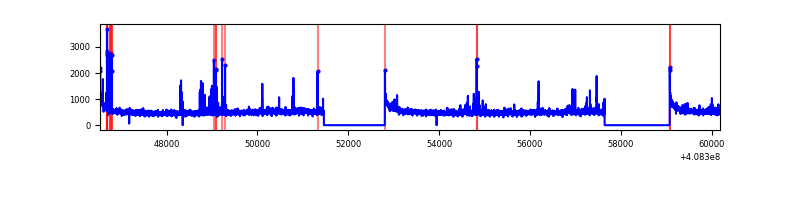 |
| B | 13649 | 10873 | 63 | 63 | 0.46% | 0.58% | 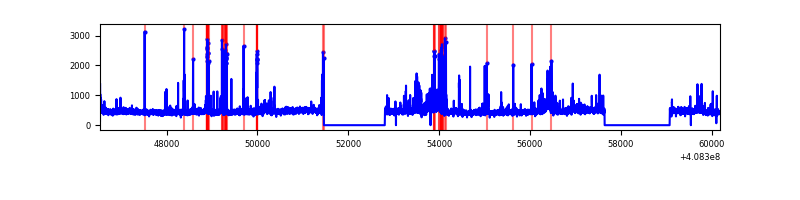 |
| C | 13649 | 10873 | 6 | 6 | 0.04% | 0.06% | 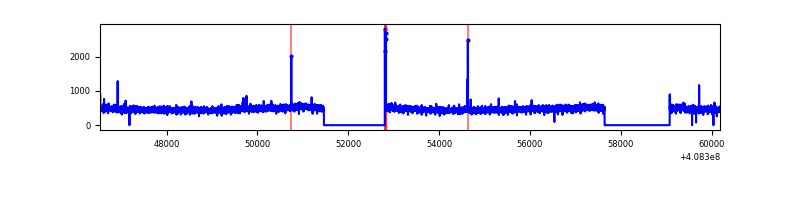 |
| D | 13649 | 10875 | 574 | 574 | 4.21% | 5.28% | 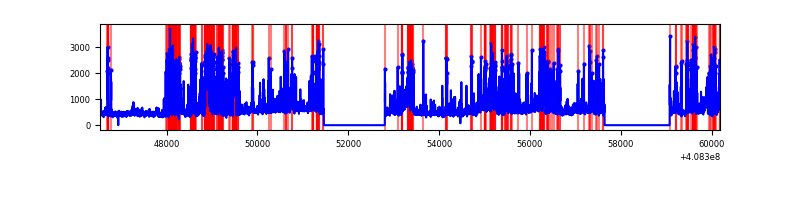 |
Top three noisy pixels from each quadrant. If the there are fewer than three noisy pixels in the level2.evt file, extra rows are filled as -1
| Pixel properties | Quadrant properties | ||||||
|---|---|---|---|---|---|---|---|
| Quadrant | DetID | PixID | Counts | Sigma | Mean | Median | Sigma |
| A | 10 | 83 | 774892 | 3190.18 | 1206 | 1182 | 242.5 |
| A | 13 | 248 | 118538 | 483.89 | 1206 | 1182 | 242.5 |
| A | 6 | 10 | 100042 | 407.62 | 1206 | 1182 | 242.5 |
| B | 5 | 184 | 249374 | 1081.04 | 1192 | 1156 | 229.6 |
| B | 5 | 172 | 230566 | 999.12 | 1192 | 1156 | 229.6 |
| B | 0 | 190 | 121281 | 523.17 | 1192 | 1156 | 229.6 |
| C | 15 | 214 | 441277 | 1626.35 | 1175 | 1183 | 270.6 |
| C | 10 | 70 | 12062 | 40.2 | 1175 | 1183 | 270.6 |
| C | 1 | 23 | 8857 | 28.36 | 1175 | 1183 | 270.6 |
| D | 2 | 250 | 1545681 | 5561.74 | 1149 | 1115 | 277.7 |
| D | 12 | 227 | 880956 | 3168.17 | 1149 | 1115 | 277.7 |
| D | 2 | 16 | 404043 | 1450.88 | 1149 | 1115 | 277.7 |
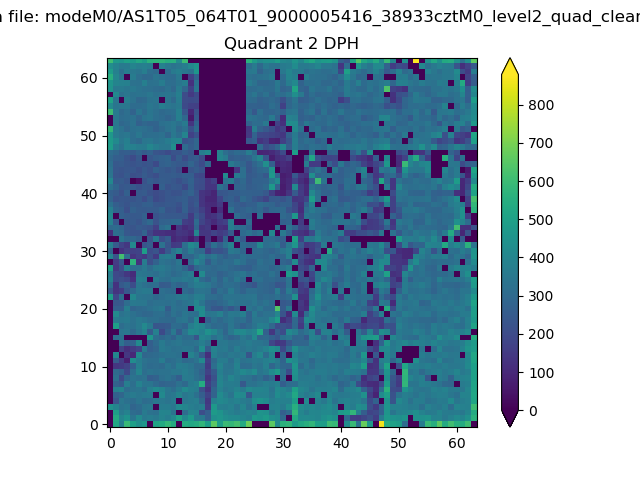
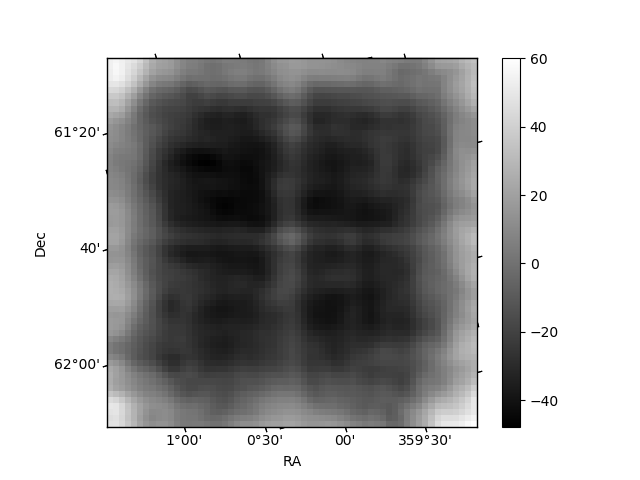
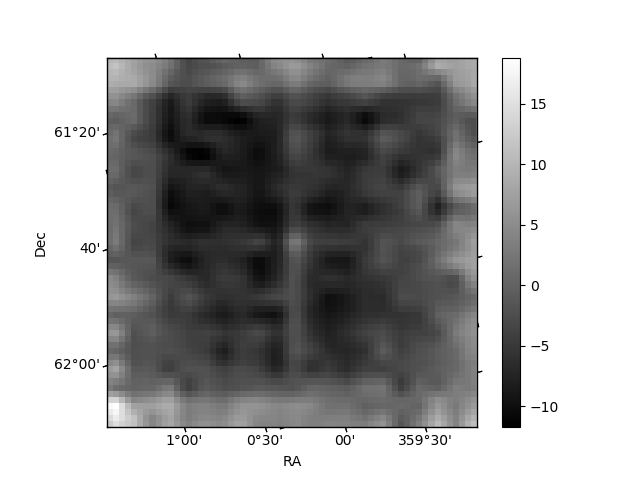
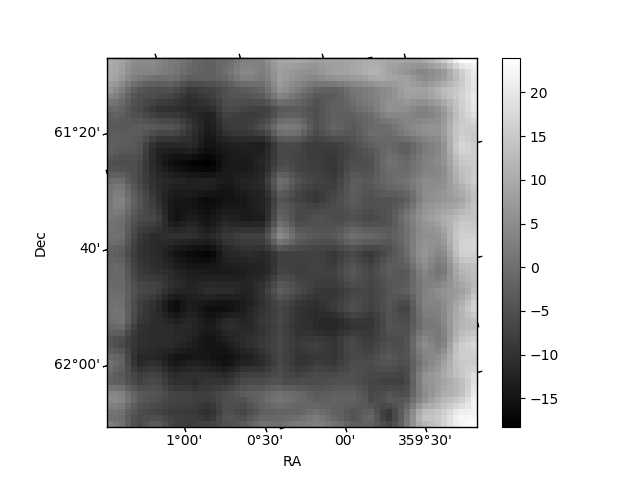
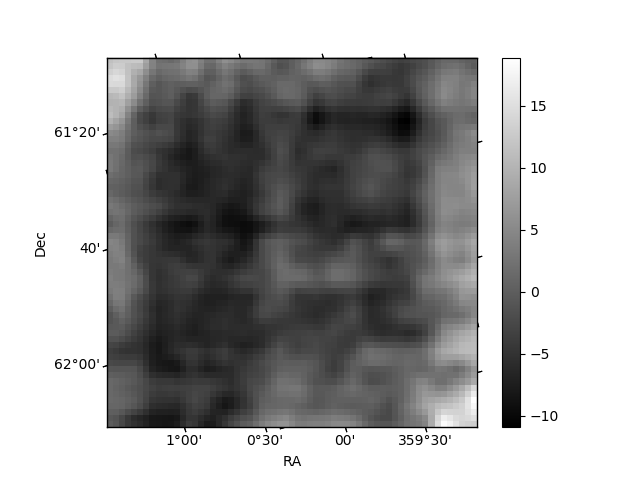
Histogram calculated using DETX and DETY for each event in the final _common_clean file
| Quadrant A | 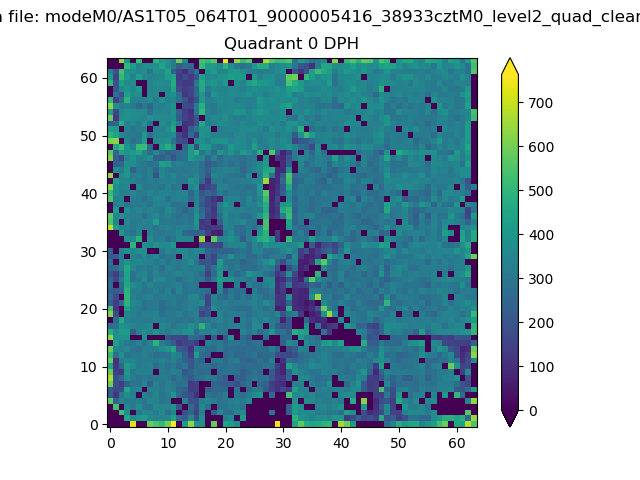 |
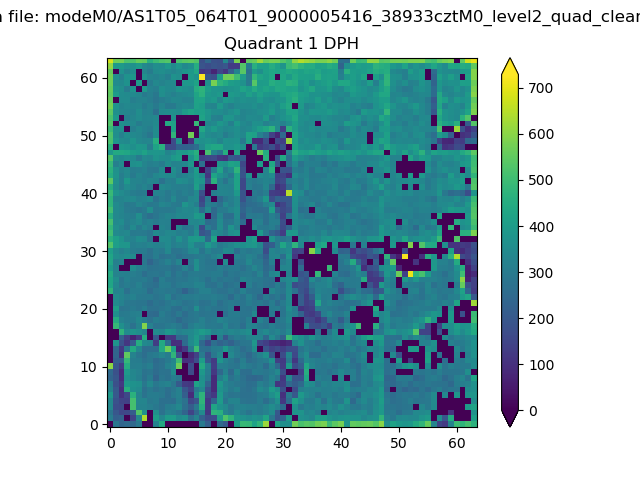 |
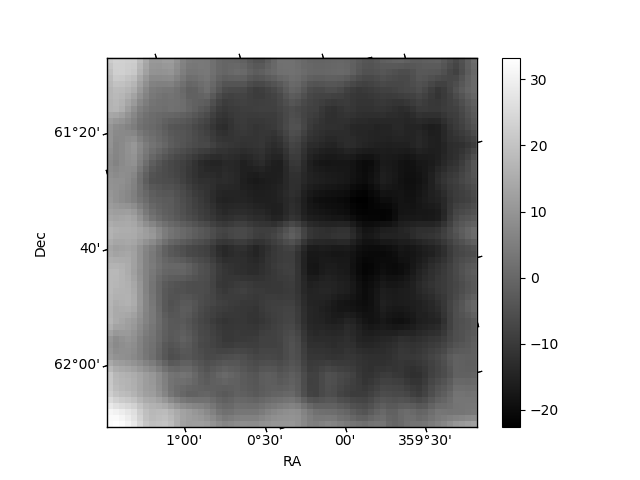
Quadrant B |
|---|---|---|---|
| Quadrant D | 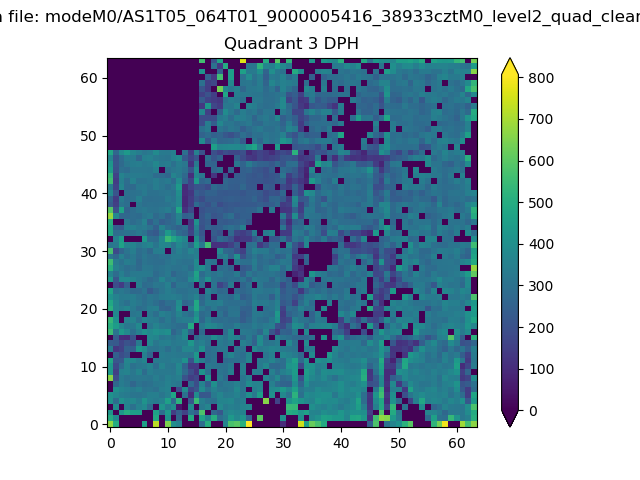 |
 |
Quadrant C |
| Plot type | Count rate plots | Images |
|---|---|---|
| Comparison with Poisson distribution Blue bars denote a histogram of data divided into 1 sec bins. Red curve is a Poisson curve with rate = median count rate of data. |
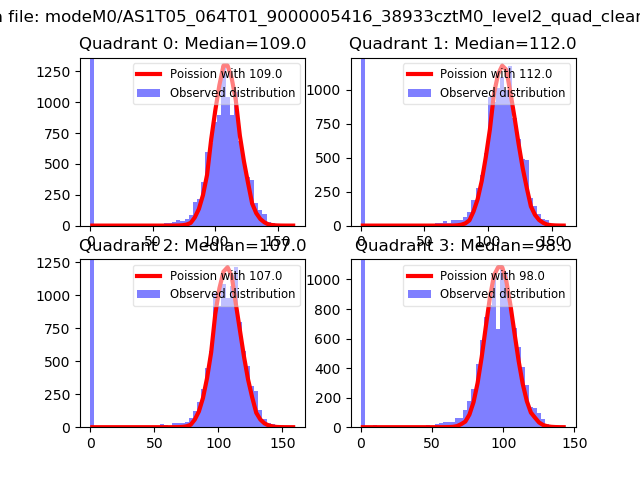 |
 |
| Quadrant-wise count rates Data is divided into 100 sec bins |
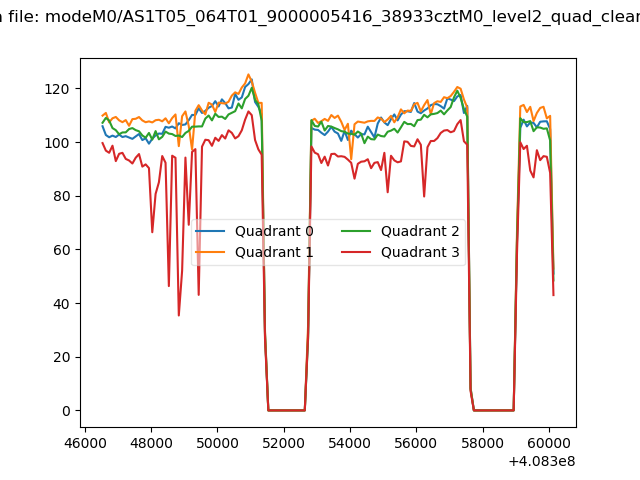 |
|
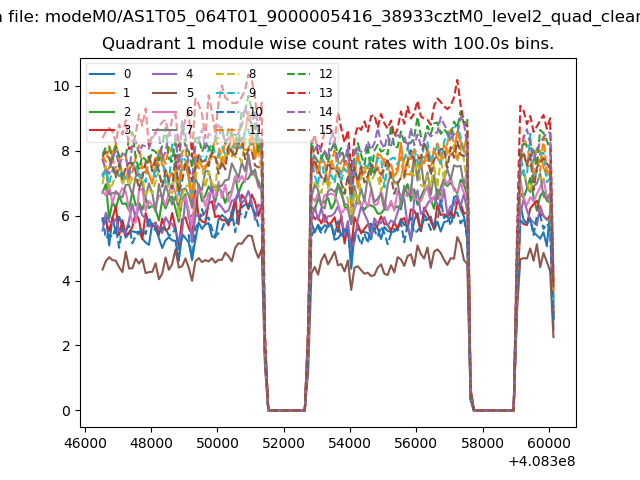
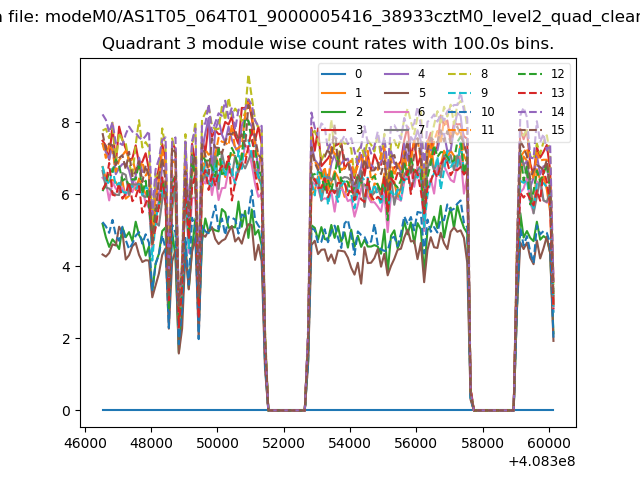
| Module-wise count rates for Quadrant A Data is divided into 100 sec bins |
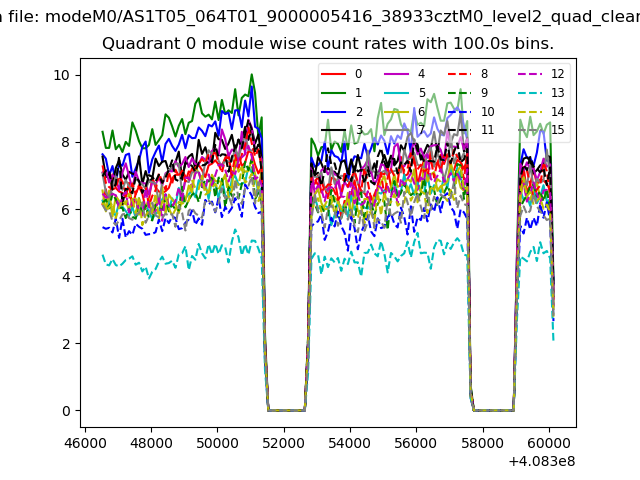 |
 |
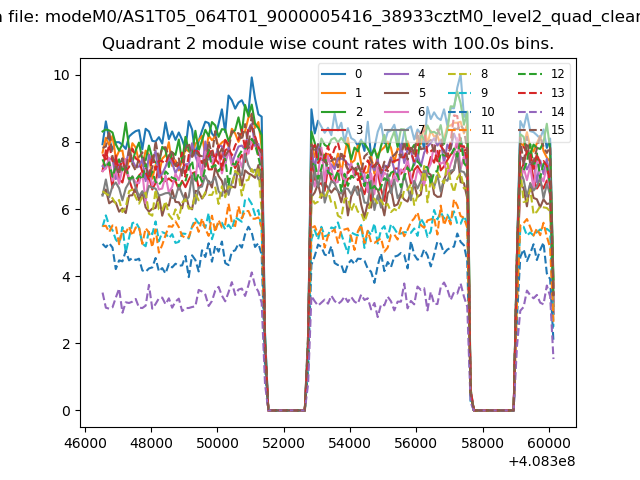
| Module-wise count rates for Quadrant B Data is divided into 100 sec bins |
 |
 |
| Module-wise count rates for Quadrant C Data is divided into 100 sec bins |
 |
 |
| Module-wise count rates for Quadrant D Data is divided into 100 sec bins |
 |
 |
| Parameter | Plot |
|---|---|
| CZT HV Monitor | 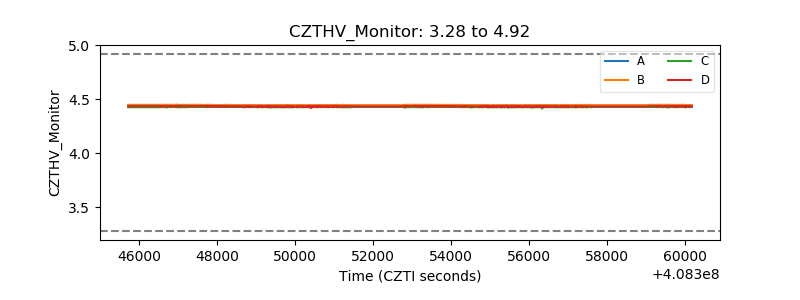 |
| D_VDD | 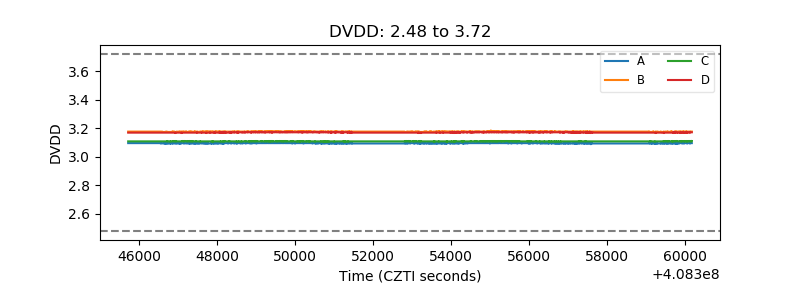 |
| Temperature 1 | 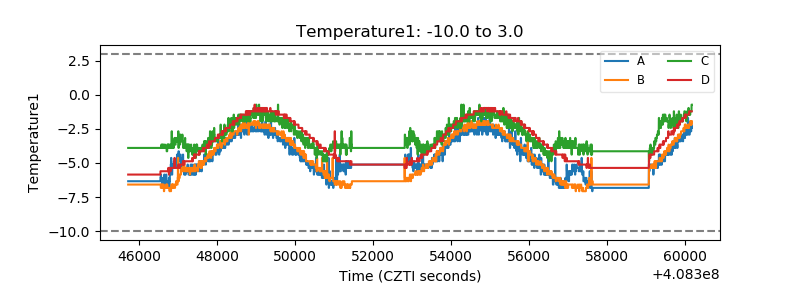 |
| Veto HV Monitor | 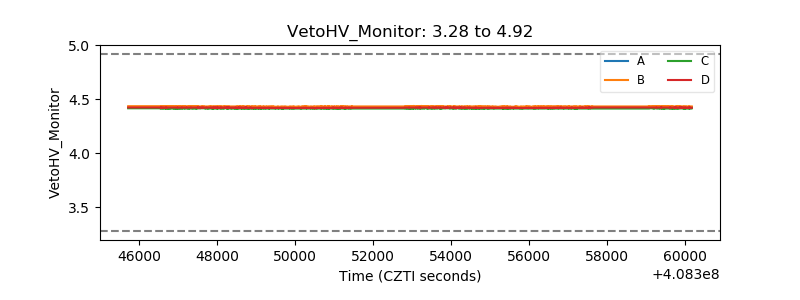 |
| Veto LLD | 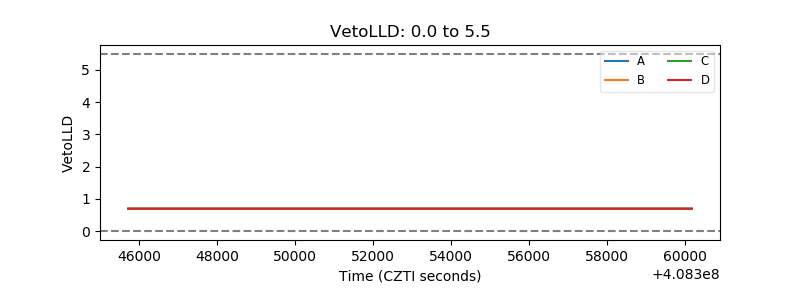 |
| Alpha Counter | 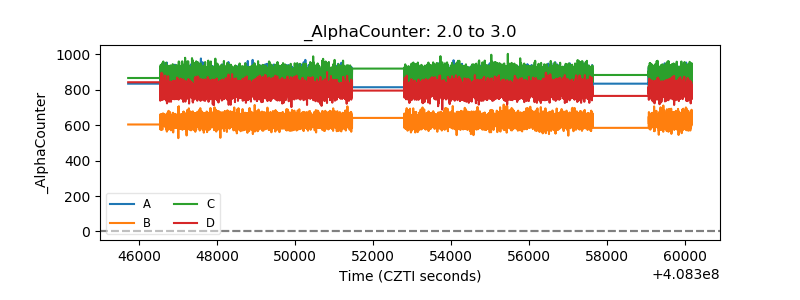 |
| _CPM_Rate | 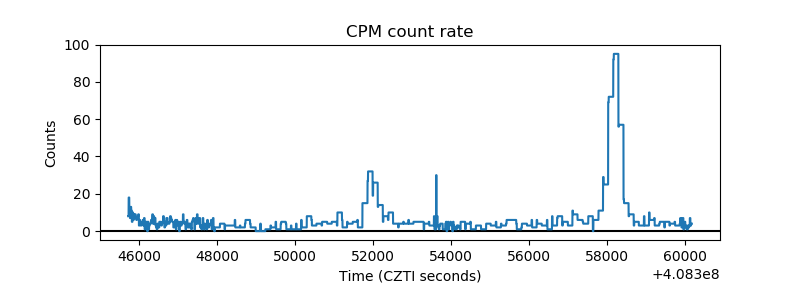 |
| CZT Counter | 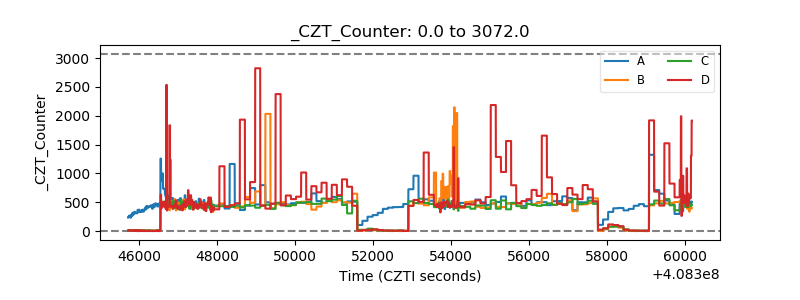 |
| +2.5 Volts monitor | 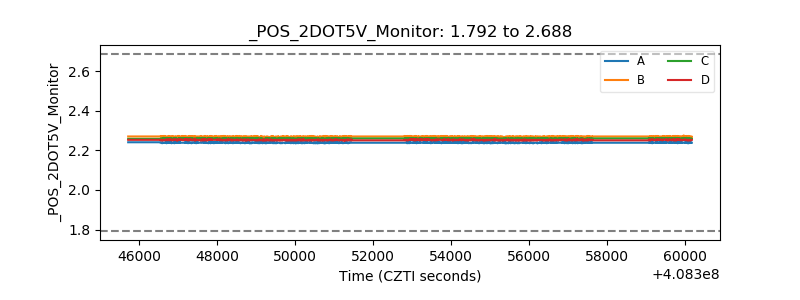 |
| +5 Volts monitor | 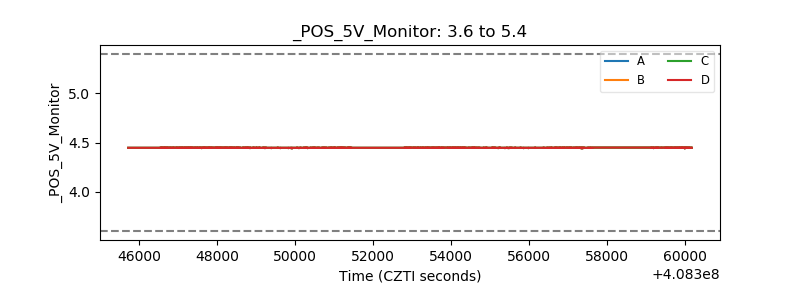 |
| _ROLL_ROT | 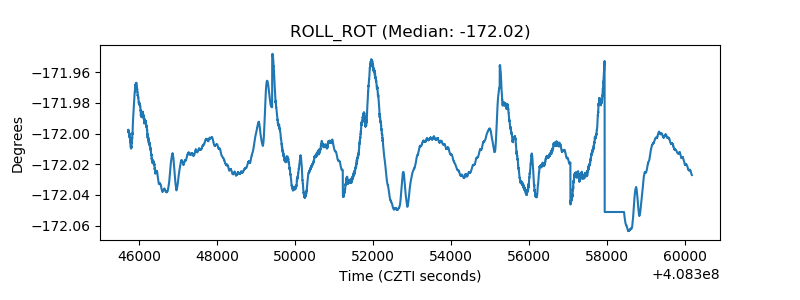 |
| _Roll_DEC | 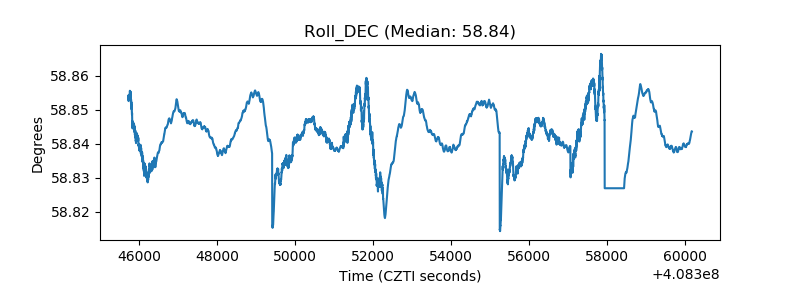 |
| _Roll_RA | 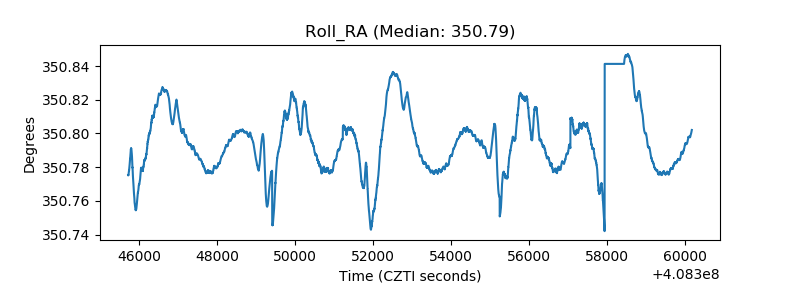 |
| Veto Counter | 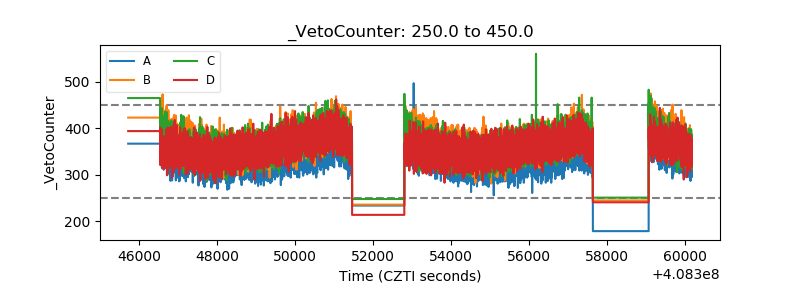 |