| Param | Original file | Final file |
|---|---|---|
| Filename | modeM0/AS1T05_064T01_9000005416_38934cztM0_level2.fits | modeM0/AS1T05_064T01_9000005416_38934cztM0_level2_quad_clean.evt |
| Size (bytes) | 377,429,760 | 87,284,160 |
| Size | 359.9 MB | 83.2 MB |
| Events in quadrant A | 2,680,271 | 593,090 |
| Events in quadrant B | 3,065,577 | 587,424 |
| Events in quadrant C | 2,477,900 | 576,504 |
| Events in quadrant D | 5,333,212 | 513,563 |
| Mode SS | |||
|---|---|---|---|
| Quadrant | BADHDUFLAG | Total packets | Discarded packets |
| A | 0 | 106 | 0 |
| B | 0 | 106 | 0 |
| C | 0 | 106 | 0 |
| D | 0 | 106 | 0 |
| Mode M9 | |||
|---|---|---|---|
| Quadrant | BADHDUFLAG | Total packets | Discarded packets |
| A | 0 | 16 | 0 |
| B | 0 | 16 | 0 |
| C | 0 | 16 | 0 |
| D | 0 | 16 | 0 |
| Mode M0 | |||
|---|---|---|---|
| Quadrant | BADHDUFLAG | Total packets | Discarded packets |
| A | 0 | 11169 | 6 |
| B | 0 | 12761 | 1 |
| C | 0 | 10711 | 2 |
| D | 0 | 19438 | 9 |
| Quadrant | Total seconds | Saturated seconds | Saturation percentage |
|---|---|---|---|
| A | 5323 | 6 | 0.112718% |
| B | 5326 | 180 | 3.379647% |
| C | 5325 | 3 | 0.056338% |
| D | 5324 | 362 | 6.799399% |
Noise dominated data is calculated using 1-second bins in cleaned event files. If a bin has >2000 counts, and if more than 50% of those come from <1% of pixels, then it is considered to be noise-dominated and hence unusable.
| Quadrant | # 1 sec bins | Bins with >0 counts | Bins with >2000 counts | High rate bins dominated by noise | Noise dominated (total time) | Noise dominated (detector-on time) | Marked lightcurve |
|---|---|---|---|---|---|---|---|
| A | 6879 | 5326 | 0 | 0 | 0.00% | 0.00% | 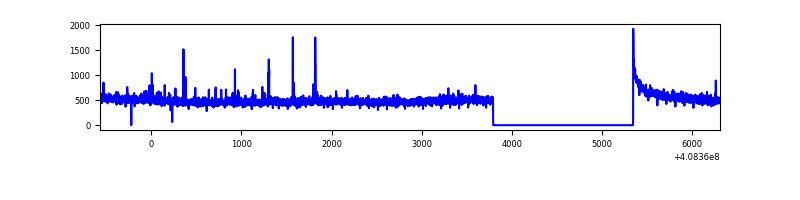 |
| B | 6879 | 5327 | 161 | 161 | 2.34% | 3.02% | 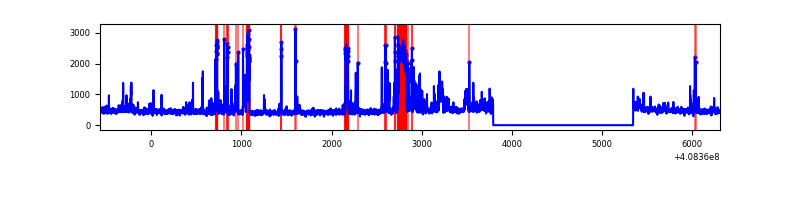 |
| C | 6879 | 5327 | 1 | 1 | 0.01% | 0.02% | 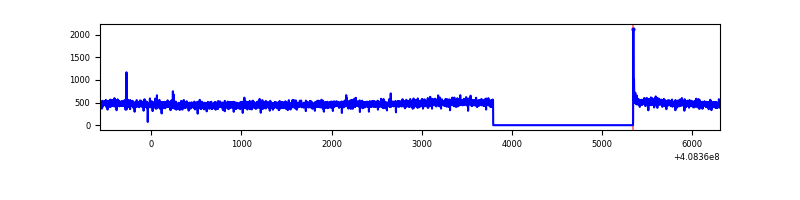 |
| D | 6879 | 5327 | 392 | 392 | 5.70% | 7.36% | 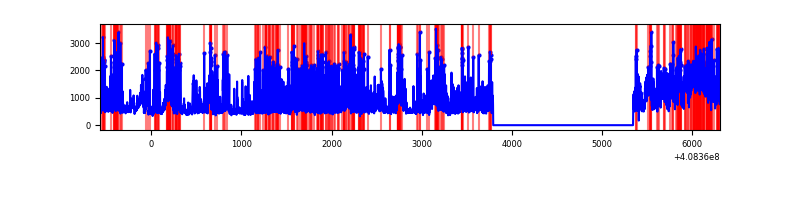 |
Top three noisy pixels from each quadrant. If the there are fewer than three noisy pixels in the level2.evt file, extra rows are filled as -1
| Pixel properties | Quadrant properties | ||||||
|---|---|---|---|---|---|---|---|
| Quadrant | DetID | PixID | Counts | Sigma | Mean | Median | Sigma |
| A | 10 | 83 | 359455 | 2983.88 | 588 | 576 | 120.3 |
| A | 13 | 248 | 40898 | 335.26 | 588 | 576 | 120.3 |
| A | 13 | 254 | 7248 | 55.47 | 588 | 576 | 120.3 |
| B | 5 | 184 | 515633 | 4616.3 | 577 | 561 | 111.6 |
| B | 5 | 172 | 193529 | 1729.46 | 577 | 561 | 111.6 |
| B | 0 | 190 | 53125 | 471.1 | 577 | 561 | 111.6 |
| C | 15 | 214 | 217293 | 1608.36 | 573 | 575 | 134.7 |
| C | 0 | 10 | 8503 | 58.84 | 573 | 575 | 134.7 |
| C | 8 | 79 | 7622 | 52.3 | 573 | 575 | 134.7 |
| D | 12 | 227 | 1335635 | 9607.75 | 563 | 546 | 139.0 |
| D | 9 | 49 | 532969 | 3831.49 | 563 | 546 | 139.0 |
| D | 2 | 250 | 434624 | 3123.77 | 563 | 546 | 139.0 |
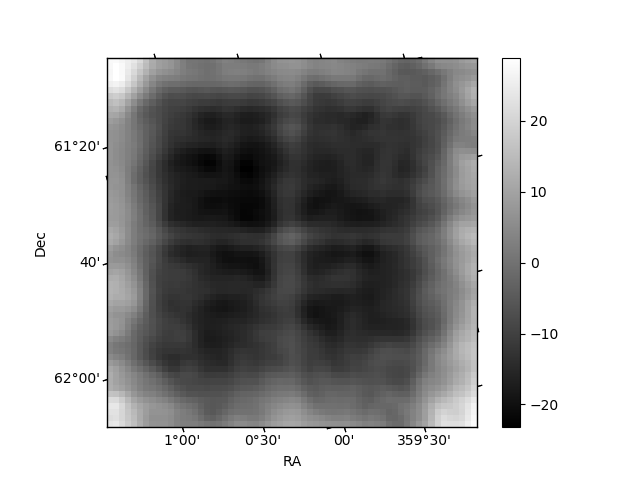
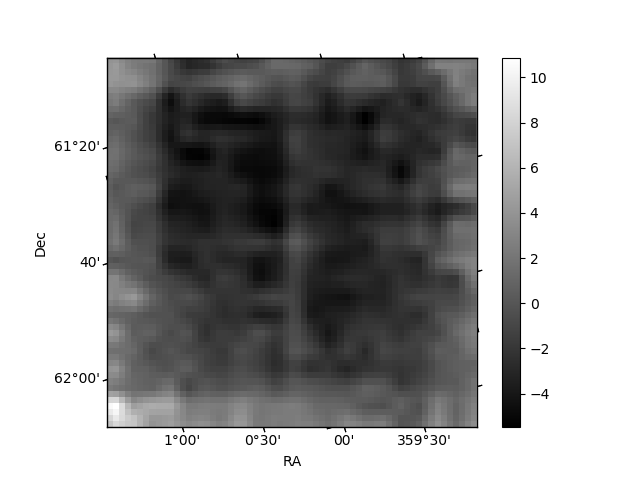
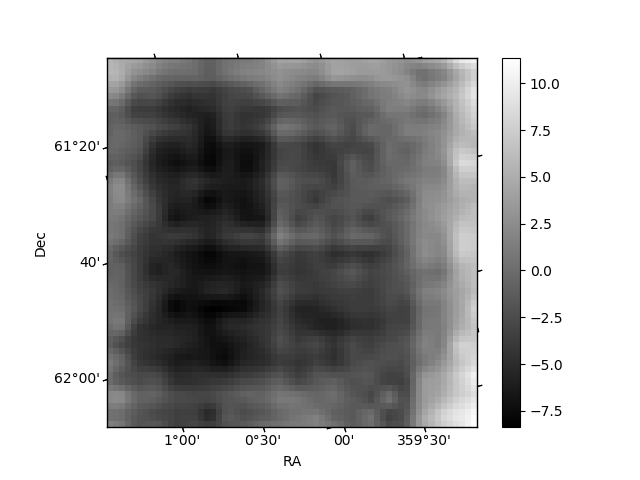
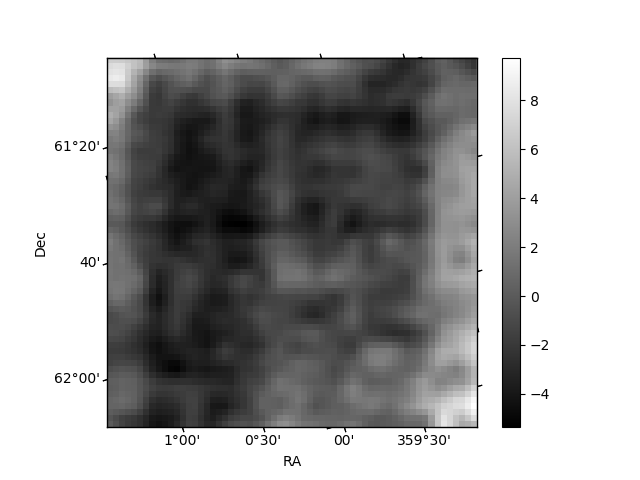
Histogram calculated using DETX and DETY for each event in the final _common_clean file
| Quadrant A | 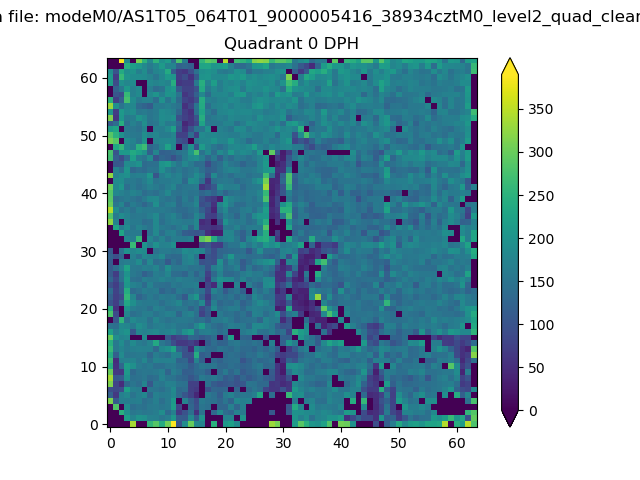 |
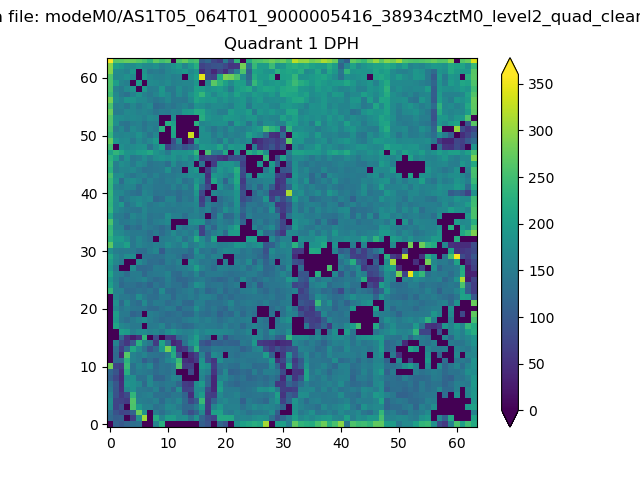 |
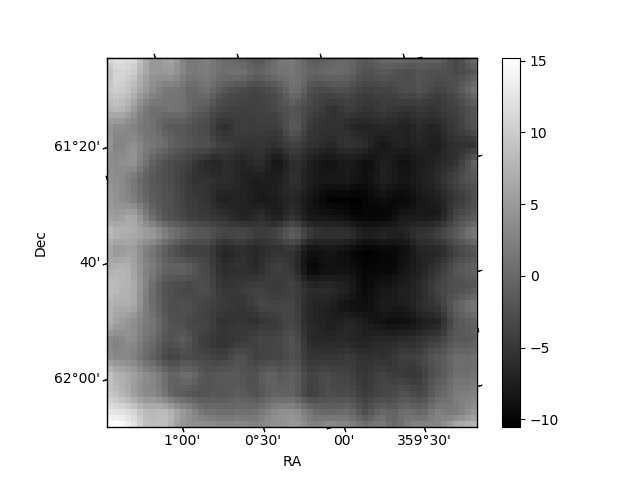
Quadrant B |
|---|---|---|---|
| Quadrant D | 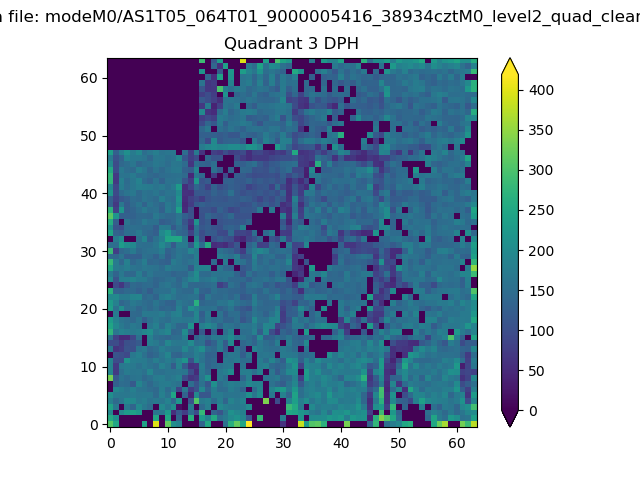 |
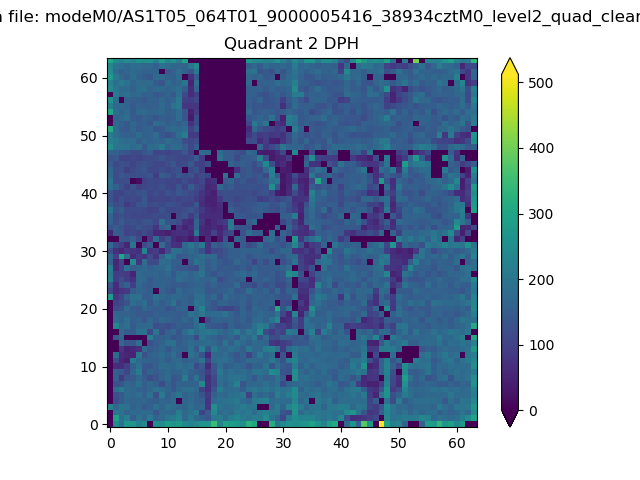 |
Quadrant C |
| Plot type | Count rate plots | Images |
|---|---|---|
| Comparison with Poisson distribution Blue bars denote a histogram of data divided into 1 sec bins. Red curve is a Poisson curve with rate = median count rate of data. |
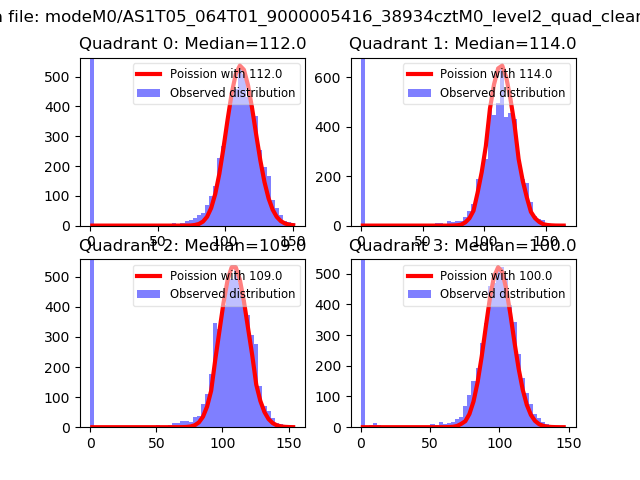 |
 |
| Quadrant-wise count rates Data is divided into 100 sec bins |
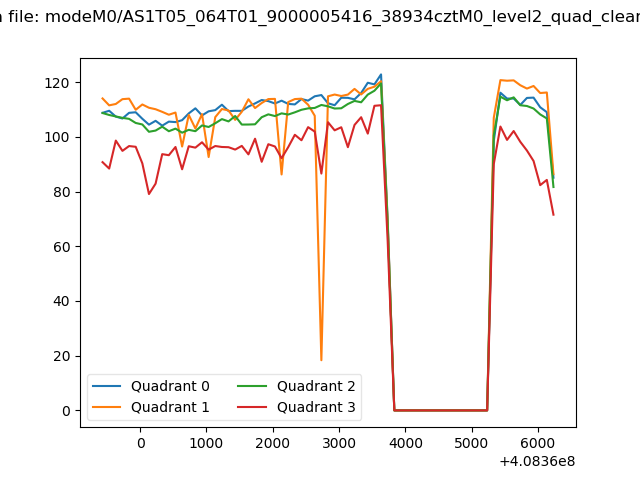 |
|
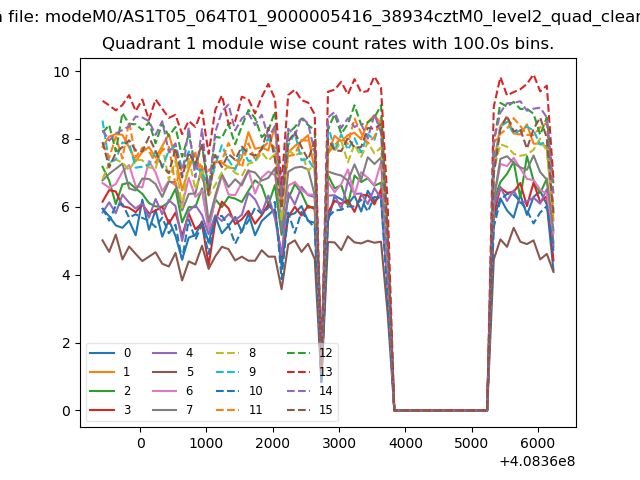
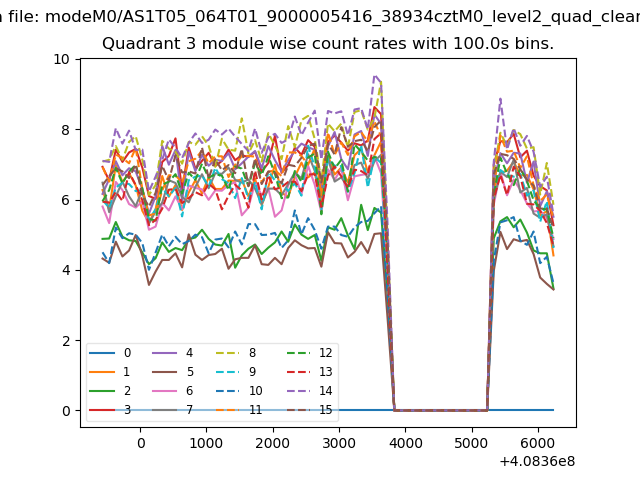
| Module-wise count rates for Quadrant A Data is divided into 100 sec bins |
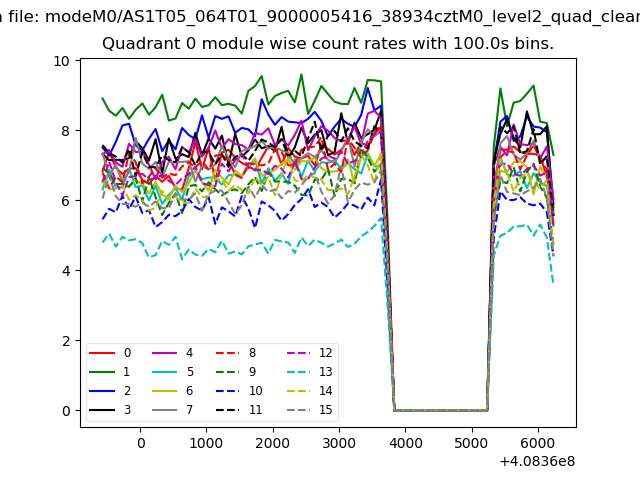 |
 |
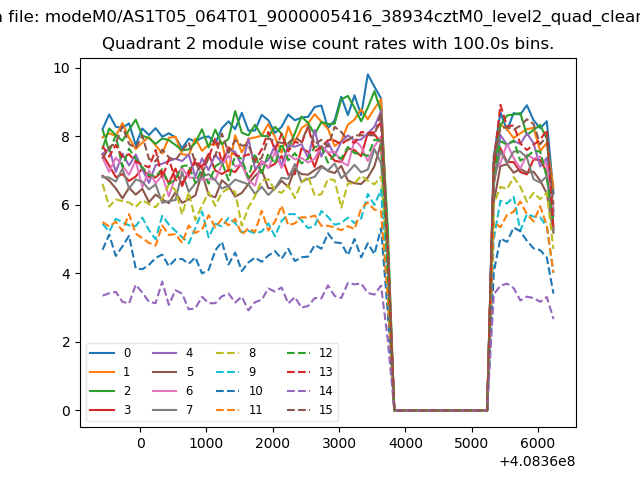
| Module-wise count rates for Quadrant B Data is divided into 100 sec bins |
 |
 |
| Module-wise count rates for Quadrant C Data is divided into 100 sec bins |
 |
 |
| Module-wise count rates for Quadrant D Data is divided into 100 sec bins |
 |
 |
| Parameter | Plot |
|---|---|
| CZT HV Monitor | 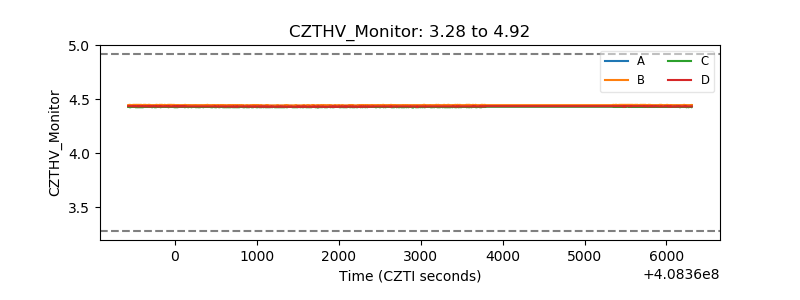 |
| D_VDD | 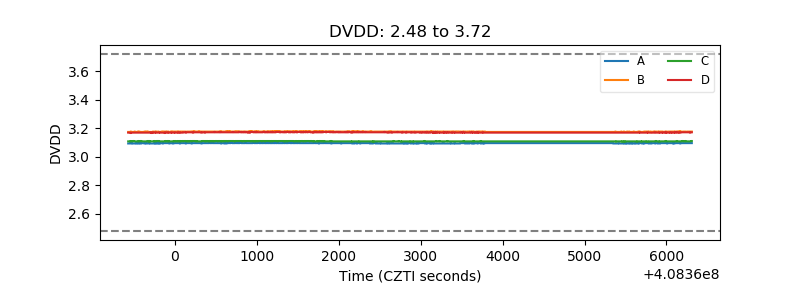 |
| Temperature 1 | 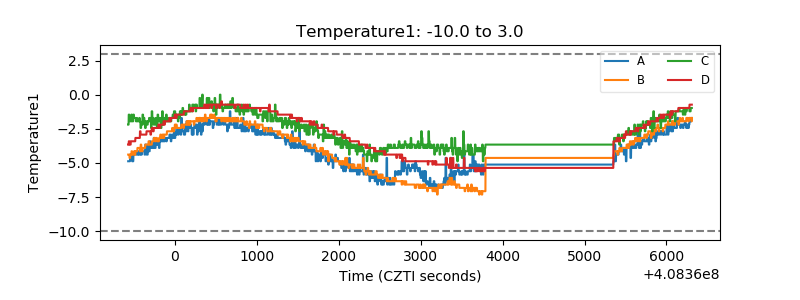 |
| Veto HV Monitor | 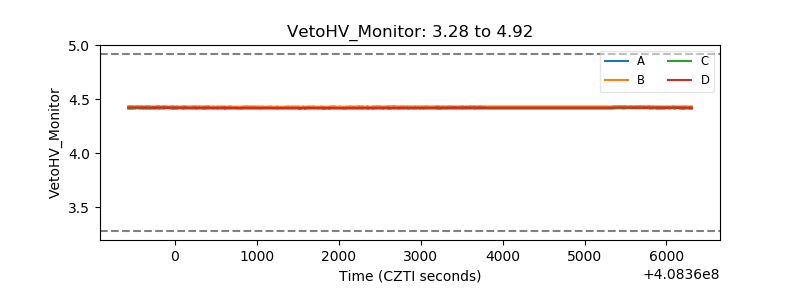 |
| Veto LLD | 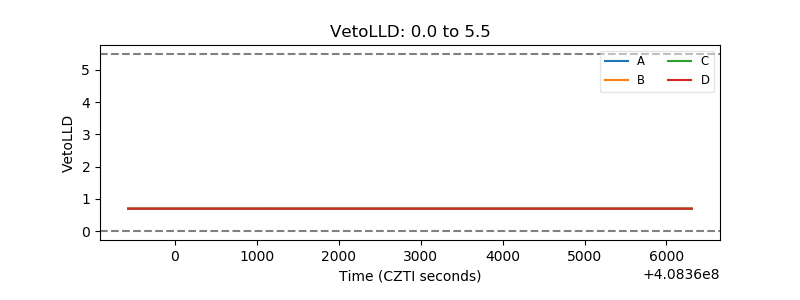 |
| Alpha Counter | 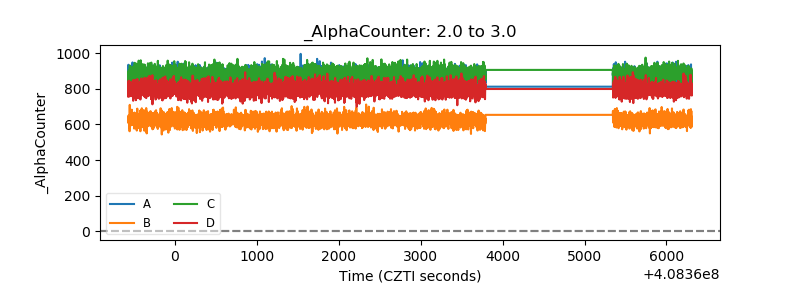 |
| _CPM_Rate | 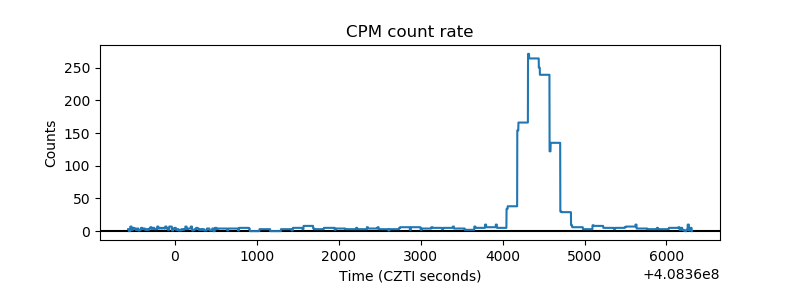 |
| CZT Counter | 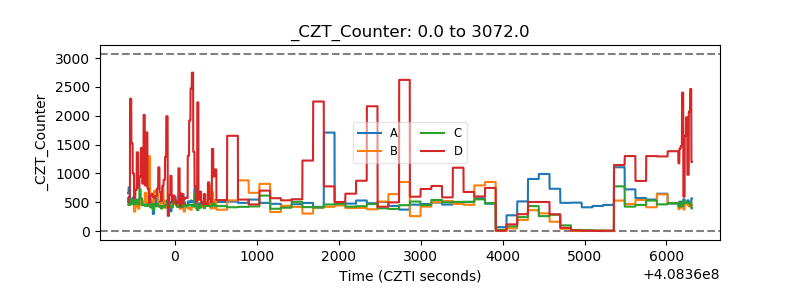 |
| +2.5 Volts monitor | 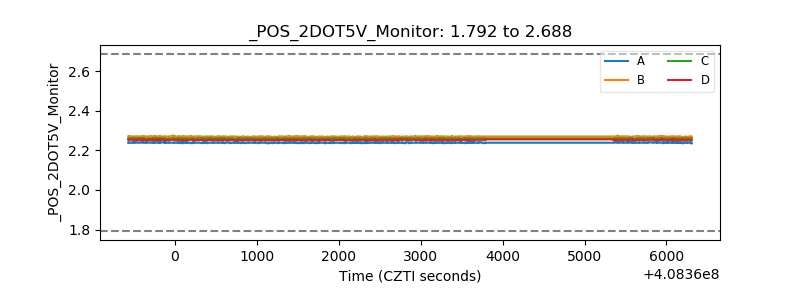 |
| +5 Volts monitor | 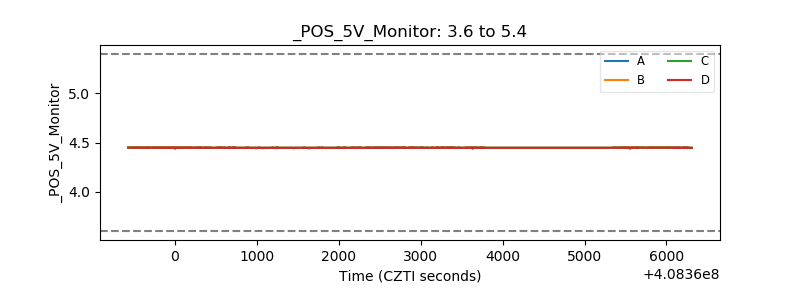 |
| _ROLL_ROT | 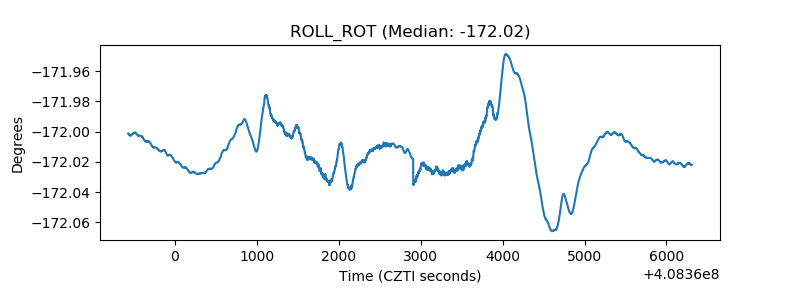 |
| _Roll_DEC | 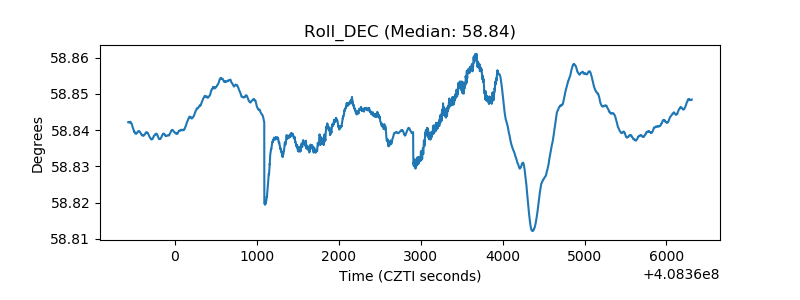 |
| _Roll_RA | 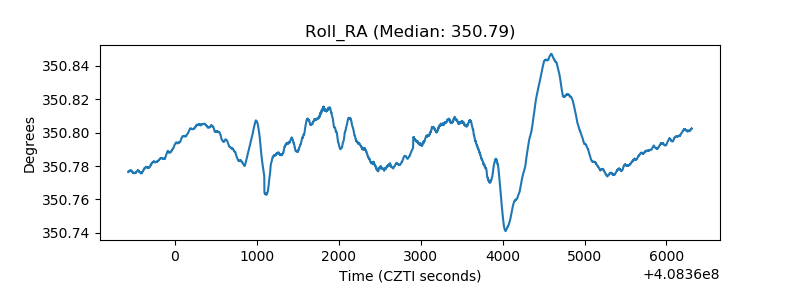 |
| Veto Counter | 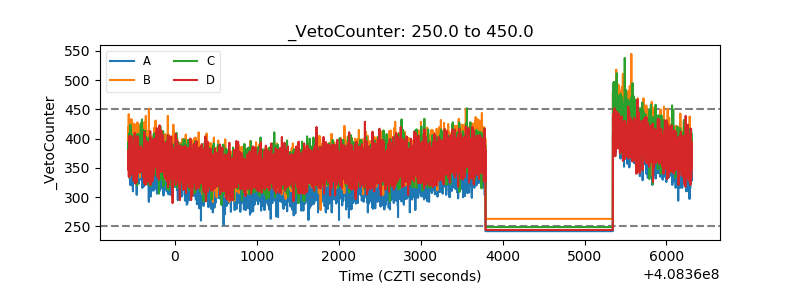 |