| Param | Original file | Final file |
|---|---|---|
| Filename | modeM0/AS1T05_064T01_9000005416_38935cztM0_level2.fits | modeM0/AS1T05_064T01_9000005416_38935cztM0_level2_quad_clean.evt |
| Size (bytes) | 392,287,680 | 91,581,120 |
| Size | 374.1 MB | 87.3 MB |
| Events in quadrant A | 2,870,198 | 621,272 |
| Events in quadrant B | 2,565,575 | 632,951 |
| Events in quadrant C | 2,550,054 | 602,675 |
| Events in quadrant D | 6,110,491 | 533,807 |
| Mode SS | |||
|---|---|---|---|
| Quadrant | BADHDUFLAG | Total packets | Discarded packets |
| A | 0 | 110 | 0 |
| B | 0 | 110 | 0 |
| C | 0 | 110 | 0 |
| D | 0 | 110 | 0 |
| Mode M9 | |||
|---|---|---|---|
| Quadrant | BADHDUFLAG | Total packets | Discarded packets |
| A | 0 | 19 | 0 |
| B | 0 | 19 | 0 |
| C | 0 | 19 | 0 |
| D | 0 | 20 | 0 |
| Mode M0 | |||
|---|---|---|---|
| Quadrant | BADHDUFLAG | Total packets | Discarded packets |
| A | 0 | 11950 | 2 |
| B | 0 | 11352 | 4 |
| C | 0 | 11017 | 4 |
| D | 0 | 22070 | 19 |
| Quadrant | Total seconds | Saturated seconds | Saturation percentage |
|---|---|---|---|
| A | 5469 | 11 | 0.201134% |
| B | 5467 | 12 | 0.219499% |
| C | 5467 | 4 | 0.073166% |
| D | 5466 | 430 | 7.866813% |
Noise dominated data is calculated using 1-second bins in cleaned event files. If a bin has >2000 counts, and if more than 50% of those come from <1% of pixels, then it is considered to be noise-dominated and hence unusable.
| Quadrant | # 1 sec bins | Bins with >0 counts | Bins with >2000 counts | High rate bins dominated by noise | Noise dominated (total time) | Noise dominated (detector-on time) | Marked lightcurve |
|---|---|---|---|---|---|---|---|
| A | 7142 | 5470 | 3 | 3 | 0.04% | 0.05% | 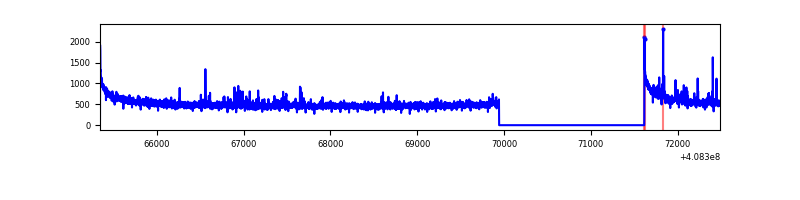 |
| B | 7142 | 5469 | 8 | 8 | 0.11% | 0.15% | 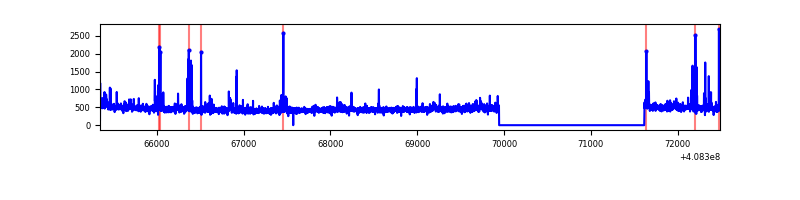 |
| C | 7142 | 5469 | 1 | 1 | 0.01% | 0.02% | 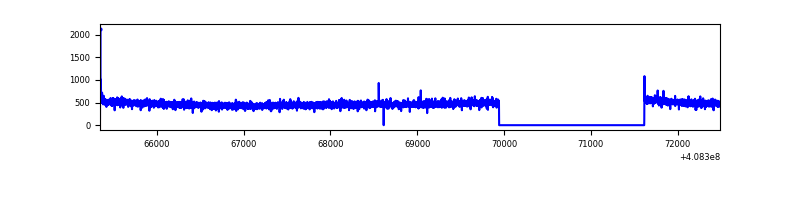 |
| D | 7142 | 5469 | 470 | 470 | 6.58% | 8.59% | 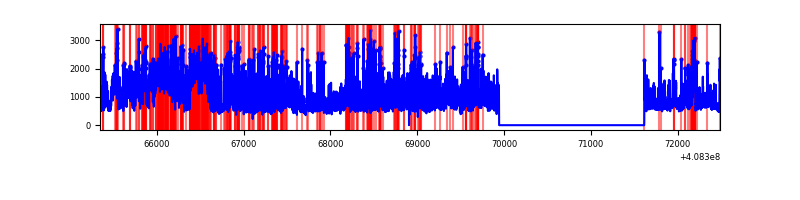 |
Top three noisy pixels from each quadrant. If the there are fewer than three noisy pixels in the level2.evt file, extra rows are filled as -1
| Pixel properties | Quadrant properties | ||||||
|---|---|---|---|---|---|---|---|
| Quadrant | DetID | PixID | Counts | Sigma | Mean | Median | Sigma |
| A | 10 | 83 | 435304 | 3545.55 | 609 | 596 | 122.6 |
| A | 13 | 248 | 69205 | 559.59 | 609 | 596 | 122.6 |
| A | 13 | 254 | 8247 | 62.4 | 609 | 596 | 122.6 |
| B | 5 | 172 | 86034 | 740.11 | 603 | 588 | 115.4 |
| B | 5 | 184 | 24886 | 210.46 | 603 | 588 | 115.4 |
| B | 0 | 230 | 23109 | 195.07 | 603 | 588 | 115.4 |
| C | 15 | 214 | 226373 | 1638.22 | 592 | 595 | 137.8 |
| C | 0 | 10 | 10193 | 69.64 | 592 | 595 | 137.8 |
| C | 0 | 239 | 4129 | 25.64 | 592 | 595 | 137.8 |
| D | 12 | 227 | 1589031 | 11228.28 | 580 | 563 | 141.5 |
| D | 9 | 49 | 848754 | 5995.54 | 580 | 563 | 141.5 |
| D | 2 | 250 | 402401 | 2840.44 | 580 | 563 | 141.5 |
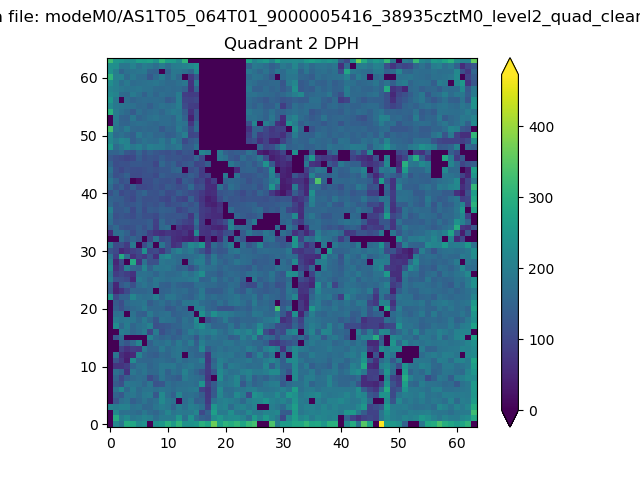
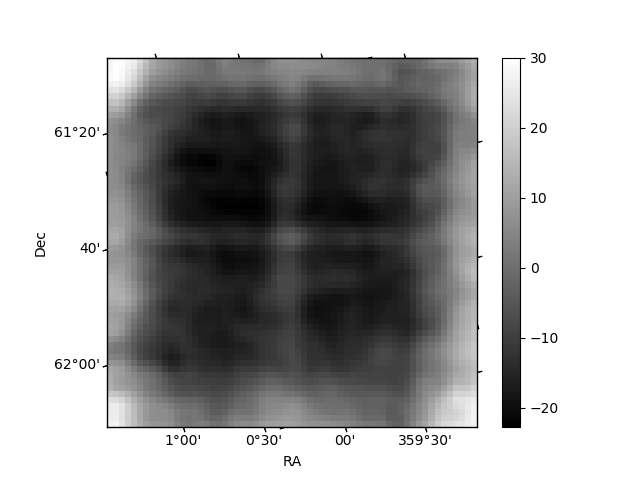
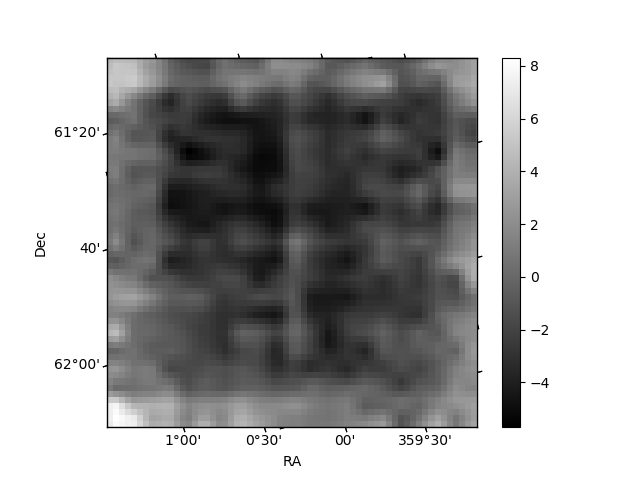
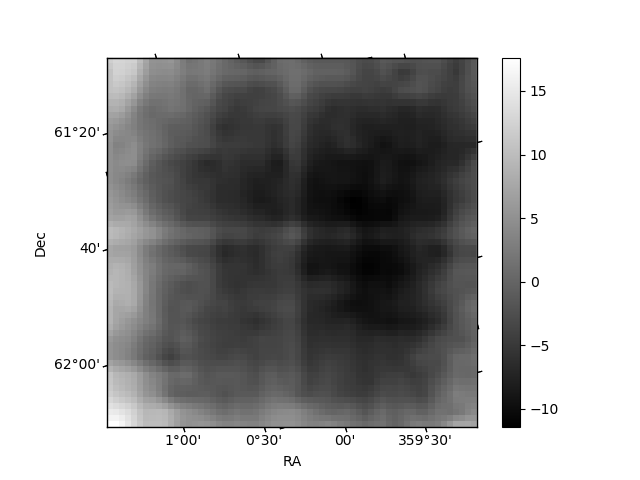
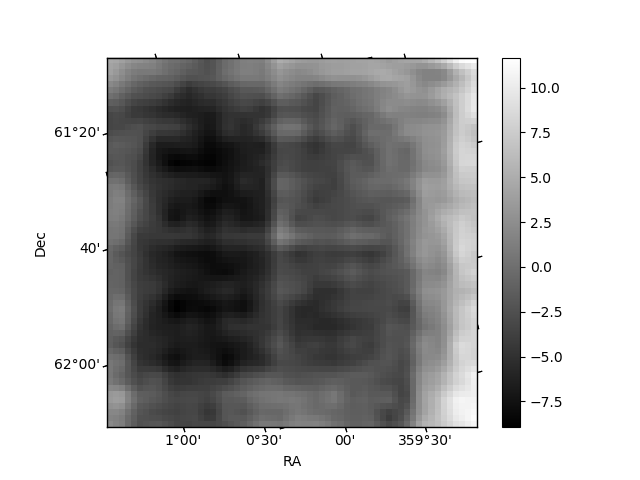
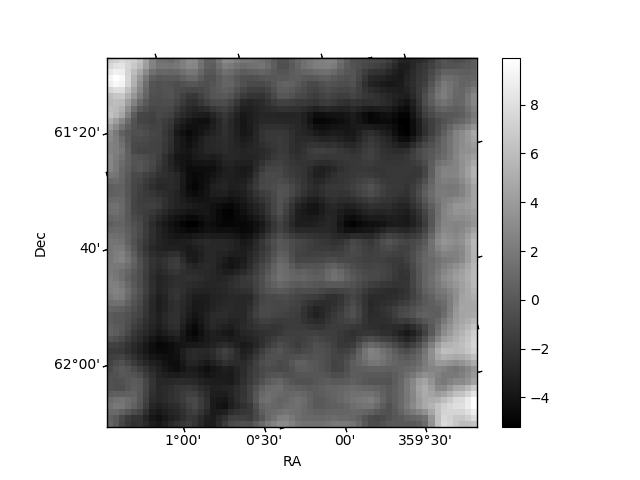
Histogram calculated using DETX and DETY for each event in the final _common_clean file
| Quadrant A | 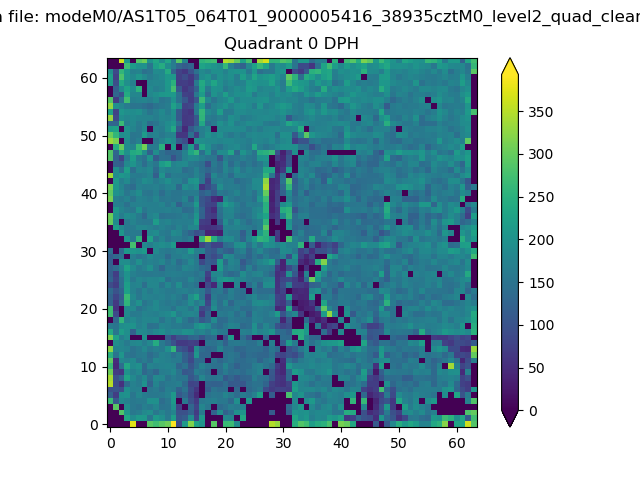 |
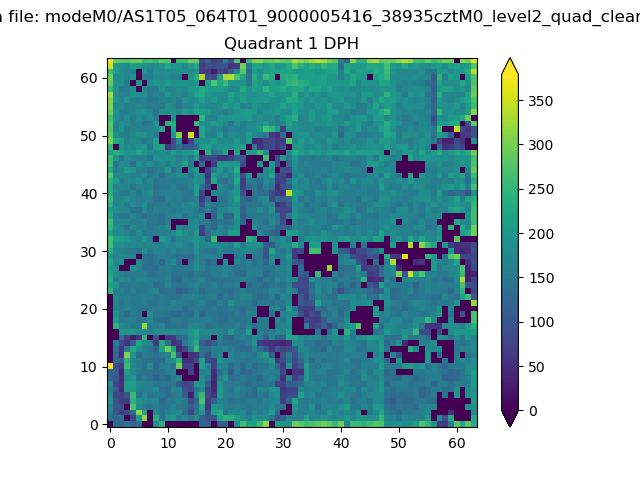 |
Quadrant B |
|---|---|---|---|
| Quadrant D | 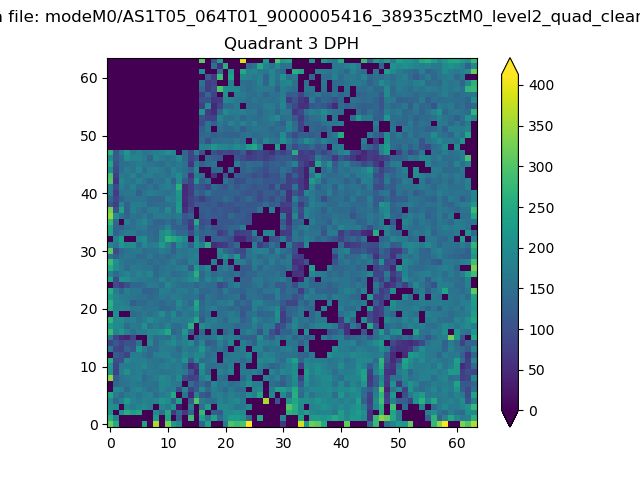 |
 |
Quadrant C |
| Plot type | Count rate plots | Images |
|---|---|---|
| Comparison with Poisson distribution Blue bars denote a histogram of data divided into 1 sec bins. Red curve is a Poisson curve with rate = median count rate of data. |
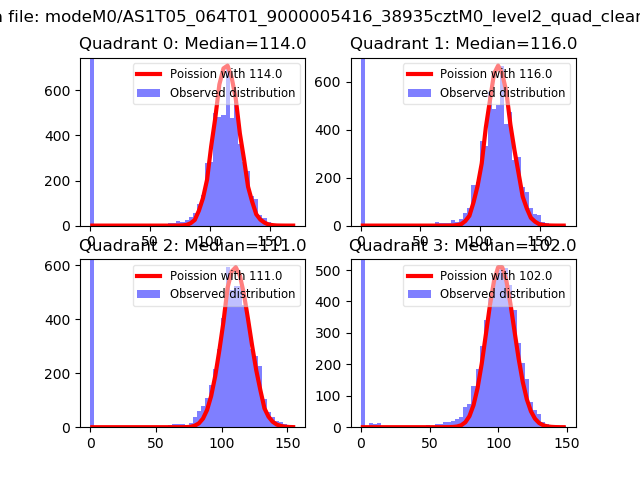 |
 |
| Quadrant-wise count rates Data is divided into 100 sec bins |
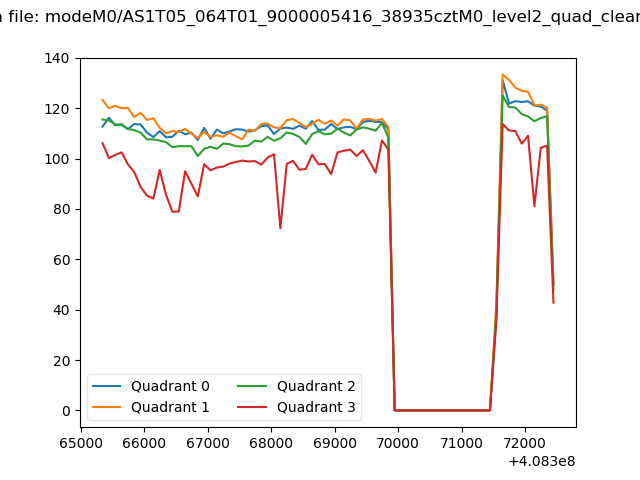 |
|
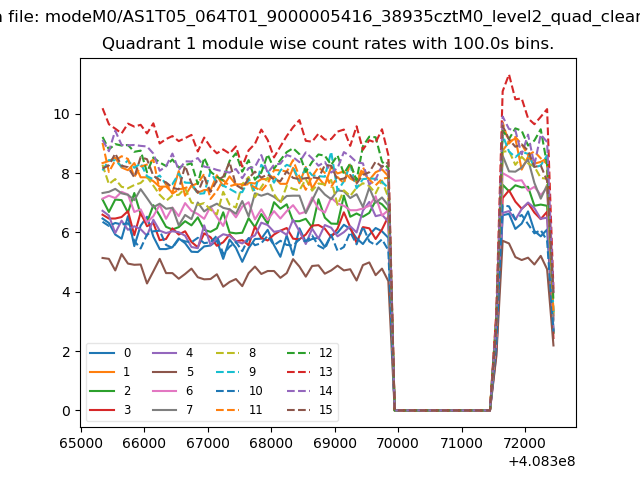
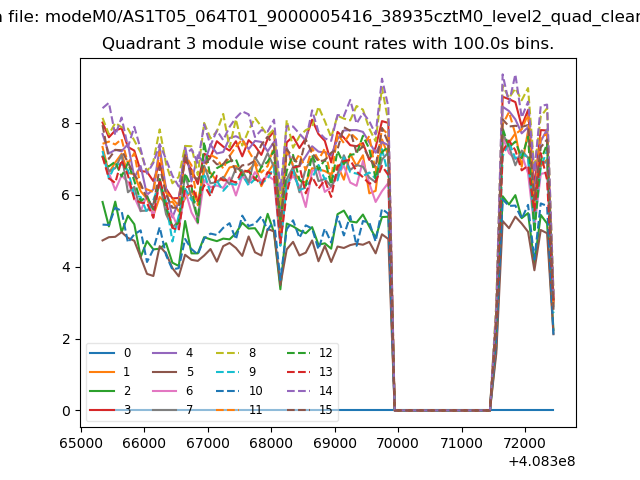
| Module-wise count rates for Quadrant A Data is divided into 100 sec bins |
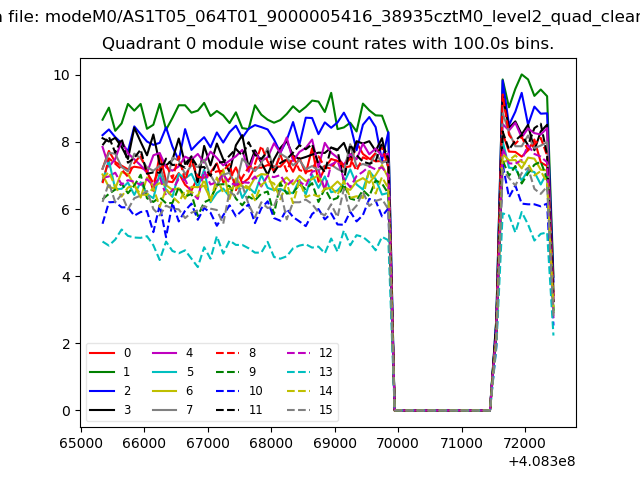 |
 |
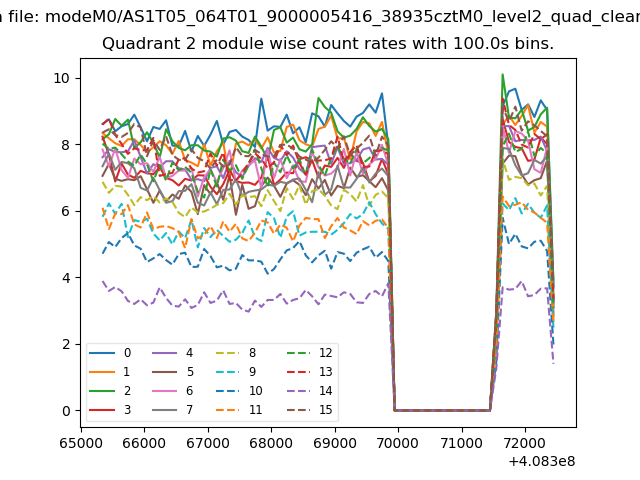
| Module-wise count rates for Quadrant B Data is divided into 100 sec bins |
 |
 |
| Module-wise count rates for Quadrant C Data is divided into 100 sec bins |
 |
 |
| Module-wise count rates for Quadrant D Data is divided into 100 sec bins |
 |
 |
| Parameter | Plot |
|---|---|
| CZT HV Monitor | 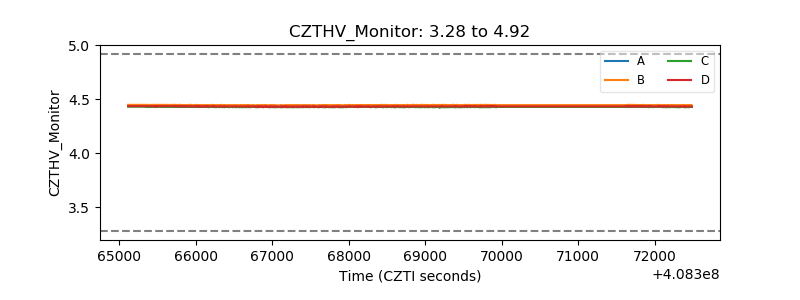 |
| D_VDD | 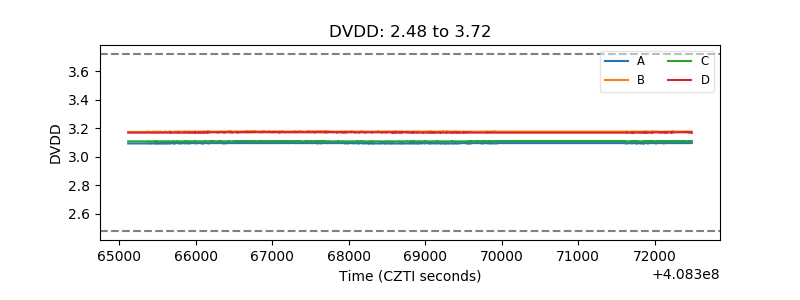 |
| Temperature 1 | 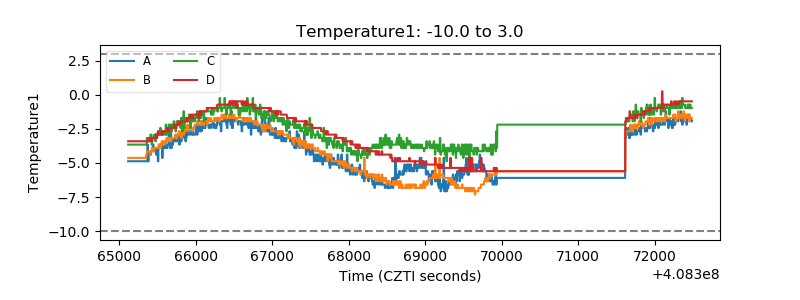 |
| Veto HV Monitor | 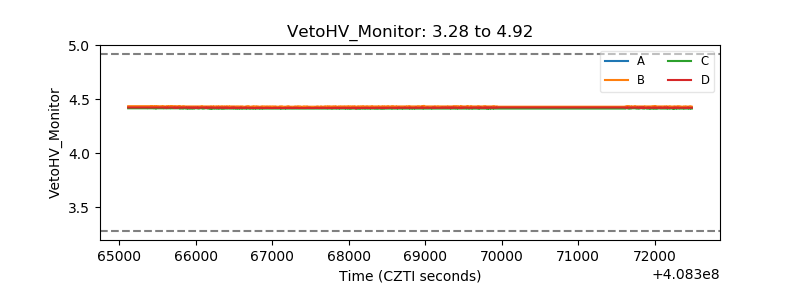 |
| Veto LLD | 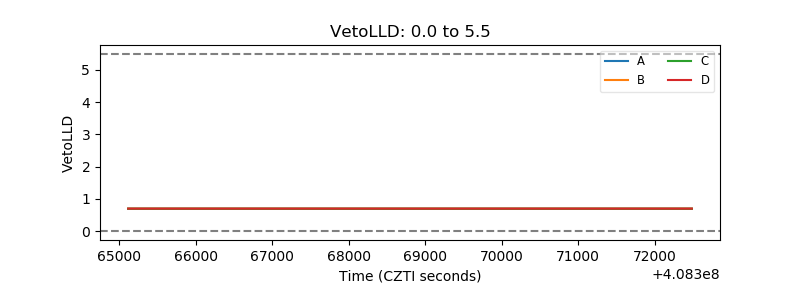 |
| Alpha Counter | 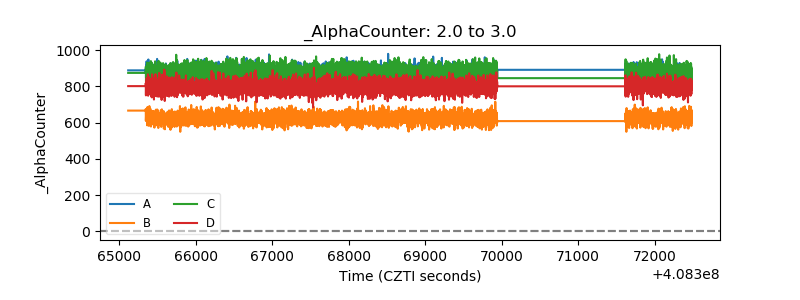 |
| _CPM_Rate | 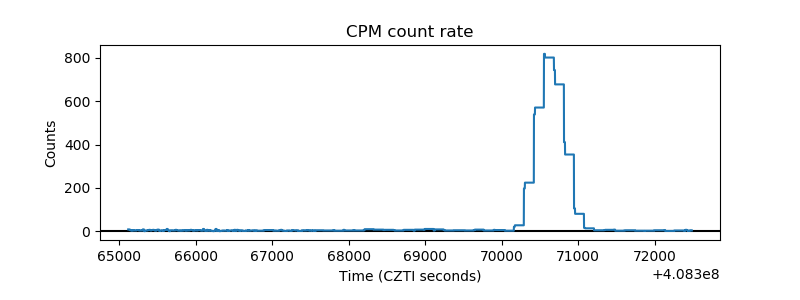 |
| CZT Counter | 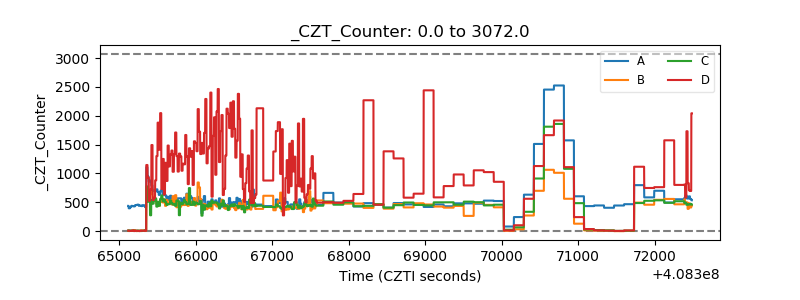 |
| +2.5 Volts monitor |  |
| +5 Volts monitor |  |
| _ROLL_ROT | 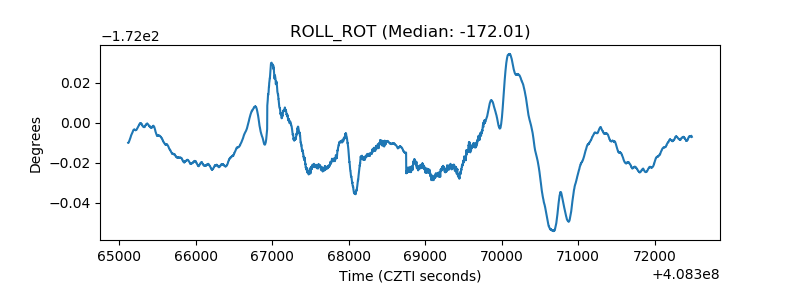 |
| _Roll_DEC | 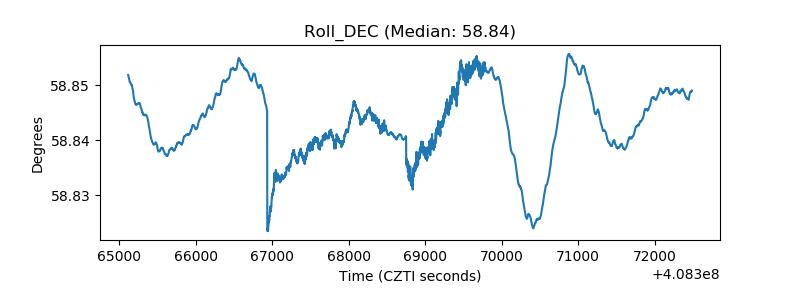 |
| _Roll_RA | 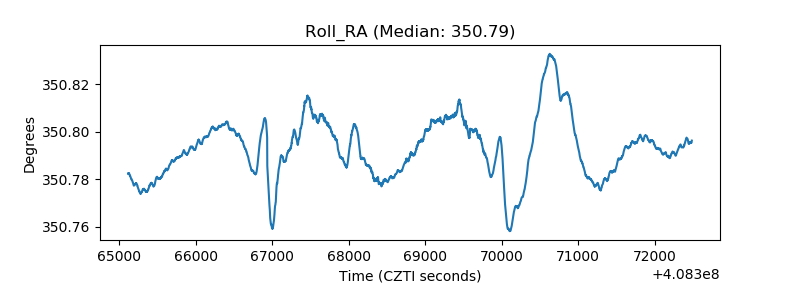 |
| Veto Counter | 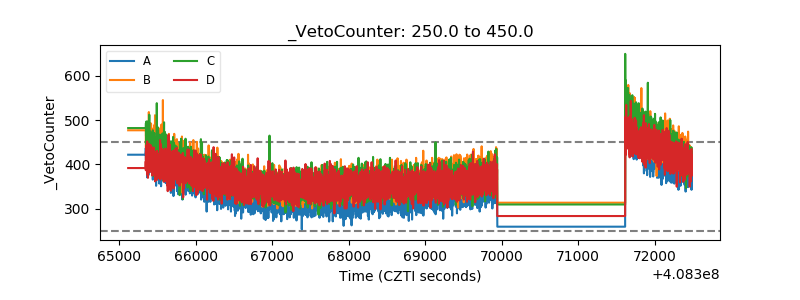 |