| Param | Original file | Final file |
|---|---|---|
| Filename | modeM0/AS1T05_064T01_9000005416_38937cztM0_level2.fits | modeM0/AS1T05_064T01_9000005416_38937cztM0_level2_quad_clean.evt |
| Size (bytes) | 424,408,320 | 94,118,400 |
| Size | 404.7 MB | 89.8 MB |
| Events in quadrant A | 3,011,962 | 657,470 |
| Events in quadrant B | 2,662,921 | 663,963 |
| Events in quadrant C | 2,614,107 | 634,579 |
| Events in quadrant D | 6,993,175 | 508,616 |
| Mode SS | |||
|---|---|---|---|
| Quadrant | BADHDUFLAG | Total packets | Discarded packets |
| A | 0 | 112 | 0 |
| B | 0 | 112 | 0 |
| C | 0 | 112 | 0 |
| D | 0 | 112 | 0 |
| Mode M9 | |||
|---|---|---|---|
| Quadrant | BADHDUFLAG | Total packets | Discarded packets |
| A | 0 | 18 | 0 |
| B | 0 | 18 | 0 |
| C | 0 | 18 | 0 |
| D | 0 | 19 | 0 |
| Mode M0 | |||
|---|---|---|---|
| Quadrant | BADHDUFLAG | Total packets | Discarded packets |
| A | 0 | 12439 | 2 |
| B | 0 | 11650 | 1 |
| C | 0 | 11140 | 1 |
| D | 0 | 24640 | 1 |
| Quadrant | Total seconds | Saturated seconds | Saturation percentage |
|---|---|---|---|
| A | 5506 | 34 | 0.617508% |
| B | 5506 | 30 | 0.544860% |
| C | 5506 | 7 | 0.127134% |
| D | 5506 | 976 | 17.726117% |
Noise dominated data is calculated using 1-second bins in cleaned event files. If a bin has >2000 counts, and if more than 50% of those come from <1% of pixels, then it is considered to be noise-dominated and hence unusable.
| Quadrant | # 1 sec bins | Bins with >0 counts | Bins with >2000 counts | High rate bins dominated by noise | Noise dominated (total time) | Noise dominated (detector-on time) | Marked lightcurve |
|---|---|---|---|---|---|---|---|
| A | 7329 | 5507 | 18 | 18 | 0.25% | 0.33% | 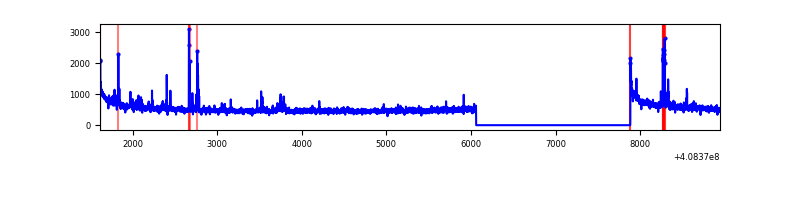 |
| B | 7329 | 5507 | 20 | 20 | 0.27% | 0.36% | 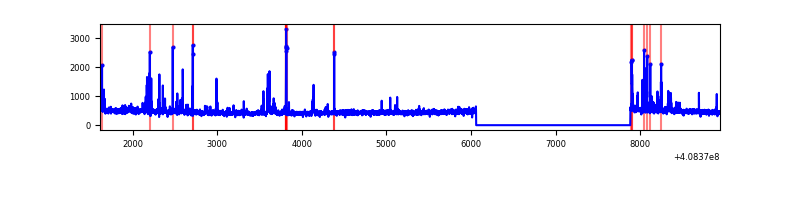 |
| C | 7329 | 5507 | 0 | 0 | 0.00% | 0.00% | 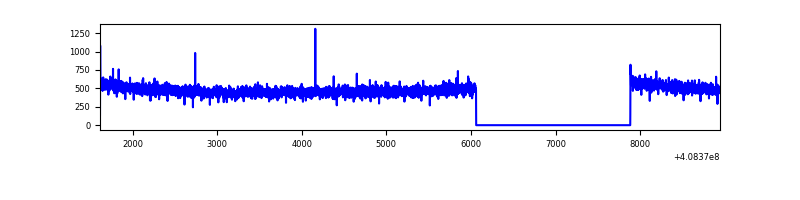 |
| D | 7329 | 5507 | 1060 | 1060 | 14.46% | 19.25% | 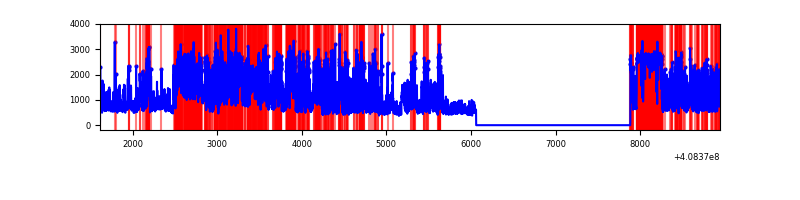 |
Top three noisy pixels from each quadrant. If the there are fewer than three noisy pixels in the level2.evt file, extra rows are filled as -1
| Pixel properties | Quadrant properties | ||||||
|---|---|---|---|---|---|---|---|
| Quadrant | DetID | PixID | Counts | Sigma | Mean | Median | Sigma |
| A | 10 | 83 | 451405 | 3589.4 | 622 | 610 | 125.6 |
| A | 13 | 248 | 110821 | 877.54 | 622 | 610 | 125.6 |
| A | 12 | 16 | 27756 | 216.15 | 622 | 610 | 125.6 |
| B | 5 | 172 | 178809 | 1530.31 | 615 | 599 | 116.5 |
| B | 15 | 85 | 17048 | 141.25 | 615 | 599 | 116.5 |
| B | 0 | 230 | 15454 | 127.56 | 615 | 599 | 116.5 |
| C | 15 | 214 | 226452 | 1607.02 | 608 | 613 | 140.5 |
| C | 13 | 61 | 4165 | 25.28 | 608 | 613 | 140.5 |
| C | 4 | 254 | 3683 | 21.85 | 608 | 613 | 140.5 |
| D | 12 | 227 | 1262602 | 9204.34 | 563 | 548 | 137.1 |
| D | 9 | 49 | 1252038 | 9127.29 | 563 | 548 | 137.1 |
| D | 14 | 52 | 631571 | 4602.14 | 563 | 548 | 137.1 |
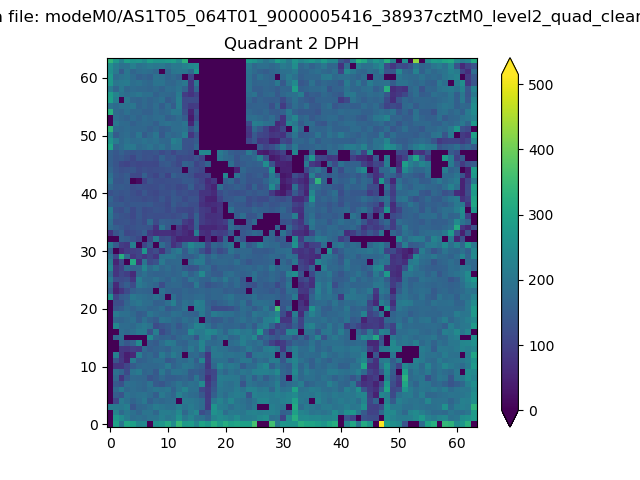
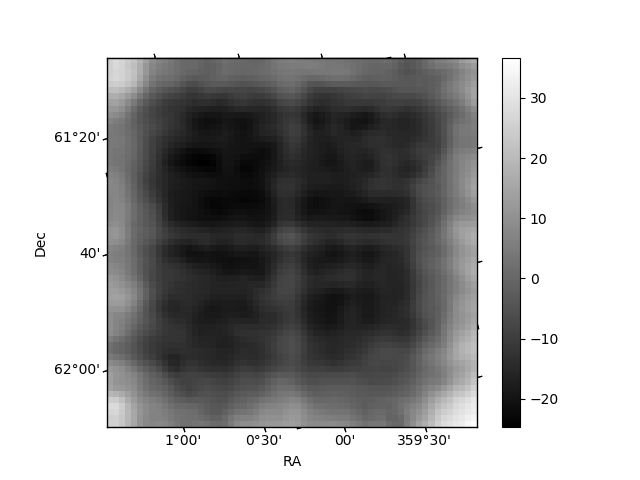
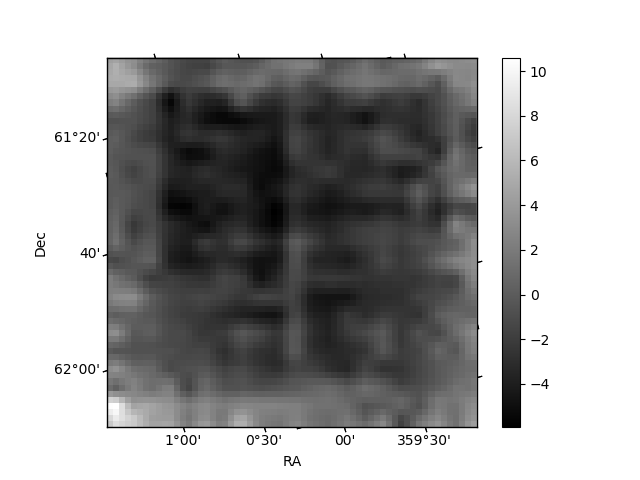
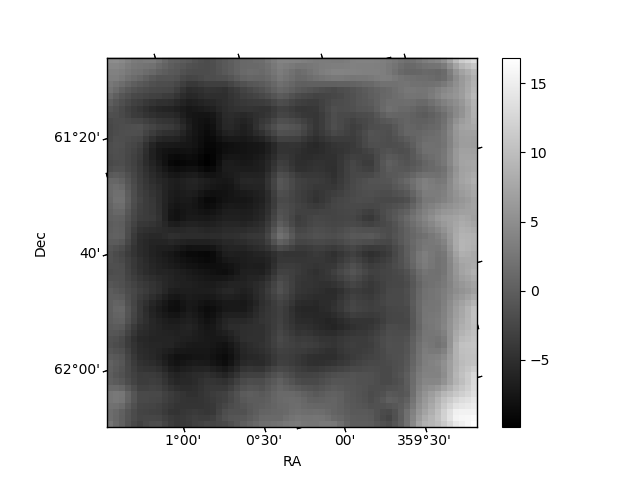
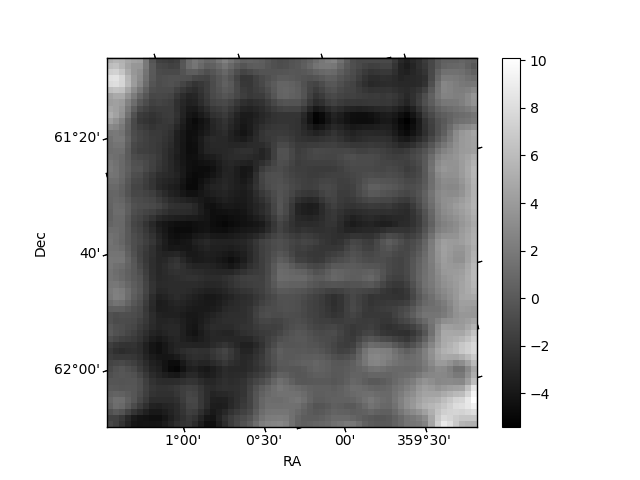
Histogram calculated using DETX and DETY for each event in the final _common_clean file
| Quadrant A | 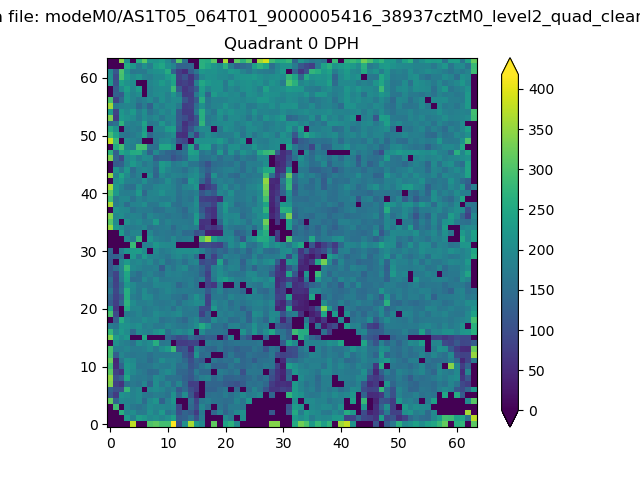 |
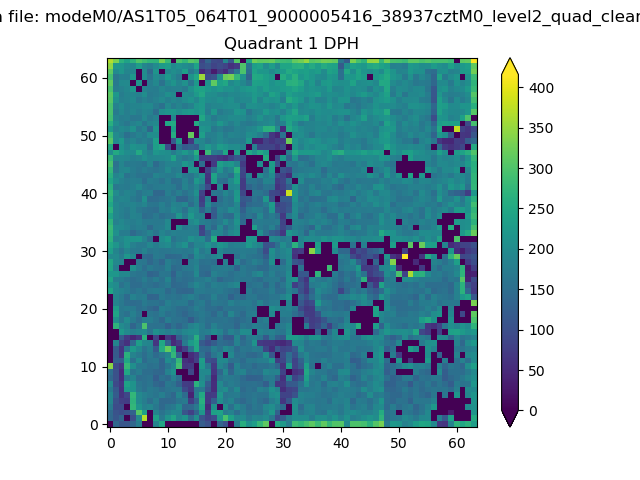 |
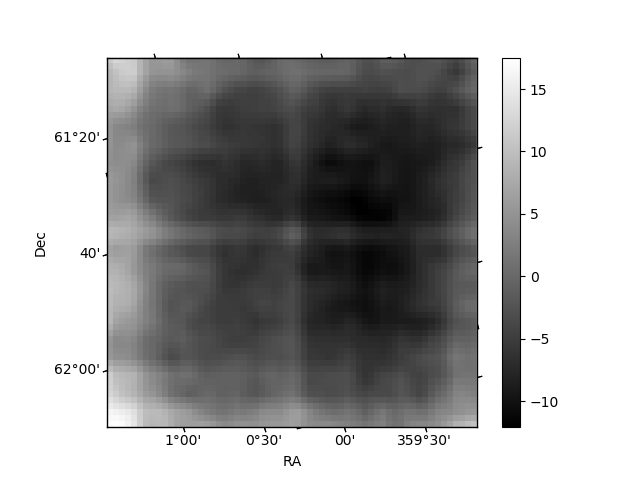
Quadrant B |
|---|---|---|---|
| Quadrant D | 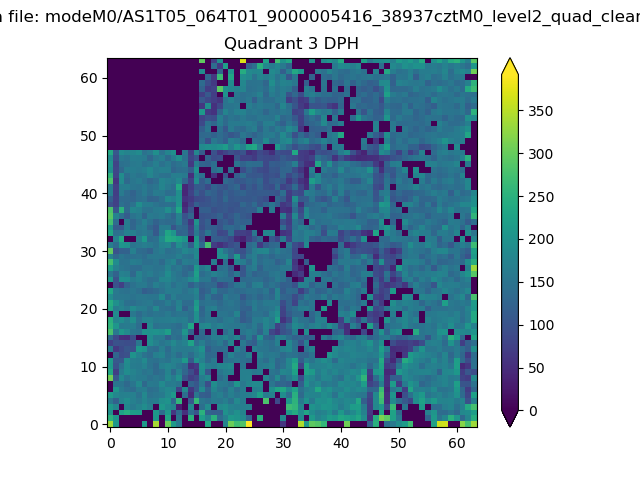 |
 |
Quadrant C |
| Plot type | Count rate plots | Images |
|---|---|---|
| Comparison with Poisson distribution Blue bars denote a histogram of data divided into 1 sec bins. Red curve is a Poisson curve with rate = median count rate of data. |
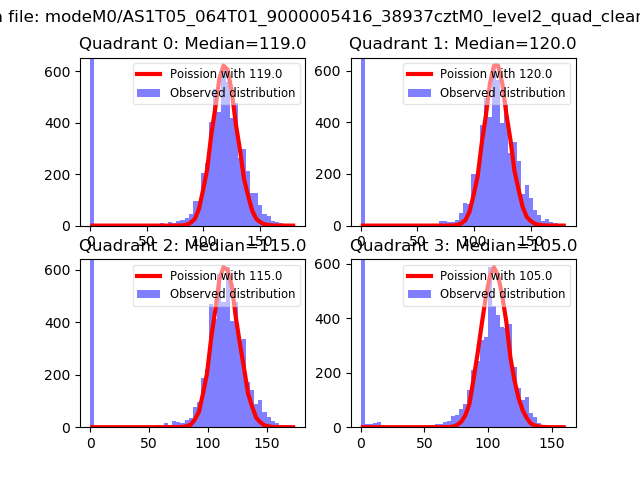 |
 |
| Quadrant-wise count rates Data is divided into 100 sec bins |
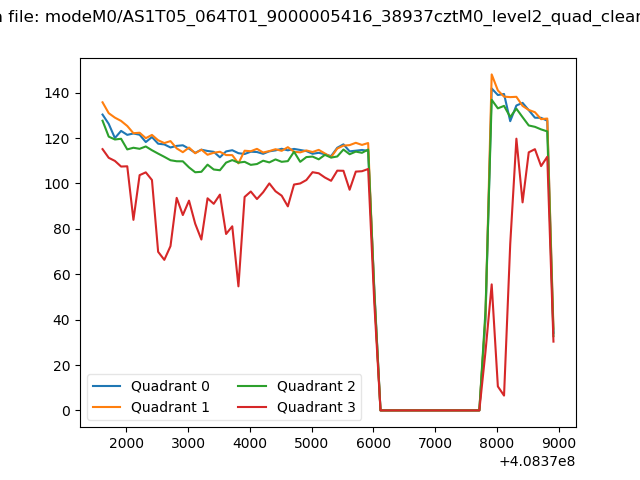 |
|
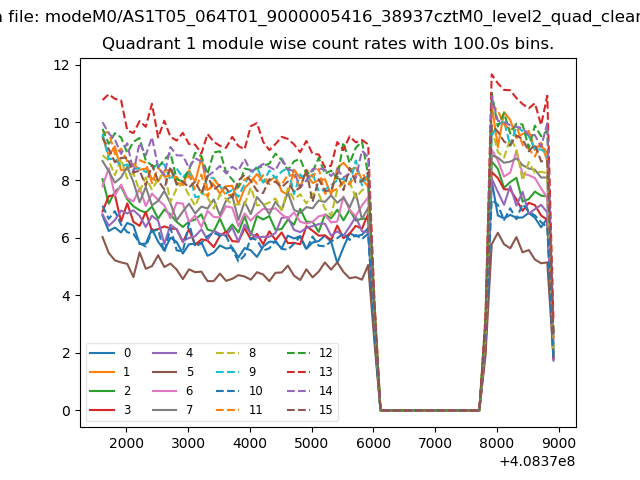
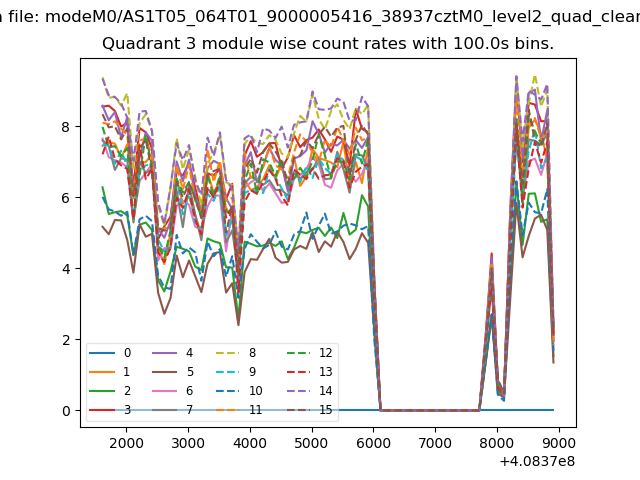
| Module-wise count rates for Quadrant A Data is divided into 100 sec bins |
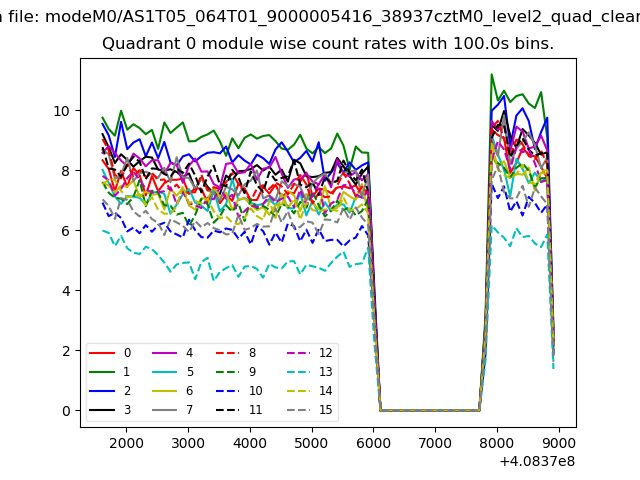 |
 |
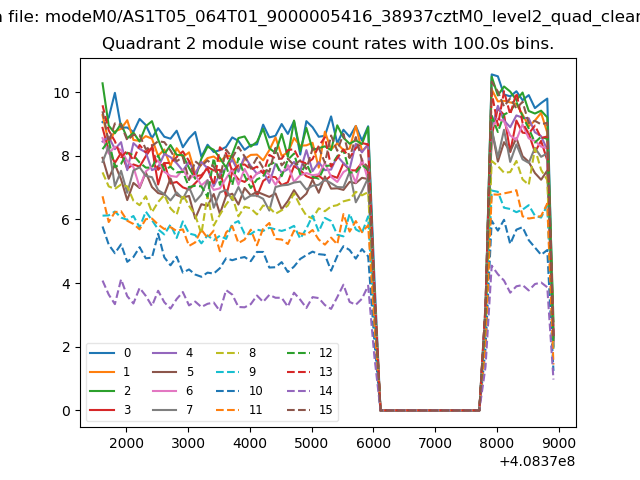
| Module-wise count rates for Quadrant B Data is divided into 100 sec bins |
 |
 |
| Module-wise count rates for Quadrant C Data is divided into 100 sec bins |
 |
 |
| Module-wise count rates for Quadrant D Data is divided into 100 sec bins |
 |
 |
| Parameter | Plot |
|---|---|
| CZT HV Monitor | 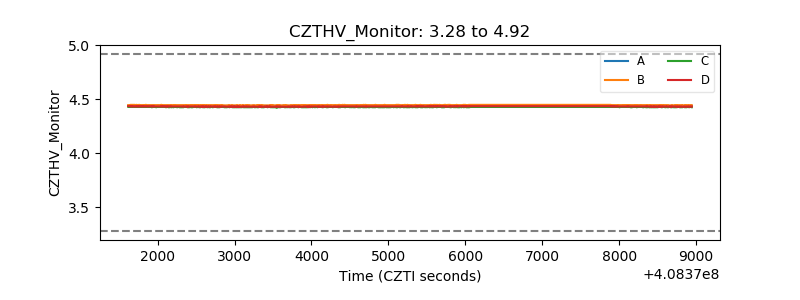 |
| D_VDD | 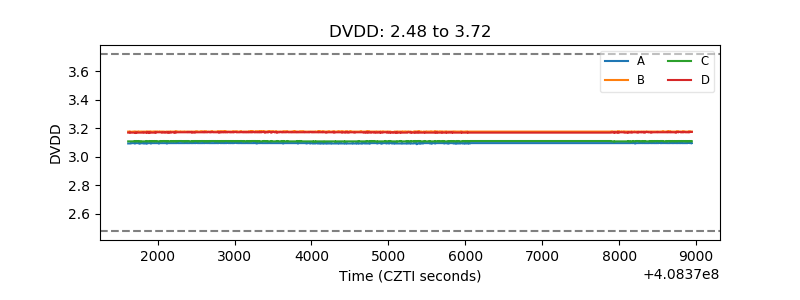 |
| Temperature 1 | 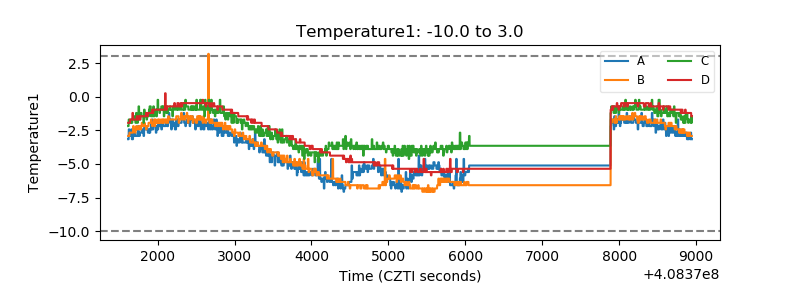 |
| Veto HV Monitor | 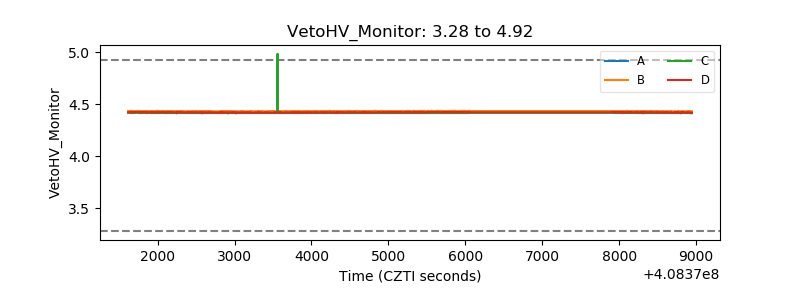 |
| Veto LLD | 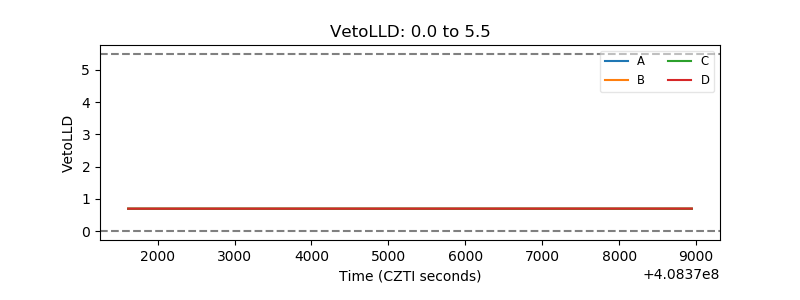 |
| Alpha Counter | 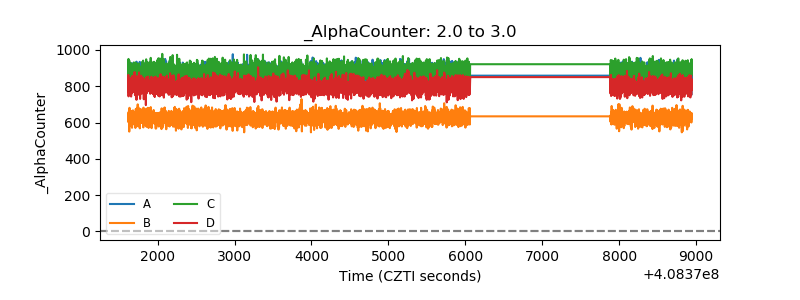 |
| _CPM_Rate | 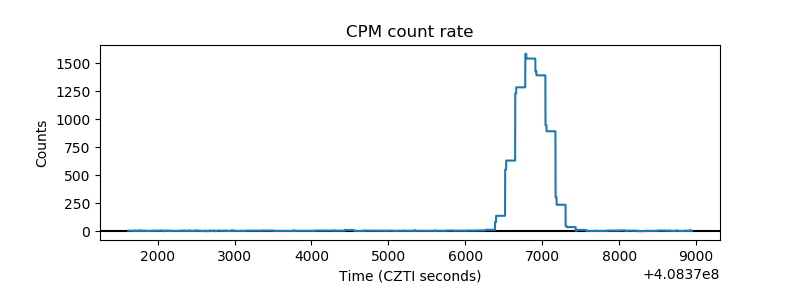 |
| CZT Counter | 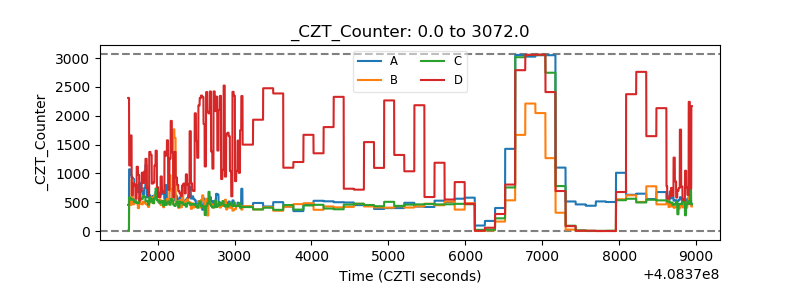 |
| +2.5 Volts monitor | 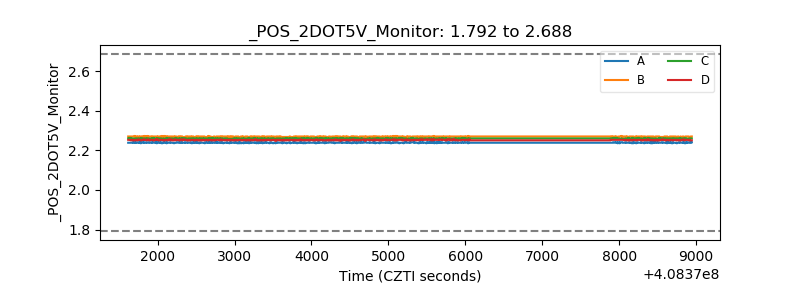 |
| +5 Volts monitor | 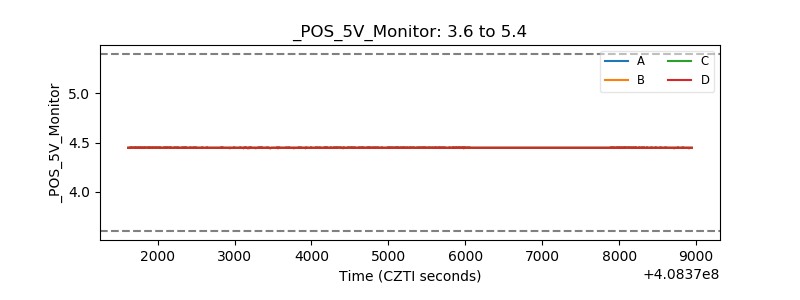 |
| _ROLL_ROT | 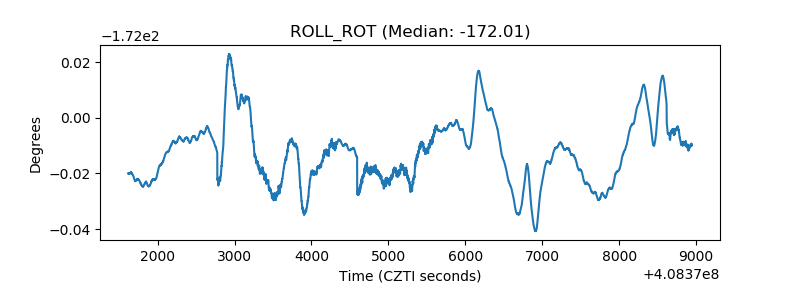 |
| _Roll_DEC | 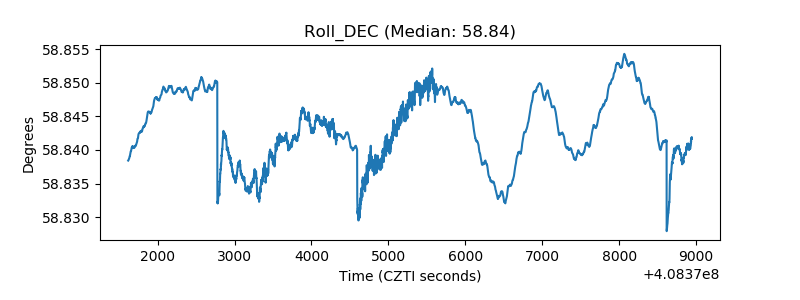 |
| _Roll_RA | 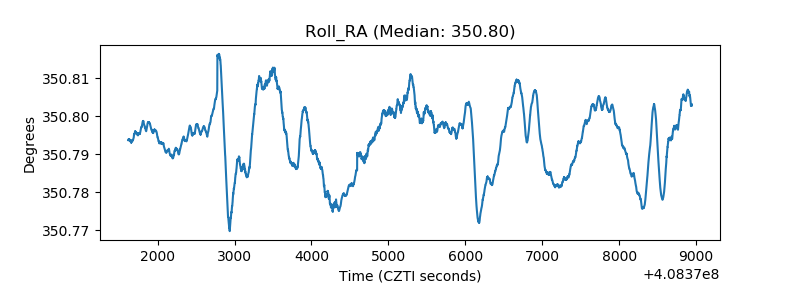 |
| Veto Counter | 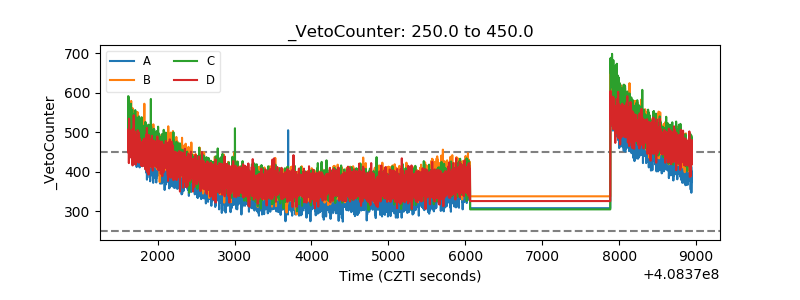 |