| Param | Original file | Final file |
|---|---|---|
| Filename | modeM0/AS1T05_064T01_9000005416_38938cztM0_level2.fits | modeM0/AS1T05_064T01_9000005416_38938cztM0_level2_quad_clean.evt |
| Size (bytes) | 430,833,600 | 91,500,480 |
| Size | 410.9 MB | 87.3 MB |
| Events in quadrant A | 2,775,723 | 653,502 |
| Events in quadrant B | 2,744,923 | 658,990 |
| Events in quadrant C | 2,556,784 | 636,234 |
| Events in quadrant D | 7,468,730 | 460,427 |
| Mode SS | |||
|---|---|---|---|
| Quadrant | BADHDUFLAG | Total packets | Discarded packets |
| A | 0 | 102 | 0 |
| B | 0 | 102 | 0 |
| C | 0 | 102 | 0 |
| D | 0 | 102 | 0 |
| Mode M9 | |||
|---|---|---|---|
| Quadrant | BADHDUFLAG | Total packets | Discarded packets |
| A | 0 | 20 | 0 |
| B | 0 | 20 | 0 |
| C | 0 | 20 | 0 |
| D | 0 | 20 | 0 |
| Mode M0 | |||
|---|---|---|---|
| Quadrant | BADHDUFLAG | Total packets | Discarded packets |
| A | 0 | 11505 | 2 |
| B | 0 | 11565 | 1 |
| C | 0 | 10621 | 1 |
| D | 0 | 25793 | 1 |
| Quadrant | Total seconds | Saturated seconds | Saturation percentage |
|---|---|---|---|
| A | 5170 | 23 | 0.444874% |
| B | 5170 | 35 | 0.676983% |
| C | 5170 | 4 | 0.077369% |
| D | 5170 | 1311 | 25.357834% |
Noise dominated data is calculated using 1-second bins in cleaned event files. If a bin has >2000 counts, and if more than 50% of those come from <1% of pixels, then it is considered to be noise-dominated and hence unusable.
| Quadrant | # 1 sec bins | Bins with >0 counts | Bins with >2000 counts | High rate bins dominated by noise | Noise dominated (total time) | Noise dominated (detector-on time) | Marked lightcurve |
|---|---|---|---|---|---|---|---|
| A | 7083 | 5171 | 13 | 13 | 0.18% | 0.25% | 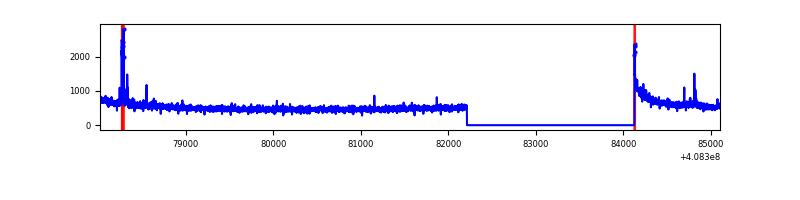 |
| B | 7083 | 5171 | 21 | 21 | 0.30% | 0.41% | 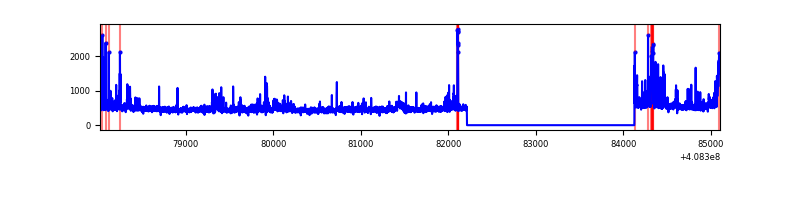 |
| C | 7083 | 5171 | 0 | 0 | 0.00% | 0.00% | 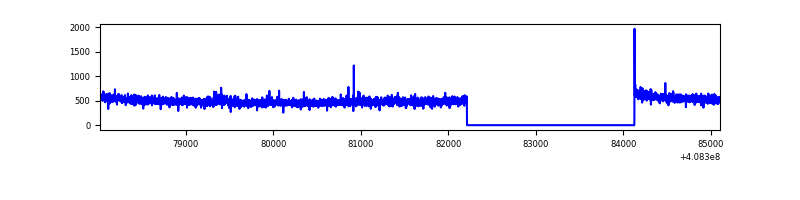 |
| D | 7083 | 5171 | 1417 | 1417 | 20.01% | 27.40% | 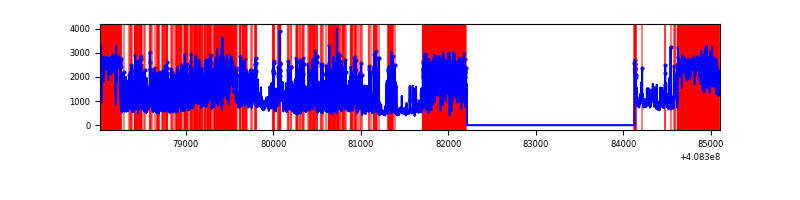 |
Top three noisy pixels from each quadrant. If the there are fewer than three noisy pixels in the level2.evt file, extra rows are filled as -1
| Pixel properties | Quadrant properties | ||||||
|---|---|---|---|---|---|---|---|
| Quadrant | DetID | PixID | Counts | Sigma | Mean | Median | Sigma |
| A | 10 | 83 | 390307 | 3233.71 | 599 | 587 | 120.5 |
| A | 13 | 248 | 62419 | 513.05 | 599 | 587 | 120.5 |
| A | 13 | 254 | 7579 | 58.02 | 599 | 587 | 120.5 |
| B | 5 | 172 | 268566 | 2424.44 | 592 | 578 | 110.5 |
| B | 0 | 190 | 71526 | 641.85 | 592 | 578 | 110.5 |
| B | 0 | 230 | 32561 | 289.34 | 592 | 578 | 110.5 |
| C | 15 | 214 | 211400 | 1545.01 | 590 | 594 | 136.4 |
| C | 14 | 254 | 16069 | 113.42 | 590 | 594 | 136.4 |
| C | 1 | 128 | 10891 | 75.47 | 590 | 594 | 136.4 |
| D | 12 | 227 | 1940658 | 15562.54 | 517 | 503 | 124.7 |
| D | 2 | 250 | 1141055 | 9148.7 | 517 | 503 | 124.7 |
| D | 12 | 235 | 968528 | 7764.81 | 517 | 503 | 124.7 |
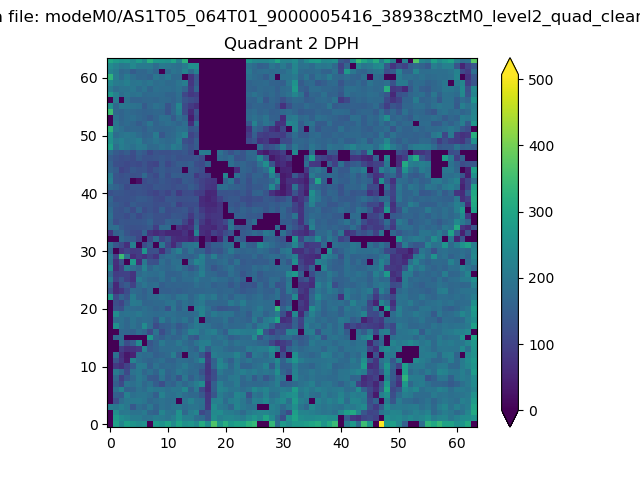
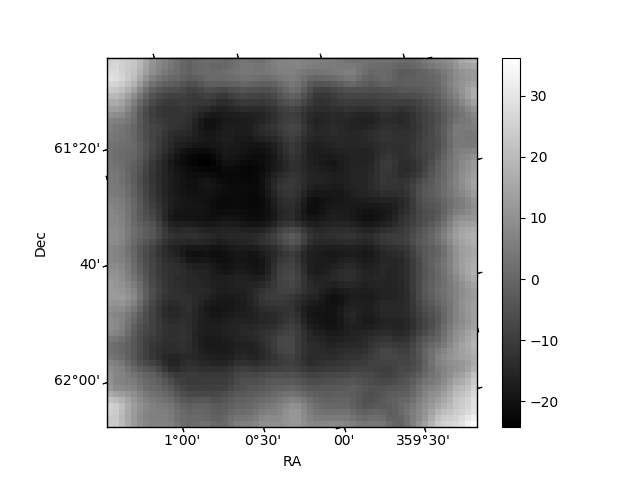
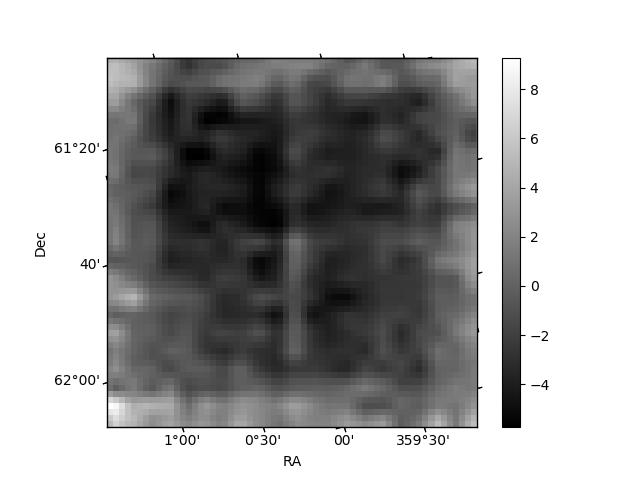
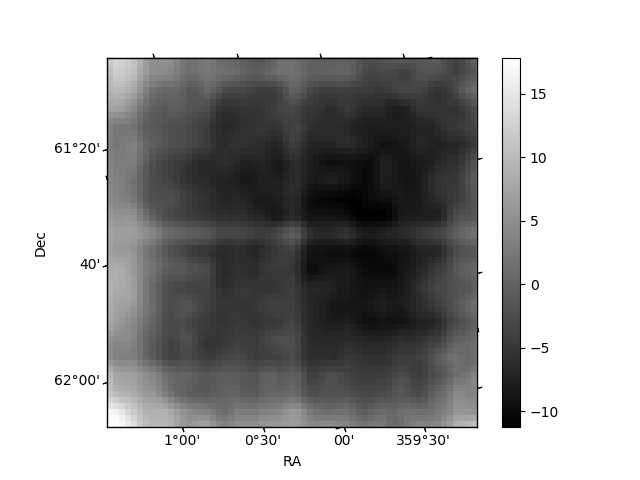
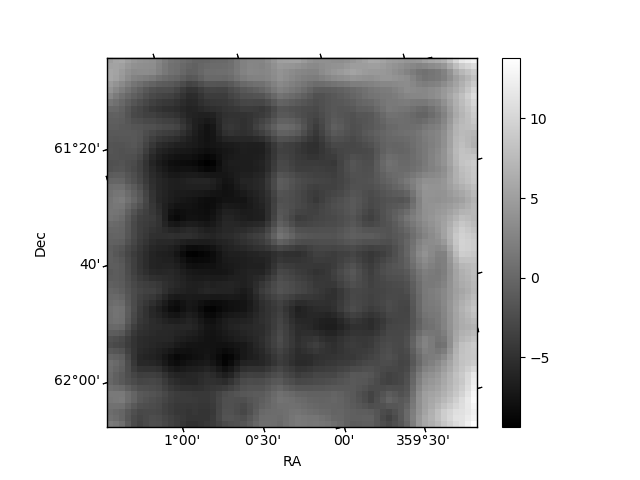
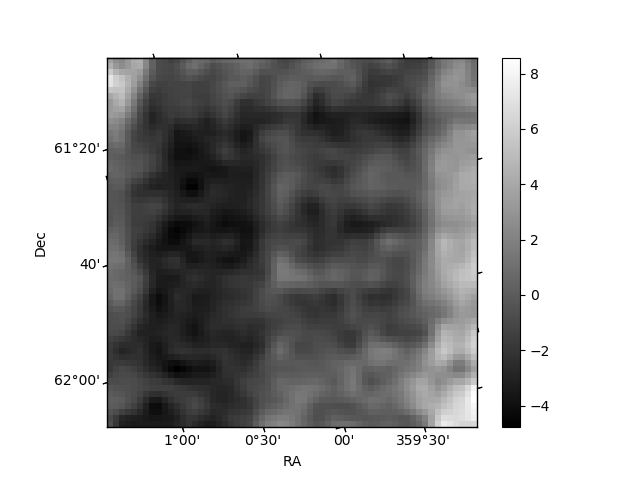
Histogram calculated using DETX and DETY for each event in the final _common_clean file
| Quadrant A | 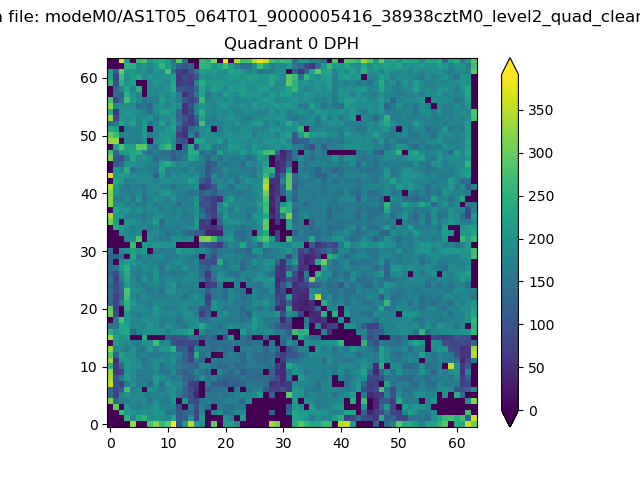 |
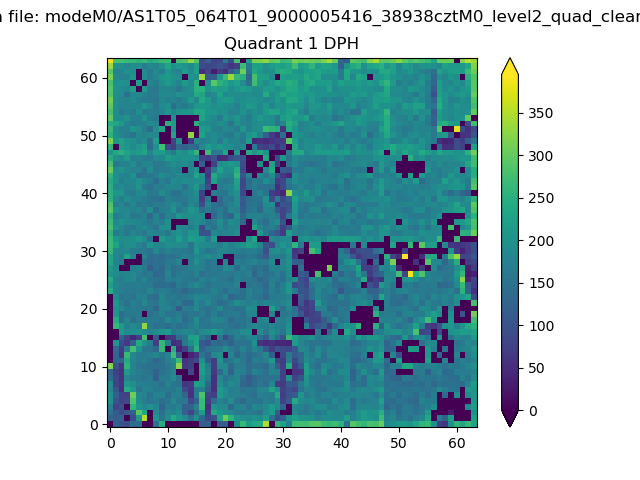 |
Quadrant B |
|---|---|---|---|
| Quadrant D | 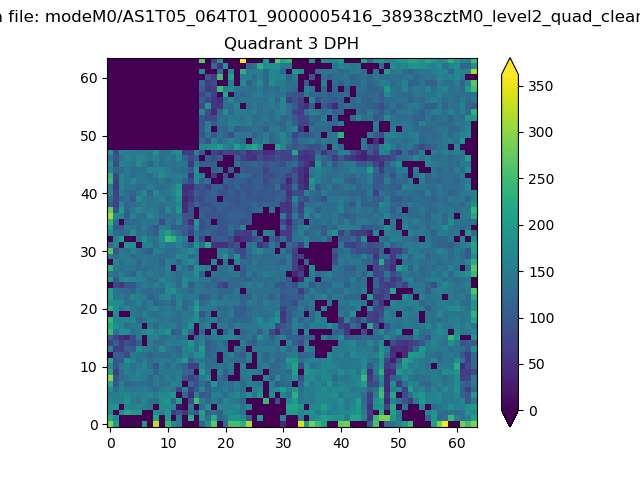 |
 |
Quadrant C |
| Plot type | Count rate plots | Images |
|---|---|---|
| Comparison with Poisson distribution Blue bars denote a histogram of data divided into 1 sec bins. Red curve is a Poisson curve with rate = median count rate of data. |
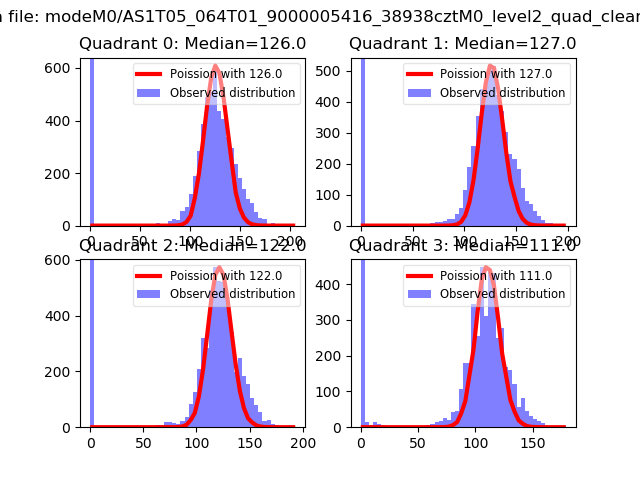 |
 |
| Quadrant-wise count rates Data is divided into 100 sec bins |
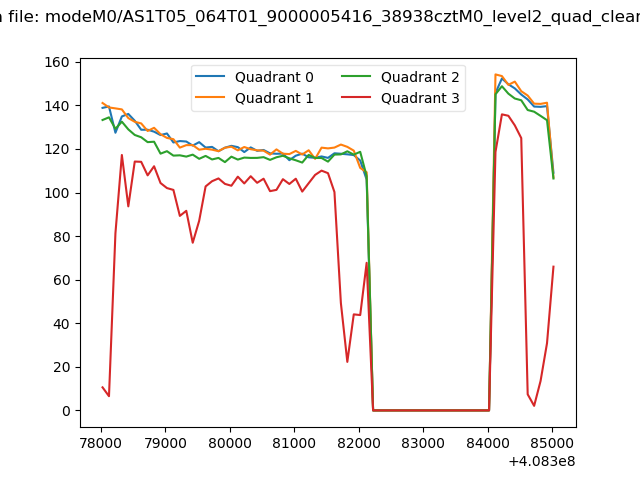 |
|
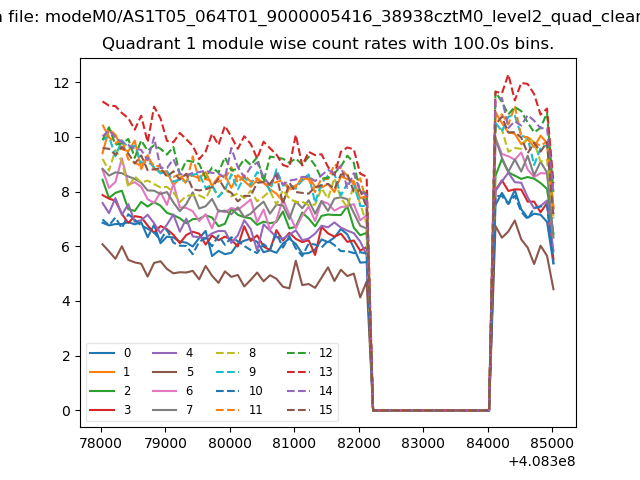
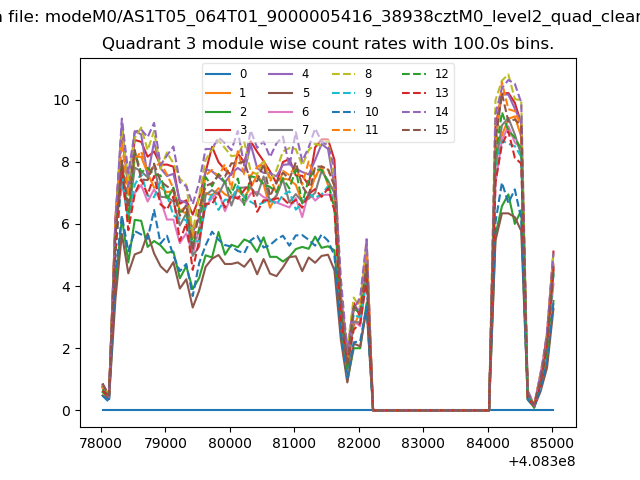
| Module-wise count rates for Quadrant A Data is divided into 100 sec bins |
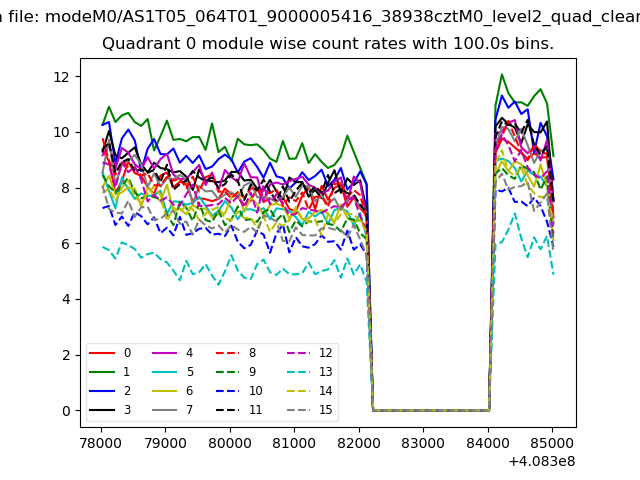 |
 |
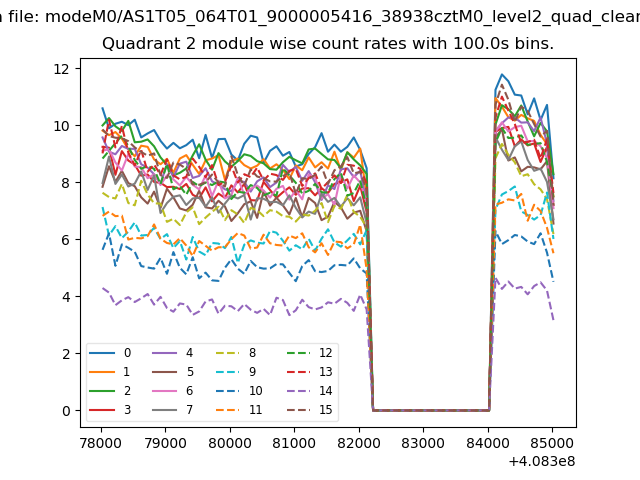
| Module-wise count rates for Quadrant B Data is divided into 100 sec bins |
 |
 |
| Module-wise count rates for Quadrant C Data is divided into 100 sec bins |
 |
 |
| Module-wise count rates for Quadrant D Data is divided into 100 sec bins |
 |
 |
| Parameter | Plot |
|---|---|
| CZT HV Monitor | 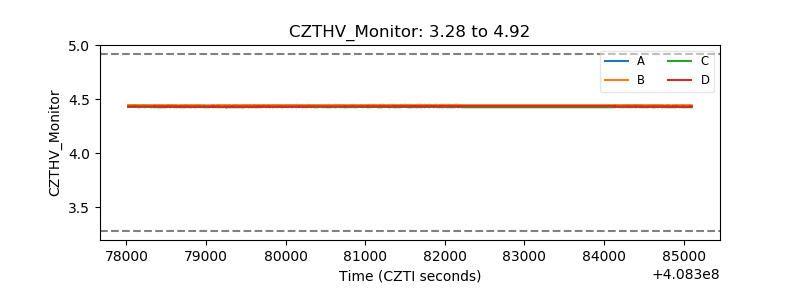 |
| D_VDD | 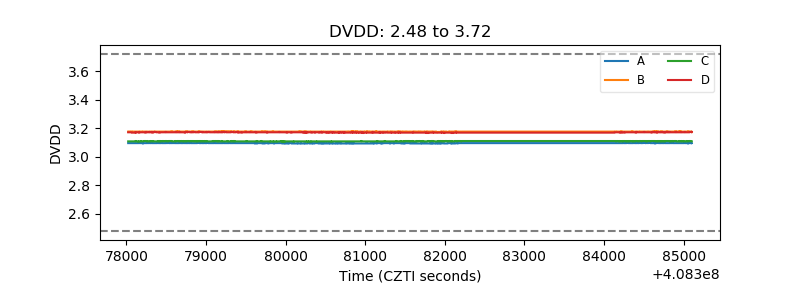 |
| Temperature 1 | 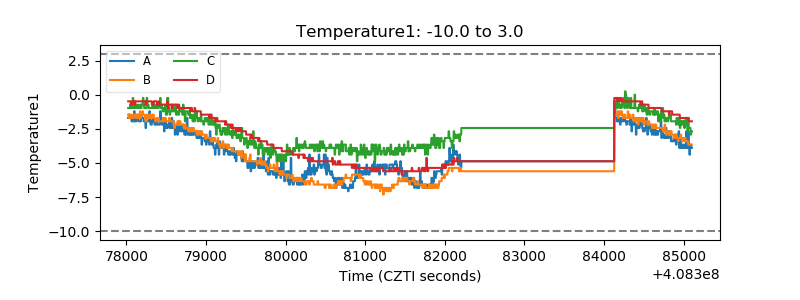 |
| Veto HV Monitor | 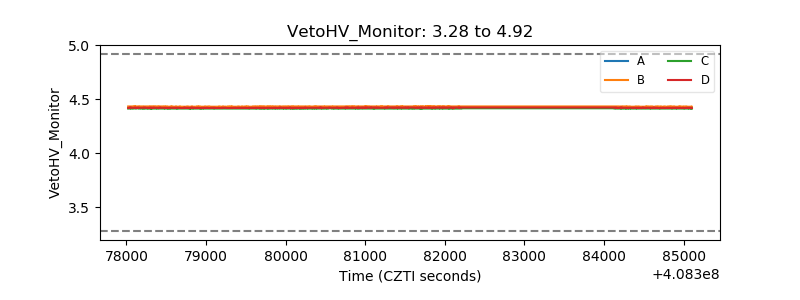 |
| Veto LLD |  |
| Alpha Counter | 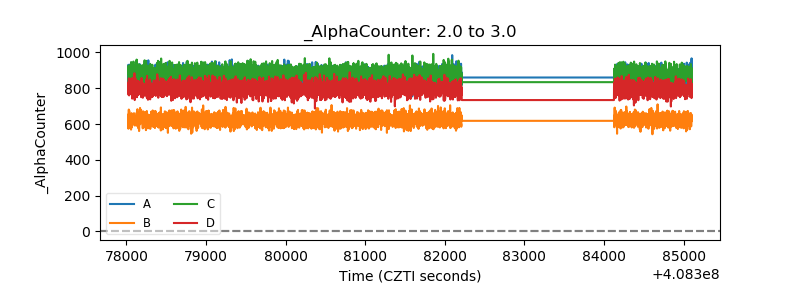 |
| _CPM_Rate | 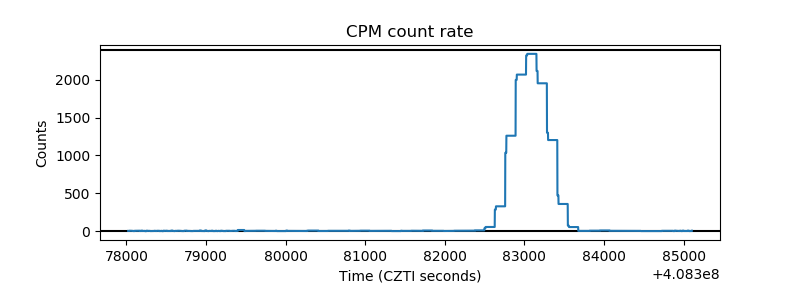 |
| CZT Counter | 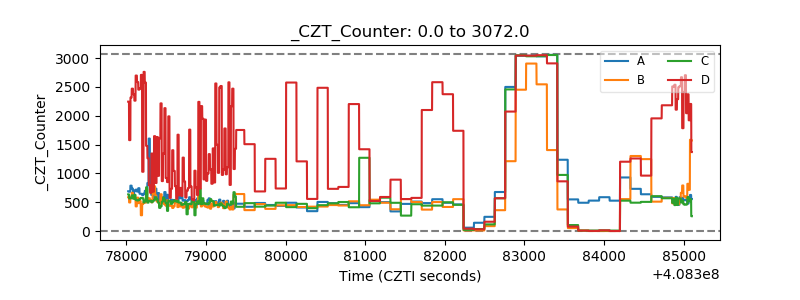 |
| +2.5 Volts monitor |  |
| +5 Volts monitor |  |
| _ROLL_ROT | 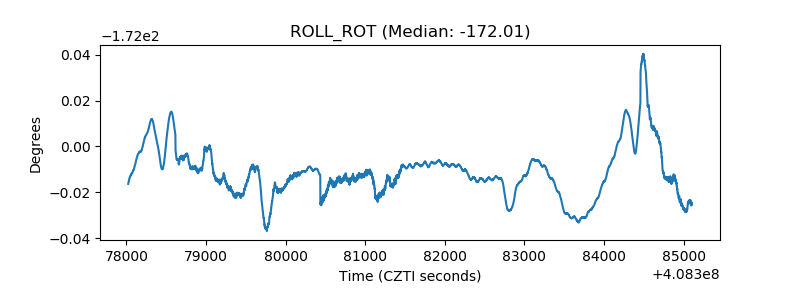 |
| _Roll_DEC | 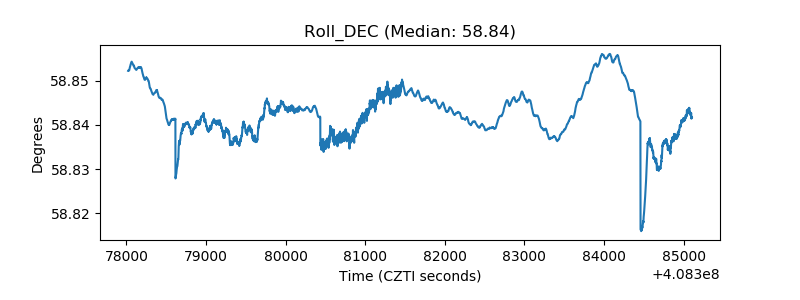 |
| _Roll_RA | 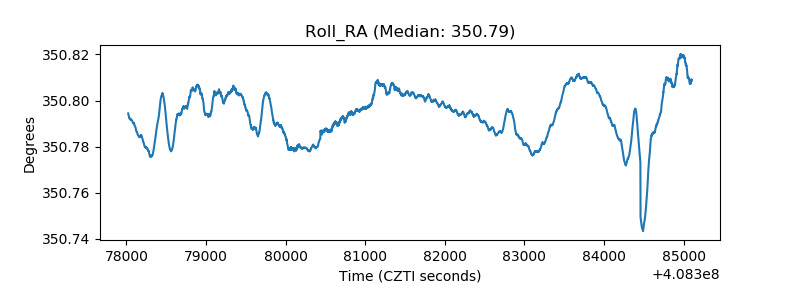 |
| Veto Counter | 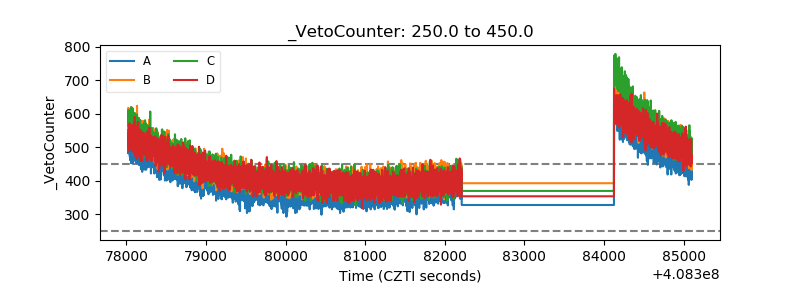 |