| Param | Original file | Final file |
|---|---|---|
| Filename | modeM0/AS1T05_064T01_9000005416_38939cztM0_level2.fits | modeM0/AS1T05_064T01_9000005416_38939cztM0_level2_quad_clean.evt |
| Size (bytes) | 470,180,160 | 92,079,360 |
| Size | 448.4 MB | 87.8 MB |
| Events in quadrant A | 2,859,898 | 674,321 |
| Events in quadrant B | 3,132,589 | 659,798 |
| Events in quadrant C | 2,673,266 | 661,577 |
| Events in quadrant D | 8,339,293 | 432,565 |
| Mode SS | |||
|---|---|---|---|
| Quadrant | BADHDUFLAG | Total packets | Discarded packets |
| A | 0 | 104 | 0 |
| B | 0 | 104 | 0 |
| C | 0 | 104 | 0 |
| D | 0 | 104 | 0 |
| Mode M9 | |||
|---|---|---|---|
| Quadrant | BADHDUFLAG | Total packets | Discarded packets |
| A | 0 | 25 | 0 |
| B | 0 | 25 | 0 |
| C | 0 | 25 | 0 |
| D | 0 | 26 | 0 |
| Mode M0 | |||
|---|---|---|---|
| Quadrant | BADHDUFLAG | Total packets | Discarded packets |
| A | 0 | 11688 | 3 |
| B | 0 | 12640 | 2 |
| C | 0 | 10950 | 2 |
| D | 0 | 28379 | 2 |
| Quadrant | Total seconds | Saturated seconds | Saturation percentage |
|---|---|---|---|
| A | 5140 | 17 | 0.330739% |
| B | 5140 | 206 | 4.007782% |
| C | 5140 | 5 | 0.097276% |
| D | 5140 | 1771 | 34.455253% |
Noise dominated data is calculated using 1-second bins in cleaned event files. If a bin has >2000 counts, and if more than 50% of those come from <1% of pixels, then it is considered to be noise-dominated and hence unusable.
| Quadrant | # 1 sec bins | Bins with >0 counts | Bins with >2000 counts | High rate bins dominated by noise | Noise dominated (total time) | Noise dominated (detector-on time) | Marked lightcurve |
|---|---|---|---|---|---|---|---|
| A | 7174 | 5141 | 10 | 10 | 0.14% | 0.19% | 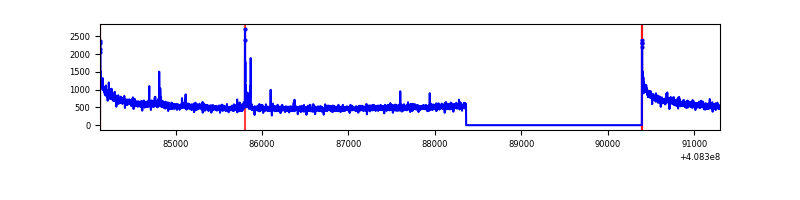 |
| B | 7174 | 5141 | 160 | 160 | 2.23% | 3.11% | 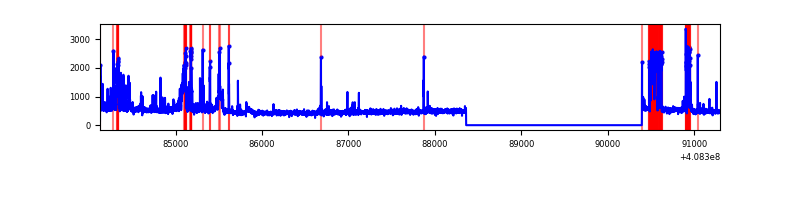 |
| C | 7174 | 5141 | 1 | 1 | 0.01% | 0.02% | 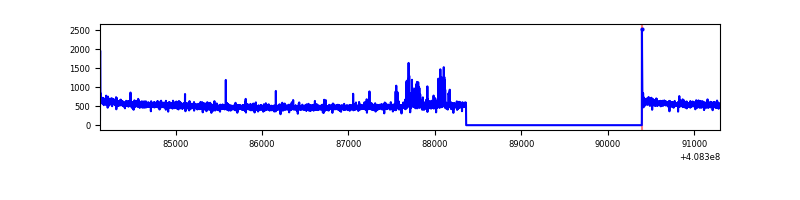 |
| D | 7173 | 5140 | 1846 | 1846 | 25.74% | 35.91% | 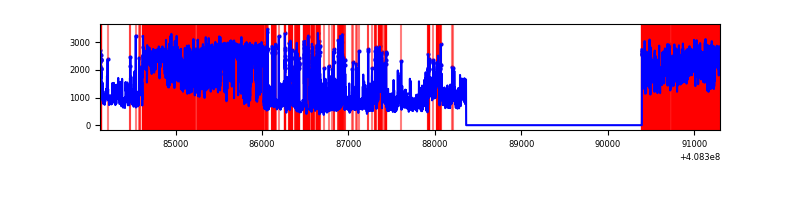 |
Top three noisy pixels from each quadrant. If the there are fewer than three noisy pixels in the level2.evt file, extra rows are filled as -1
| Pixel properties | Quadrant properties | ||||||
|---|---|---|---|---|---|---|---|
| Quadrant | DetID | PixID | Counts | Sigma | Mean | Median | Sigma |
| A | 10 | 83 | 438912 | 3633.45 | 607 | 597 | 120.6 |
| A | 15 | 174 | 30519 | 248.04 | 607 | 597 | 120.6 |
| A | 13 | 248 | 17602 | 140.96 | 607 | 597 | 120.6 |
| B | 5 | 172 | 678608 | 6144.69 | 593 | 578 | 110.3 |
| B | 5 | 200 | 78543 | 706.56 | 593 | 578 | 110.3 |
| B | 0 | 155 | 19777 | 173.99 | 593 | 578 | 110.3 |
| C | 15 | 214 | 213641 | 1539.64 | 605 | 610 | 138.4 |
| C | 14 | 254 | 76378 | 547.6 | 605 | 610 | 138.4 |
| C | 0 | 10 | 12739 | 87.66 | 605 | 610 | 138.4 |
| D | 12 | 235 | 3301403 | 26292.7 | 524 | 511 | 125.5 |
| D | 12 | 227 | 1227815 | 9775.88 | 524 | 511 | 125.5 |
| D | 2 | 250 | 544277 | 4331.28 | 524 | 511 | 125.5 |
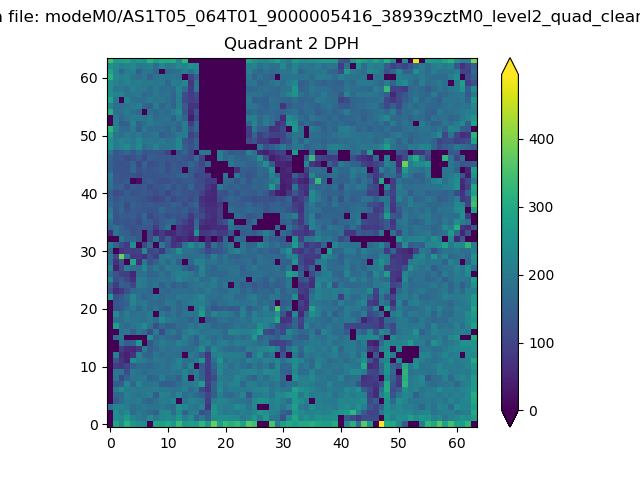
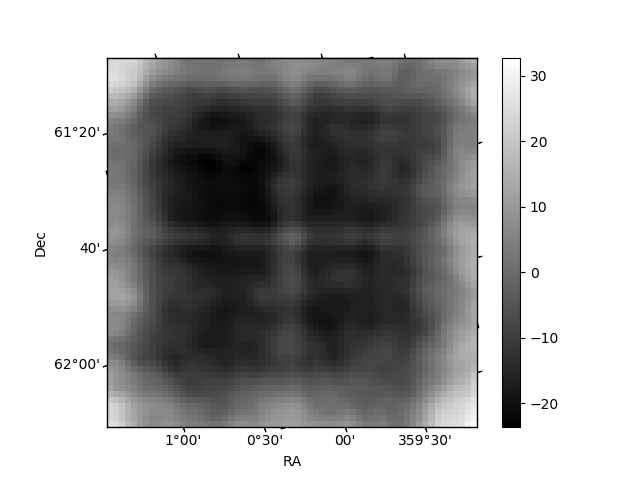
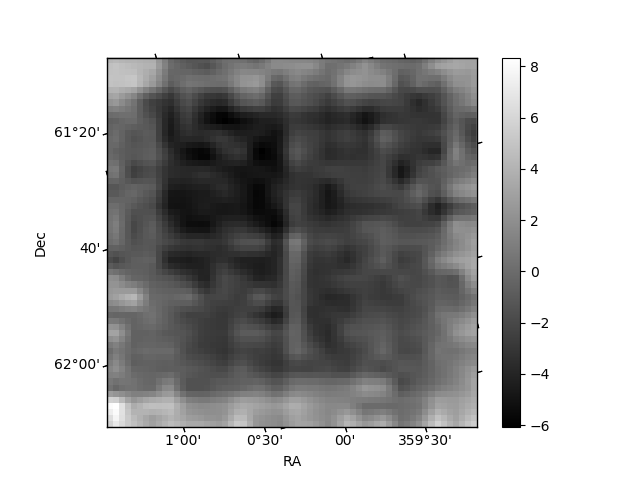
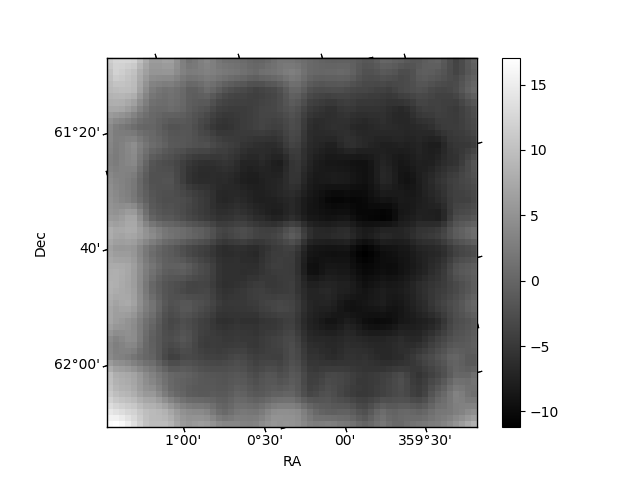
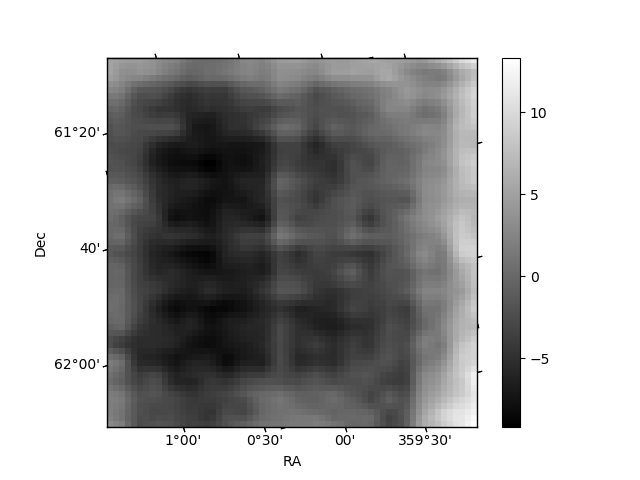
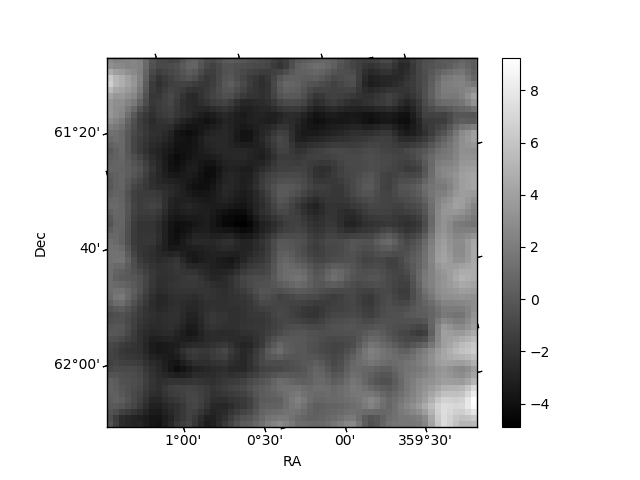
Histogram calculated using DETX and DETY for each event in the final _common_clean file
| Quadrant A | 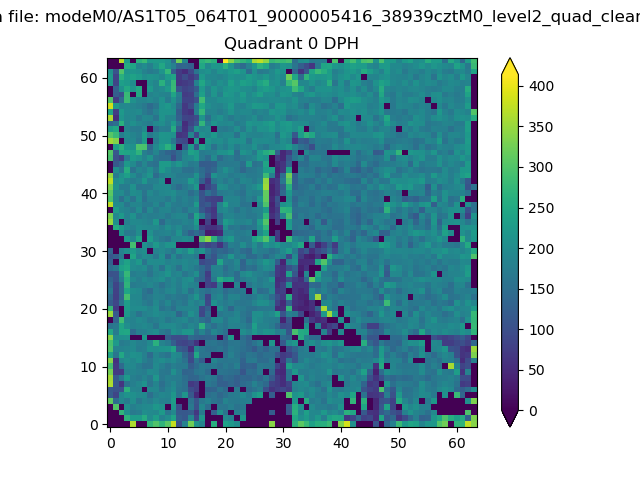 |
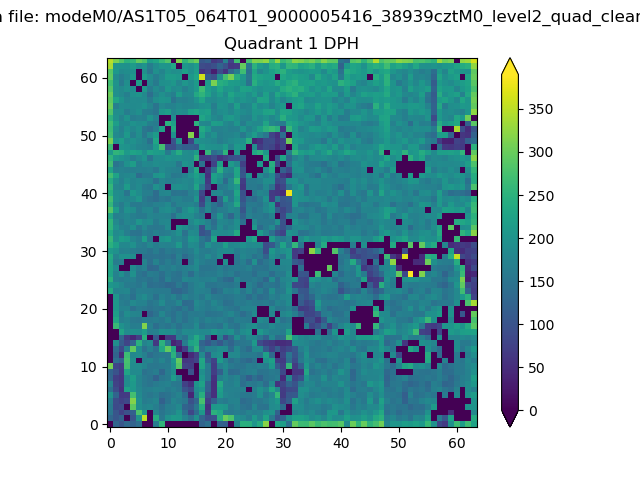 |
Quadrant B |
|---|---|---|---|
| Quadrant D | 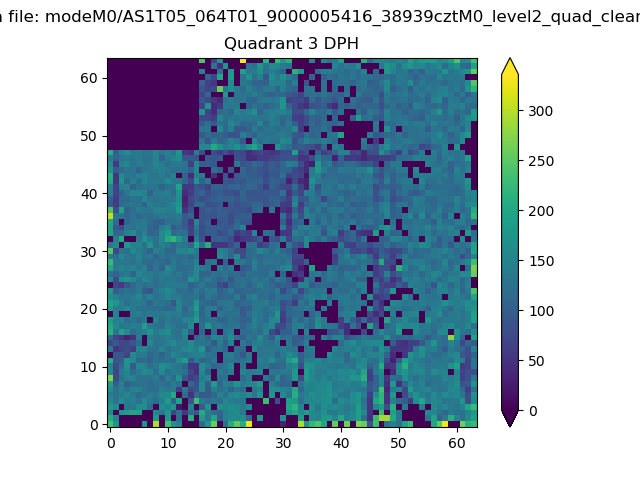 |
 |
Quadrant C |
| Plot type | Count rate plots | Images |
|---|---|---|
| Comparison with Poisson distribution Blue bars denote a histogram of data divided into 1 sec bins. Red curve is a Poisson curve with rate = median count rate of data. |
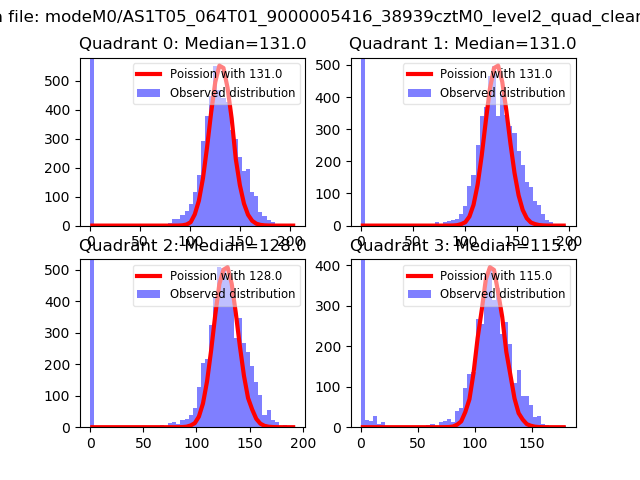 |
 |
| Quadrant-wise count rates Data is divided into 100 sec bins |
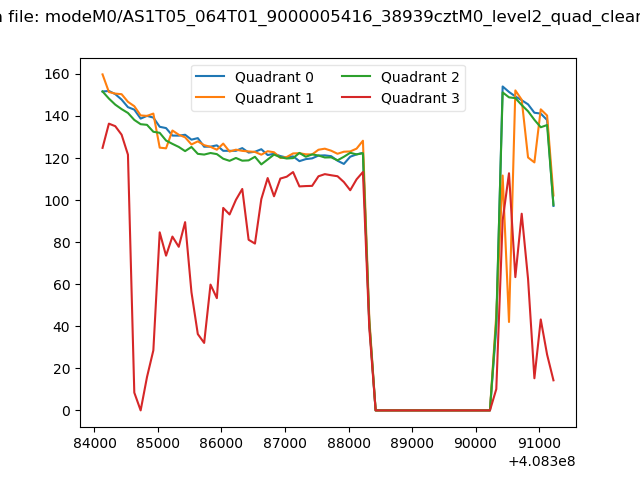 |
|
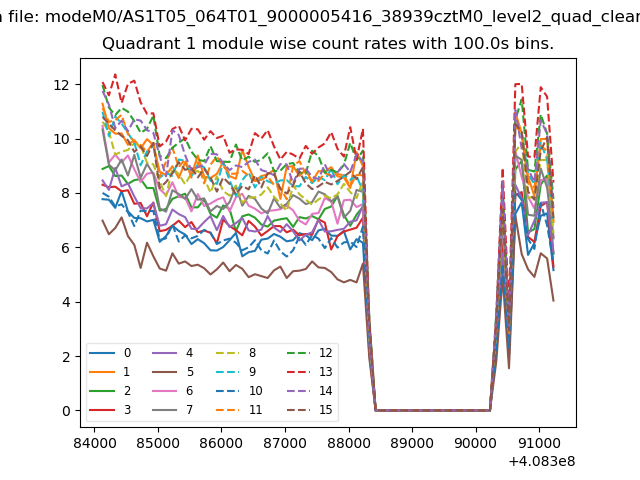
| Module-wise count rates for Quadrant A Data is divided into 100 sec bins |
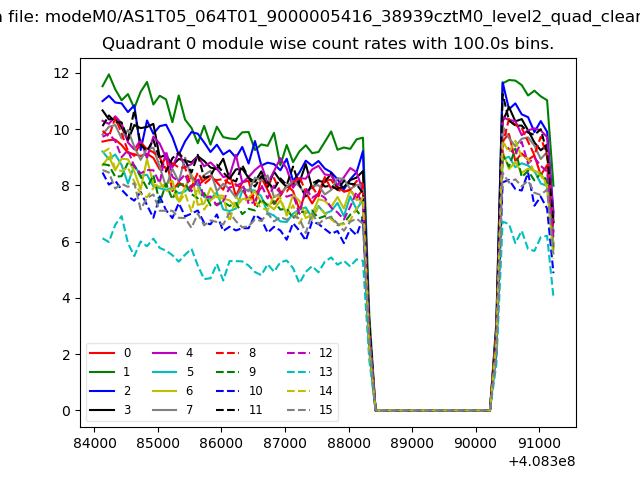 |
 |
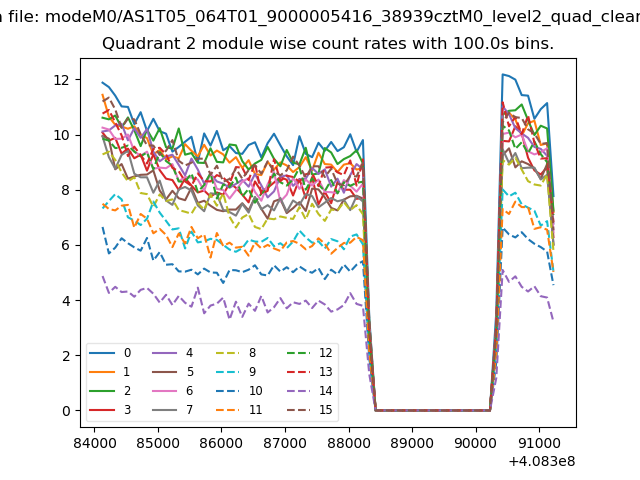
| Module-wise count rates for Quadrant B Data is divided into 100 sec bins |
 |
 |
| Module-wise count rates for Quadrant C Data is divided into 100 sec bins |
 |
 |
| Module-wise count rates for Quadrant D Data is divided into 100 sec bins |
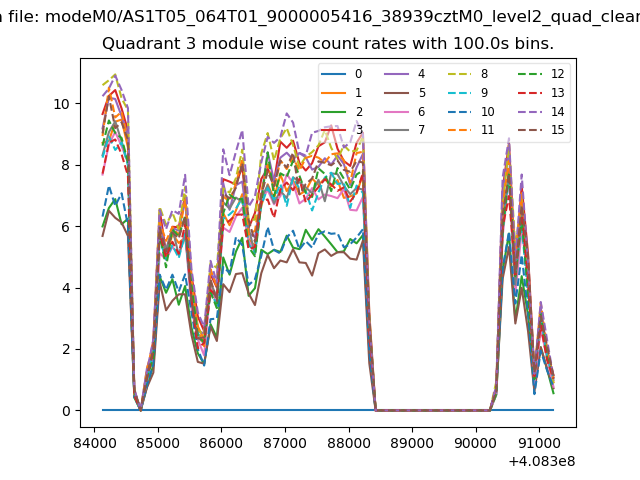 |
 |
| Parameter | Plot |
|---|---|
| CZT HV Monitor | 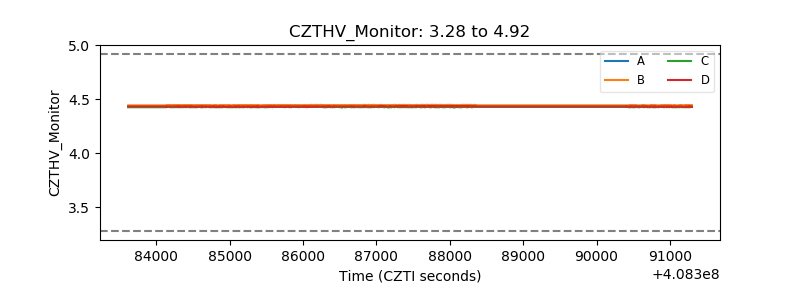 |
| D_VDD | 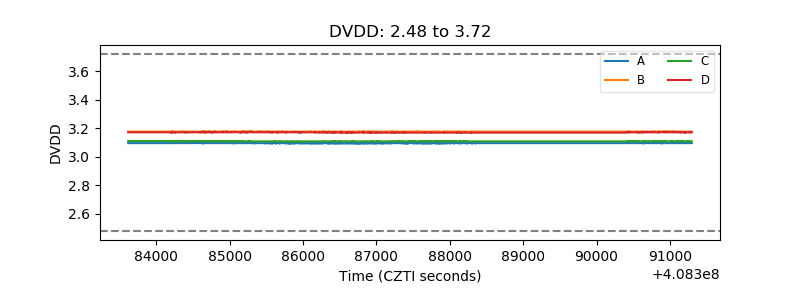 |
| Temperature 1 | 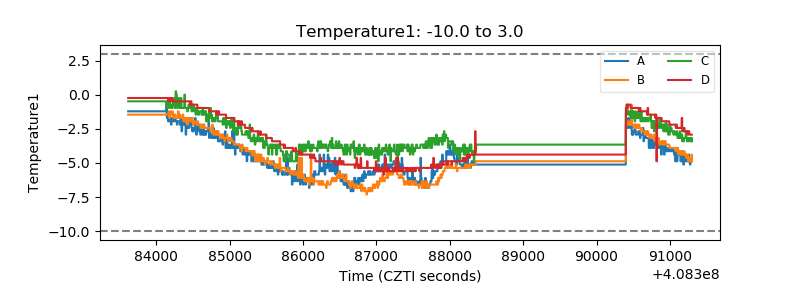 |
| Veto HV Monitor | 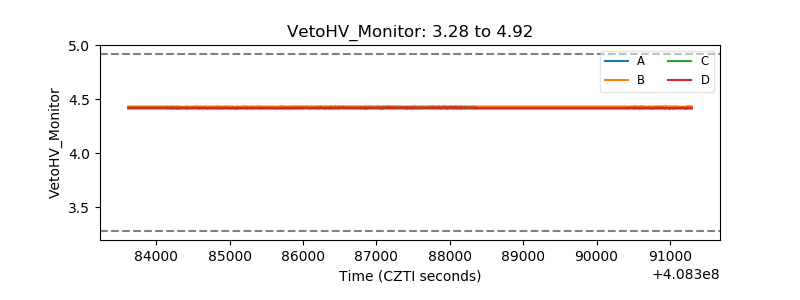 |
| Veto LLD | 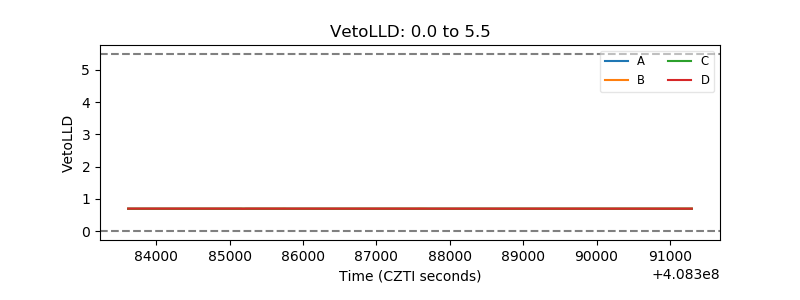 |
| Alpha Counter | 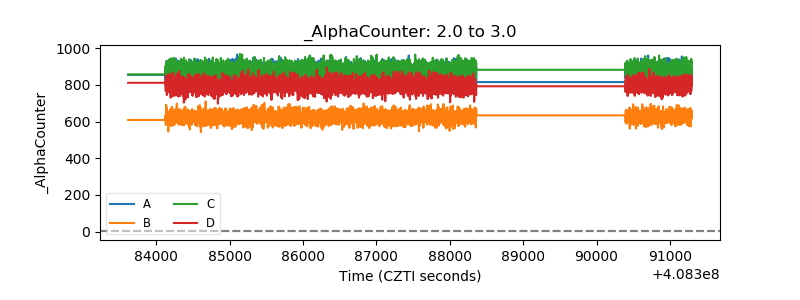 |
| _CPM_Rate | 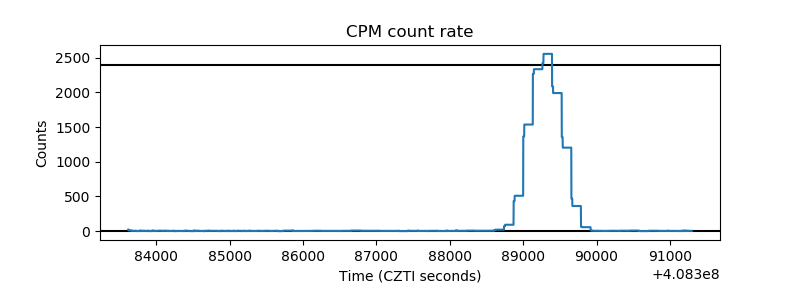 |
| CZT Counter | 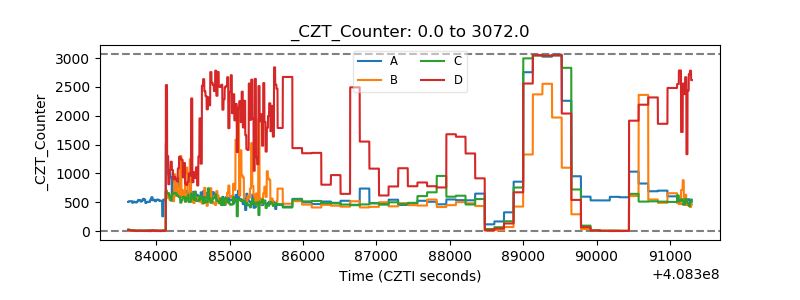 |
| +2.5 Volts monitor | 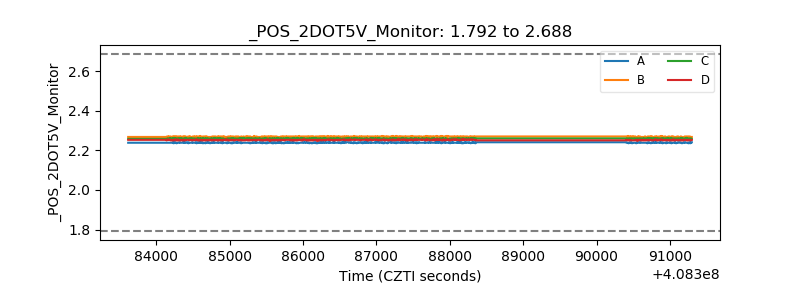 |
| +5 Volts monitor | 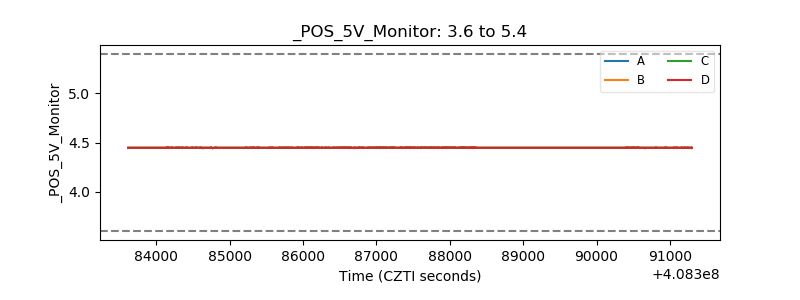 |
| _ROLL_ROT | 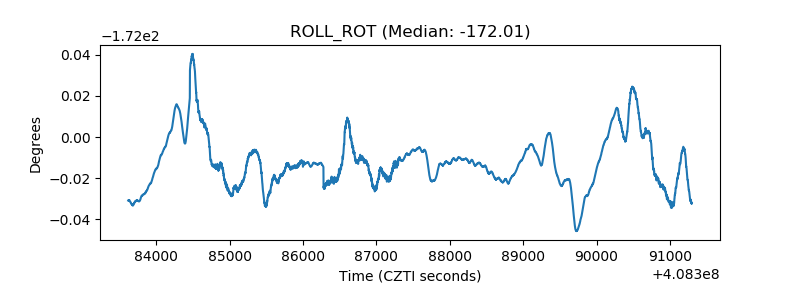 |
| _Roll_DEC | 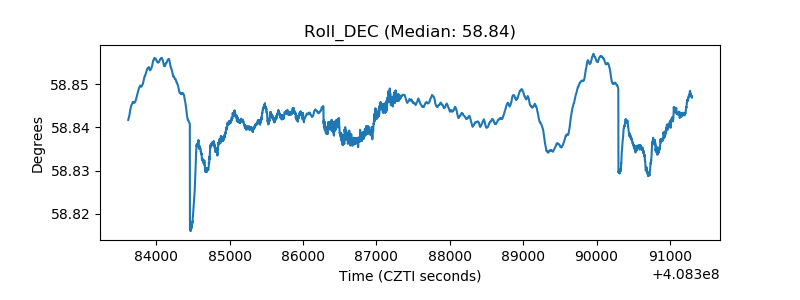 |
| _Roll_RA | 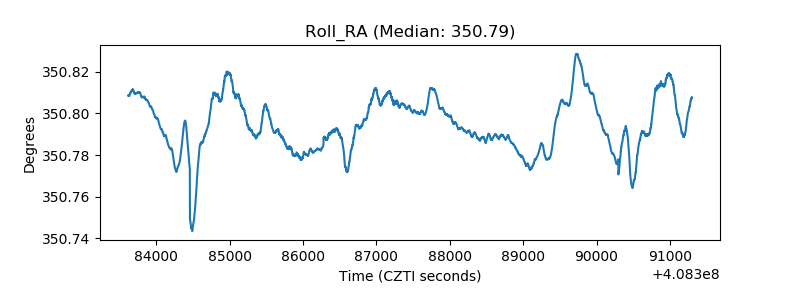 |
| Veto Counter | 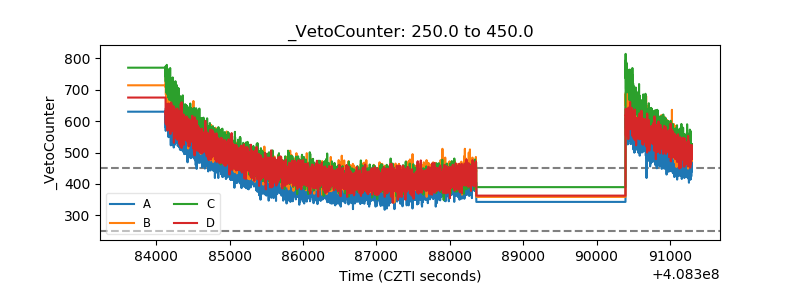 |