| Param | Original file | Final file |
|---|---|---|
| Filename | modeM0/AS1T05_064T01_9000005416_38940cztM0_level2.fits | modeM0/AS1T05_064T01_9000005416_38940cztM0_level2_quad_clean.evt |
| Size (bytes) | 443,266,560 | 88,603,200 |
| Size | 422.7 MB | 84.5 MB |
| Events in quadrant A | 2,757,292 | 639,525 |
| Events in quadrant B | 3,166,959 | 604,787 |
| Events in quadrant C | 2,508,838 | 639,474 |
| Events in quadrant D | 7,590,027 | 451,703 |
| Mode SS | |||
|---|---|---|---|
| Quadrant | BADHDUFLAG | Total packets | Discarded packets |
| A | 0 | 102 | 0 |
| B | 0 | 102 | 0 |
| C | 0 | 102 | 0 |
| D | 0 | 102 | 0 |
| Mode M9 | |||
|---|---|---|---|
| Quadrant | BADHDUFLAG | Total packets | Discarded packets |
| A | 0 | 23 | 0 |
| B | 0 | 23 | 0 |
| C | 0 | 23 | 0 |
| D | 0 | 24 | 0 |
| Mode M0 | |||
|---|---|---|---|
| Quadrant | BADHDUFLAG | Total packets | Discarded packets |
| A | 0 | 11259 | 3 |
| B | 0 | 12629 | 2 |
| C | 0 | 10270 | 2 |
| D | 0 | 26118 | 2 |
| Quadrant | Total seconds | Saturated seconds | Saturation percentage |
|---|---|---|---|
| A | 4954 | 30 | 0.605571% |
| B | 4954 | 406 | 8.195398% |
| C | 4954 | 8 | 0.161486% |
| D | 4954 | 1343 | 27.109407% |
Noise dominated data is calculated using 1-second bins in cleaned event files. If a bin has >2000 counts, and if more than 50% of those come from <1% of pixels, then it is considered to be noise-dominated and hence unusable.
| Quadrant | # 1 sec bins | Bins with >0 counts | Bins with >2000 counts | High rate bins dominated by noise | Noise dominated (total time) | Noise dominated (detector-on time) | Marked lightcurve |
|---|---|---|---|---|---|---|---|
| A | 7076 | 4955 | 24 | 24 | 0.34% | 0.48% | 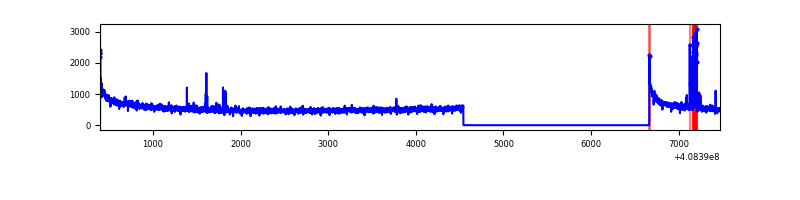 |
| B | 7076 | 4955 | 360 | 360 | 5.09% | 7.27% | 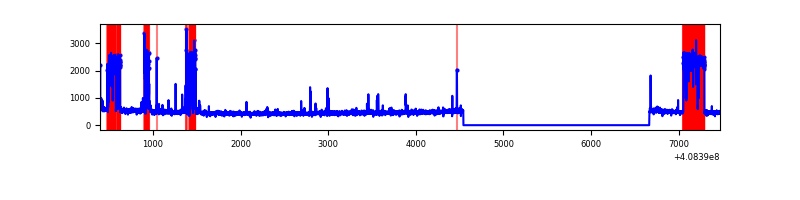 |
| C | 7076 | 4955 | 3 | 3 | 0.04% | 0.06% | 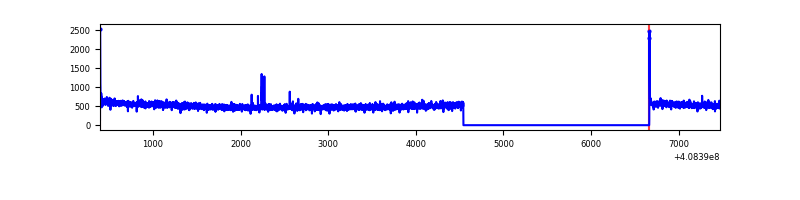 |
| D | 7076 | 4955 | 1478 | 1478 | 20.89% | 29.83% | 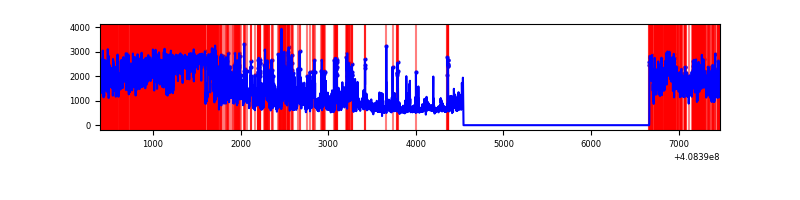 |
Top three noisy pixels from each quadrant. If the there are fewer than three noisy pixels in the level2.evt file, extra rows are filled as -1
| Pixel properties | Quadrant properties | ||||||
|---|---|---|---|---|---|---|---|
| Quadrant | DetID | PixID | Counts | Sigma | Mean | Median | Sigma |
| A | 10 | 83 | 413787 | 3533.91 | 578 | 568 | 116.9 |
| A | 13 | 248 | 90216 | 766.68 | 578 | 568 | 116.9 |
| A | 12 | 189 | 11139 | 90.4 | 578 | 568 | 116.9 |
| B | 5 | 172 | 980597 | 9499.76 | 549 | 534 | 103.2 |
| B | 0 | 230 | 16616 | 155.88 | 549 | 534 | 103.2 |
| B | 12 | 111 | 12201 | 113.09 | 549 | 534 | 103.2 |
| C | 15 | 214 | 206623 | 1549.73 | 580 | 585 | 133.0 |
| C | 0 | 10 | 17199 | 124.96 | 580 | 585 | 133.0 |
| C | 14 | 254 | 12355 | 88.53 | 580 | 585 | 133.0 |
| D | 12 | 235 | 3375236 | 26776.97 | 523 | 509 | 126.0 |
| D | 12 | 227 | 766831 | 6080.43 | 523 | 509 | 126.0 |
| D | 14 | 52 | 536175 | 4250.27 | 523 | 509 | 126.0 |
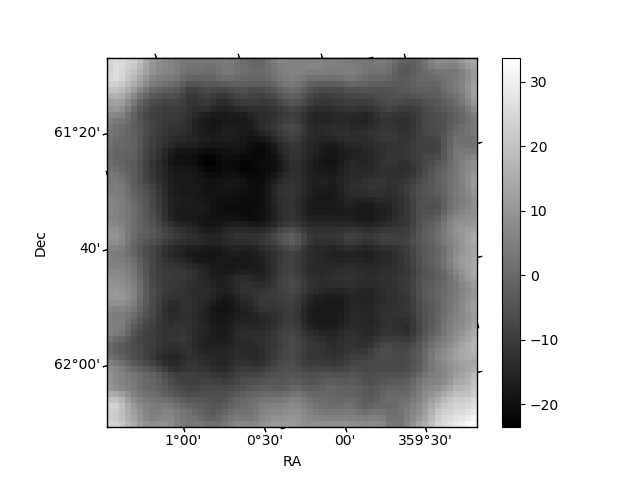
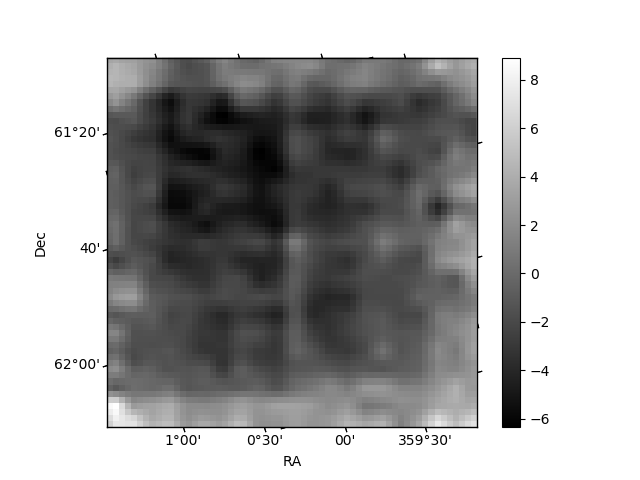
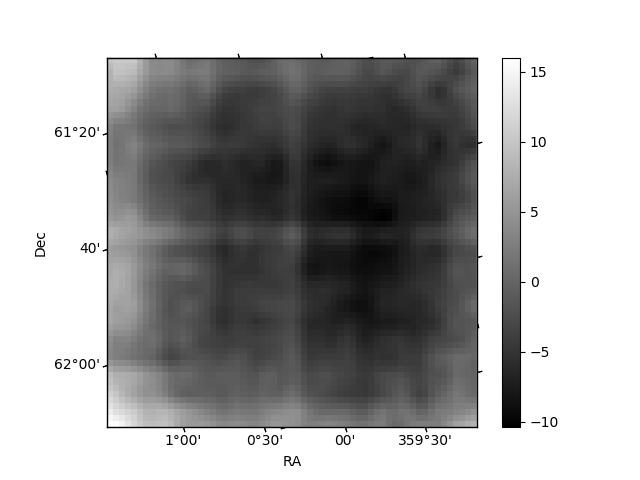
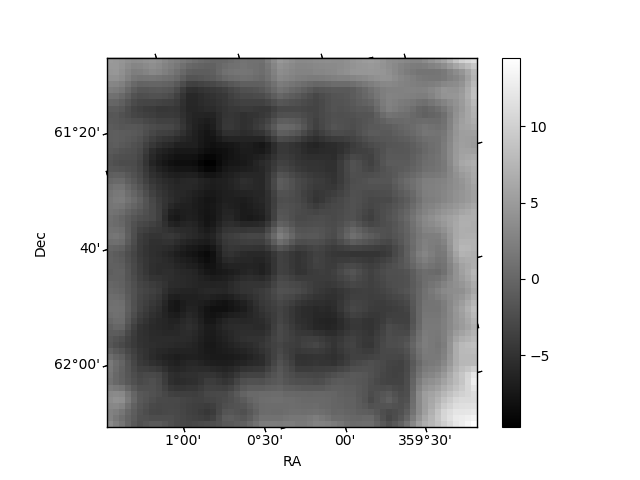
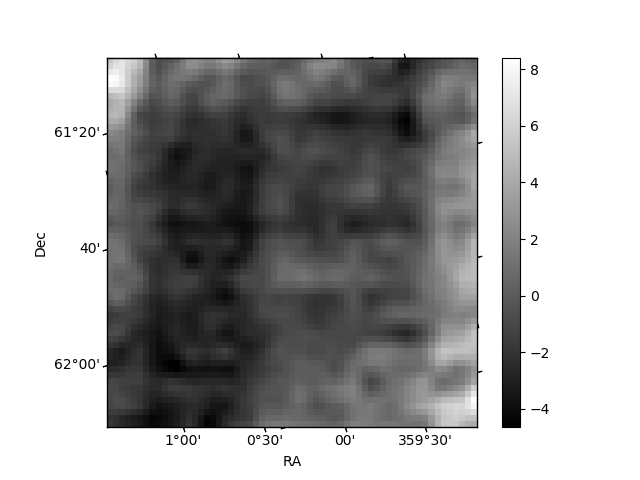
Histogram calculated using DETX and DETY for each event in the final _common_clean file
| Quadrant A | 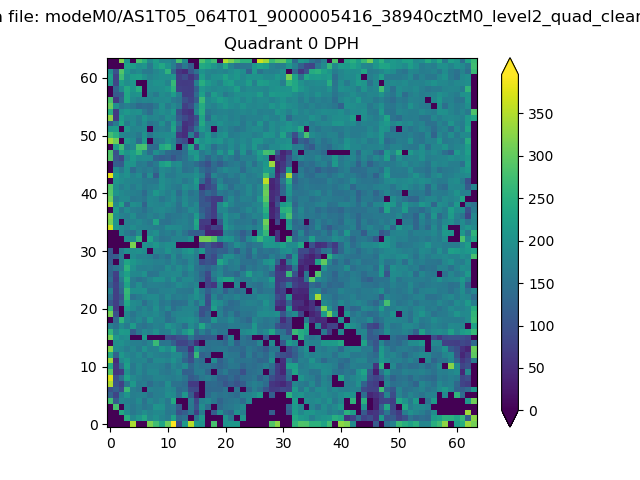 |
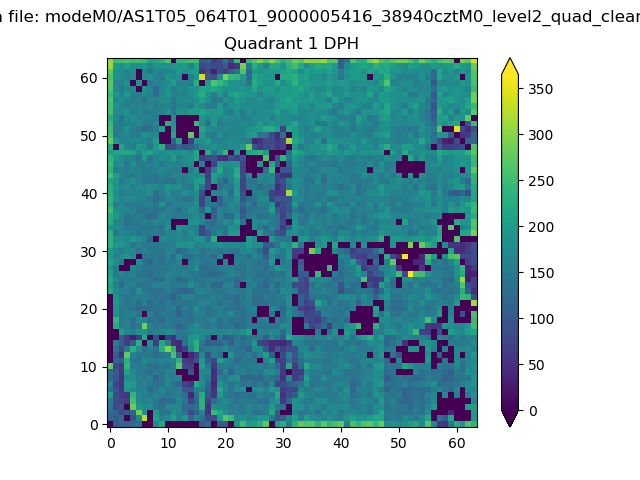 |
Quadrant B |
|---|---|---|---|
| Quadrant D | 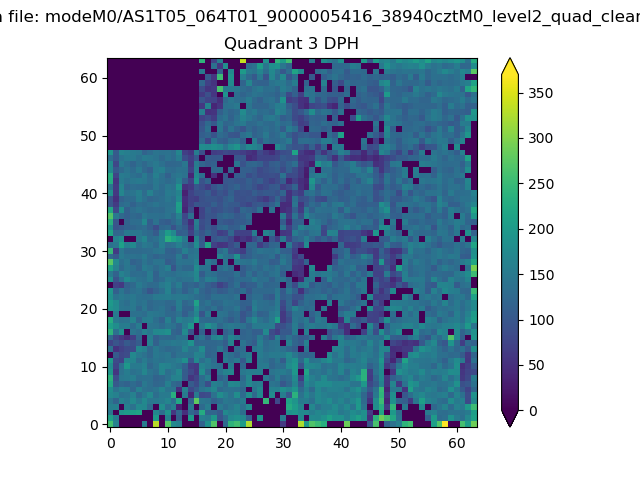 |
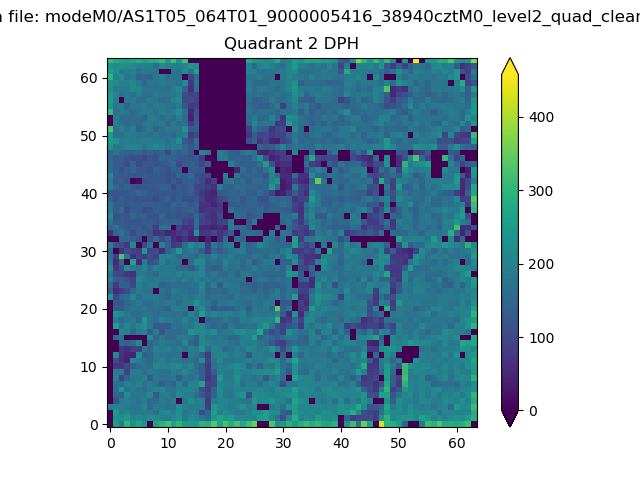 |
Quadrant C |
| Plot type | Count rate plots | Images |
|---|---|---|
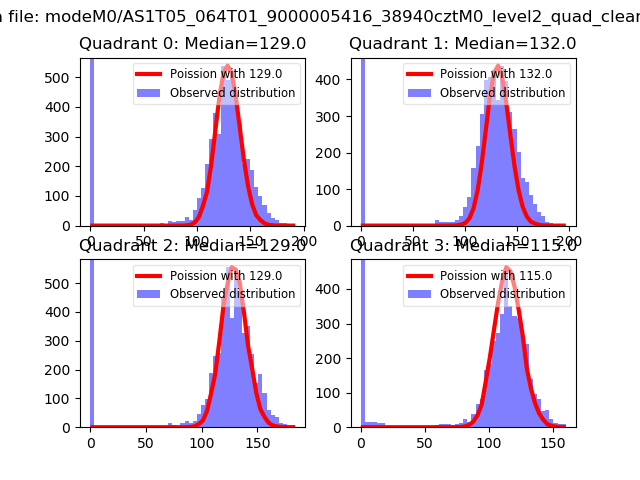
| Comparison with Poisson distribution Blue bars denote a histogram of data divided into 1 sec bins. Red curve is a Poisson curve with rate = median count rate of data. |
 |
 |
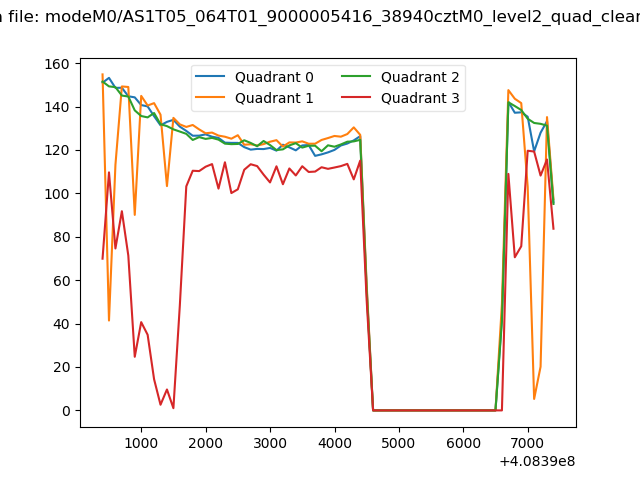
| Quadrant-wise count rates Data is divided into 100 sec bins |
 |
|
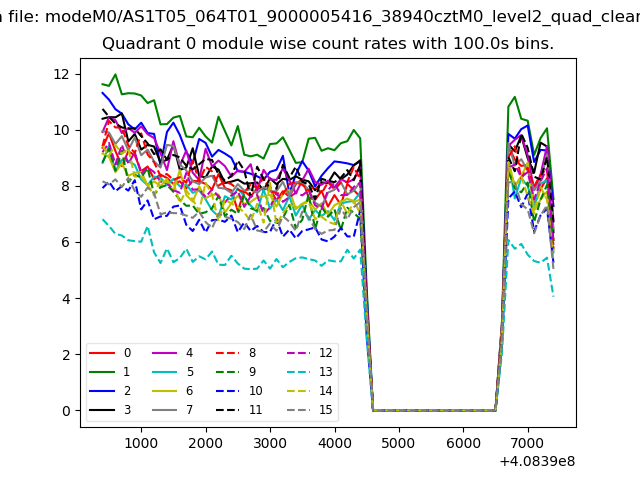
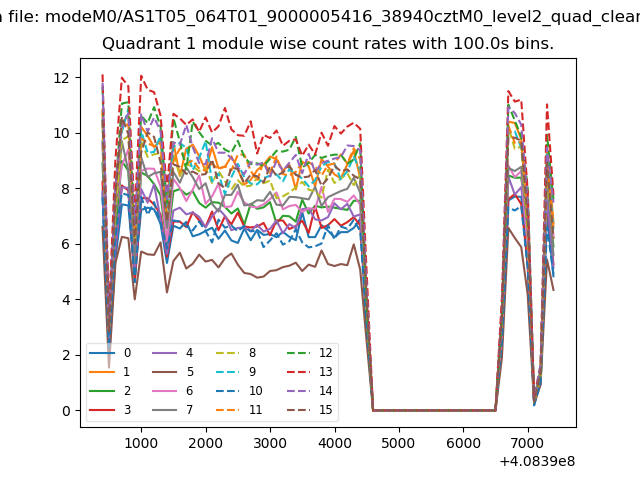
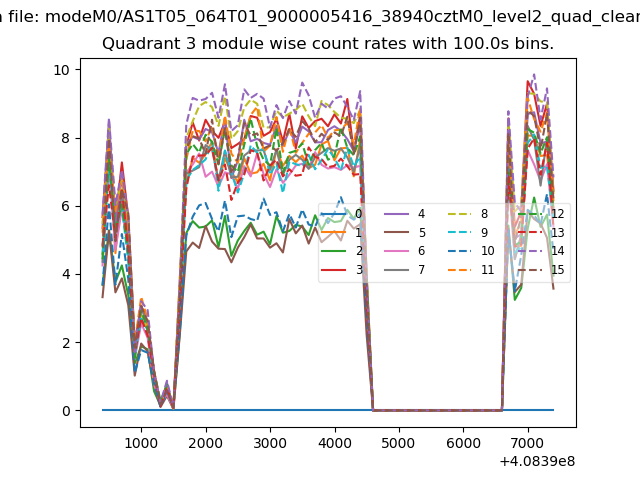
| Module-wise count rates for Quadrant A Data is divided into 100 sec bins |
 |
 |
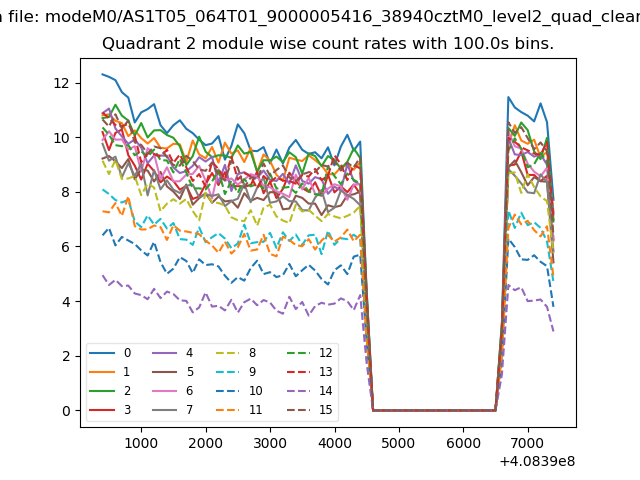
| Module-wise count rates for Quadrant B Data is divided into 100 sec bins |
 |
 |
| Module-wise count rates for Quadrant C Data is divided into 100 sec bins |
 |
 |
| Module-wise count rates for Quadrant D Data is divided into 100 sec bins |
 |
 |
| Parameter | Plot |
|---|---|
| CZT HV Monitor | 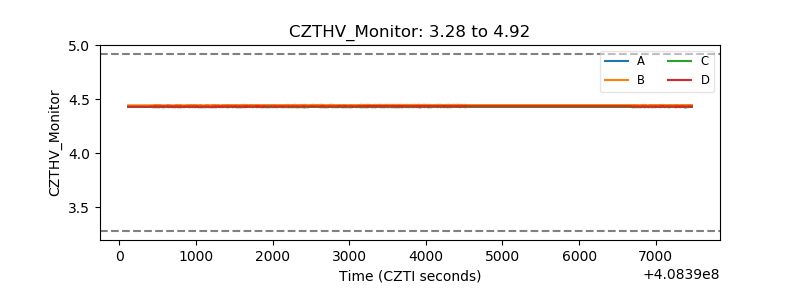 |
| D_VDD | 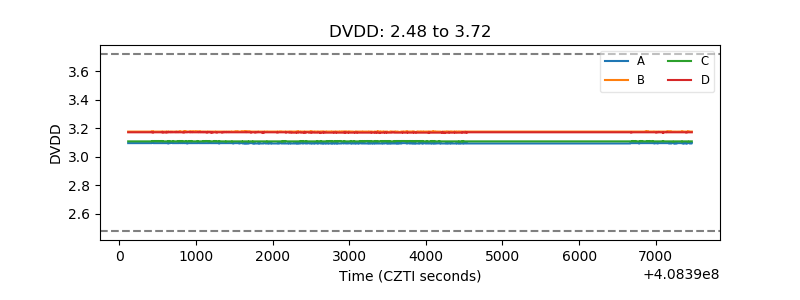 |
| Temperature 1 | 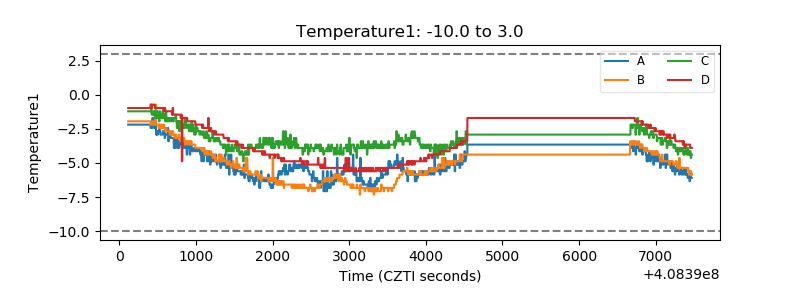 |
| Veto HV Monitor | 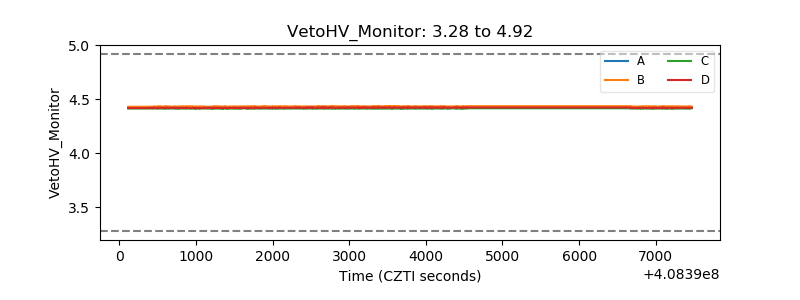 |
| Veto LLD | 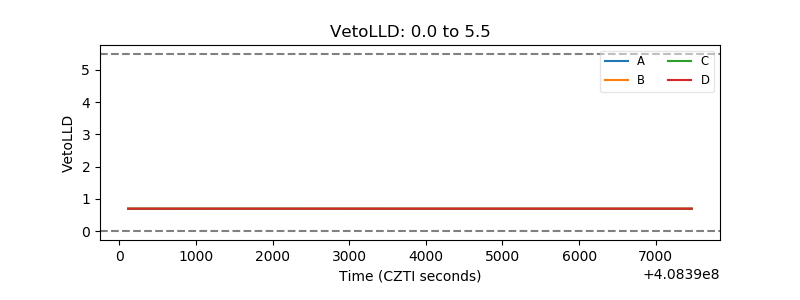 |
| Alpha Counter | 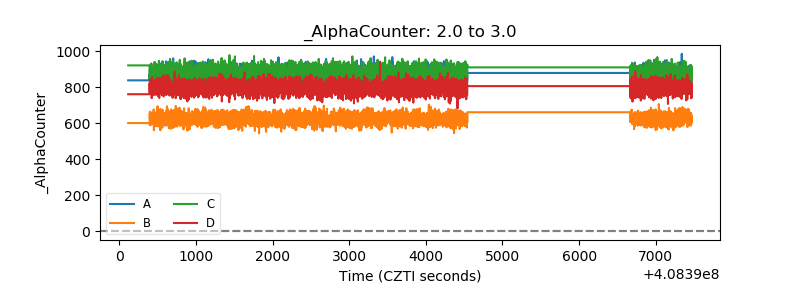 |
| _CPM_Rate | 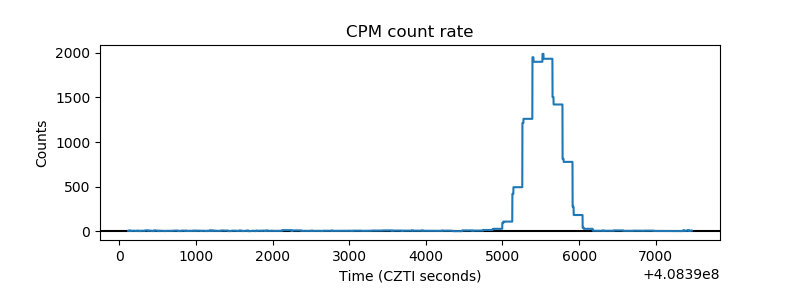 |
| CZT Counter | 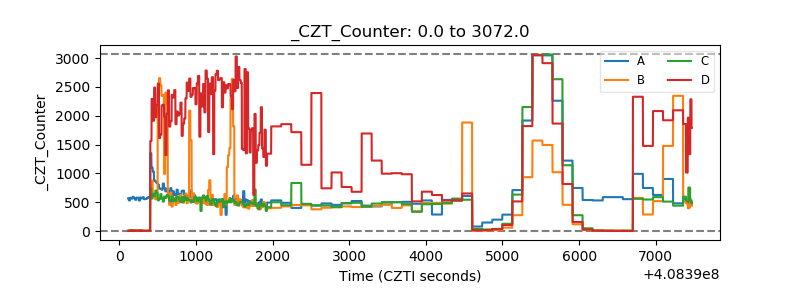 |
| +2.5 Volts monitor |  |
| +5 Volts monitor | 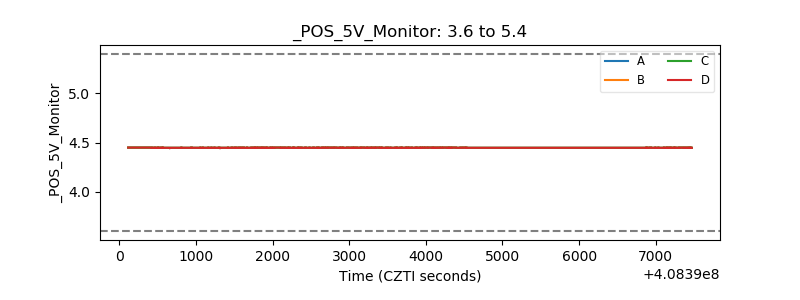 |
| _ROLL_ROT | 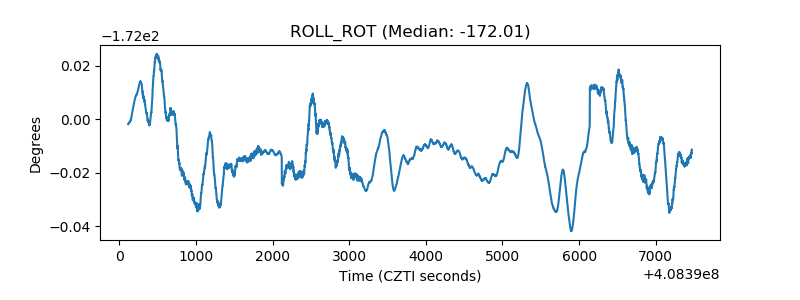 |
| _Roll_DEC | 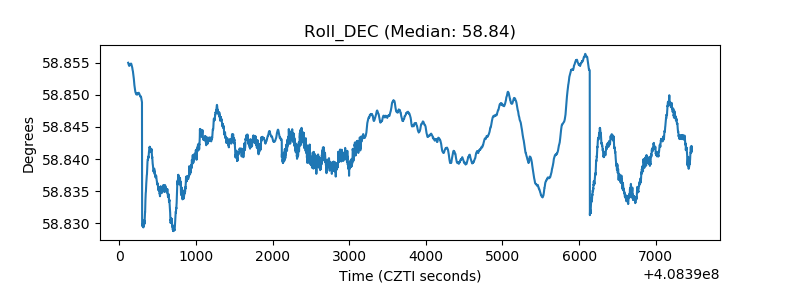 |
| _Roll_RA | 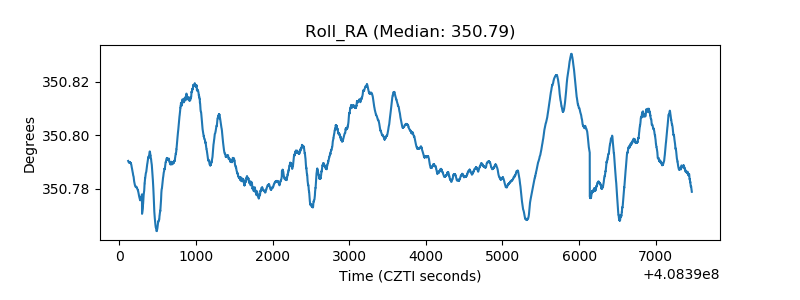 |
| Veto Counter | 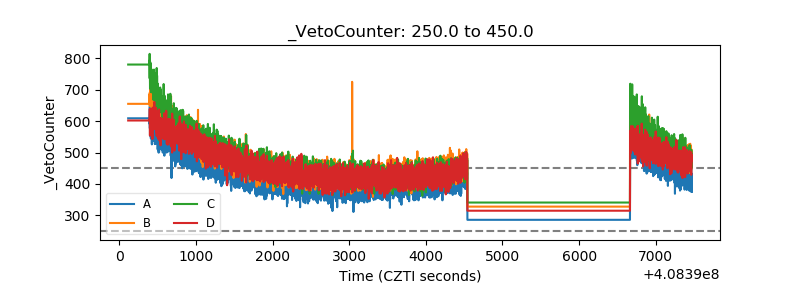 |