| Param | Original file | Final file |
|---|---|---|
| Filename | modeM0/AS1T05_064T01_9000005416_38941cztM0_level2.fits | modeM0/AS1T05_064T01_9000005416_38941cztM0_level2_quad_clean.evt |
| Size (bytes) | 412,289,280 | 86,166,720 |
| Size | 393.2 MB | 82.2 MB |
| Events in quadrant A | 3,356,154 | 572,199 |
| Events in quadrant B | 2,681,759 | 590,987 |
| Events in quadrant C | 2,375,566 | 600,977 |
| Events in quadrant D | 6,469,427 | 503,352 |
| Mode SS | |||
|---|---|---|---|
| Quadrant | BADHDUFLAG | Total packets | Discarded packets |
| A | 0 | 98 | 0 |
| B | 0 | 98 | 0 |
| C | 0 | 98 | 0 |
| D | 0 | 98 | 0 |
| Mode M9 | |||
|---|---|---|---|
| Quadrant | BADHDUFLAG | Total packets | Discarded packets |
| A | 0 | 32 | 0 |
| B | 0 | 32 | 0 |
| C | 0 | 32 | 0 |
| D | 0 | 33 | 0 |
| Mode M0 | |||
|---|---|---|---|
| Quadrant | BADHDUFLAG | Total packets | Discarded packets |
| A | 0 | 12994 | 3 |
| B | 0 | 11197 | 2 |
| C | 0 | 9909 | 2 |
| D | 0 | 22705 | 15 |
| Quadrant | Total seconds | Saturated seconds | Saturation percentage |
|---|---|---|---|
| A | 4875 | 282 | 5.784615% |
| B | 4875 | 220 | 4.512821% |
| C | 4875 | 6 | 0.123077% |
| D | 4873 | 621 | 12.743690% |
Noise dominated data is calculated using 1-second bins in cleaned event files. If a bin has >2000 counts, and if more than 50% of those come from <1% of pixels, then it is considered to be noise-dominated and hence unusable.
| Quadrant | # 1 sec bins | Bins with >0 counts | Bins with >2000 counts | High rate bins dominated by noise | Noise dominated (total time) | Noise dominated (detector-on time) | Marked lightcurve |
|---|---|---|---|---|---|---|---|
| A | 6999 | 4876 | 236 | 236 | 3.37% | 4.84% | 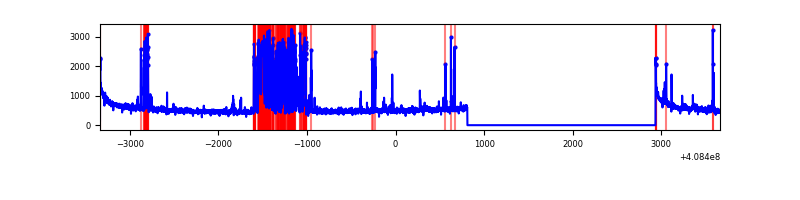 |
| B | 6999 | 4876 | 208 | 208 | 2.97% | 4.27% | 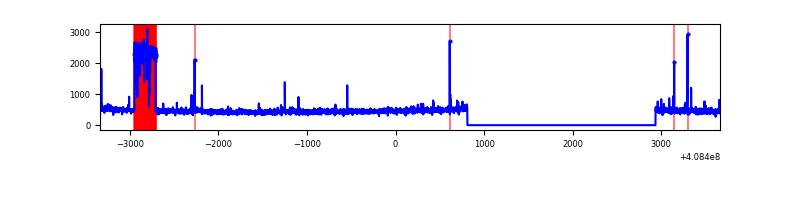 |
| C | 6999 | 4876 | 2 | 2 | 0.03% | 0.04% | 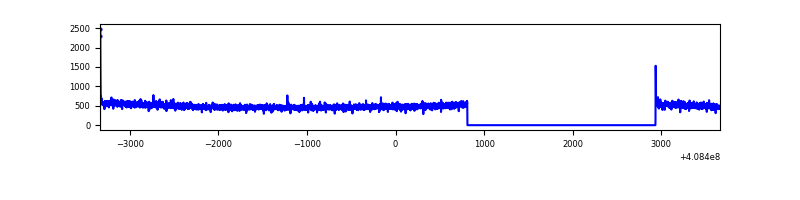 |
| D | 6999 | 4875 | 770 | 770 | 11.00% | 15.79% | 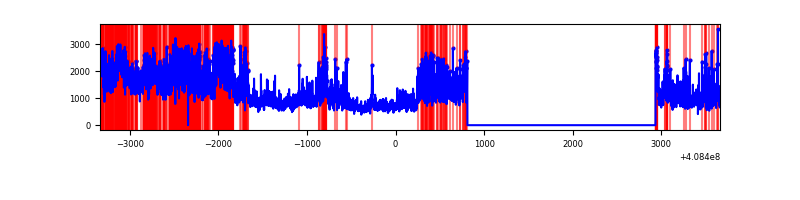 |
Top three noisy pixels from each quadrant. If the there are fewer than three noisy pixels in the level2.evt file, extra rows are filled as -1
| Pixel properties | Quadrant properties | ||||||
|---|---|---|---|---|---|---|---|
| Quadrant | DetID | PixID | Counts | Sigma | Mean | Median | Sigma |
| A | 15 | 222 | 786516 | 7294.85 | 536 | 527 | 107.7 |
| A | 10 | 83 | 388249 | 3598.49 | 536 | 527 | 107.7 |
| A | 13 | 248 | 95454 | 881.03 | 536 | 527 | 107.7 |
| B | 5 | 172 | 541642 | 5312.54 | 537 | 522 | 101.9 |
| B | 12 | 111 | 12388 | 116.5 | 537 | 522 | 101.9 |
| B | 0 | 230 | 11404 | 106.84 | 537 | 522 | 101.9 |
| C | 15 | 214 | 202396 | 1577.96 | 552 | 557 | 127.9 |
| C | 0 | 10 | 13985 | 104.98 | 552 | 557 | 127.9 |
| C | 13 | 61 | 3726 | 24.78 | 552 | 557 | 127.9 |
| D | 12 | 235 | 2545426 | 19972.43 | 524 | 511 | 127.4 |
| D | 12 | 227 | 907454 | 7117.67 | 524 | 511 | 127.4 |
| D | 2 | 249 | 292693 | 2293.04 | 524 | 511 | 127.4 |
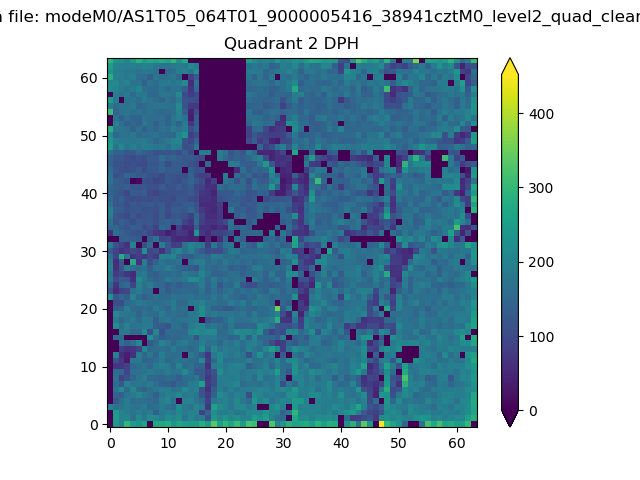
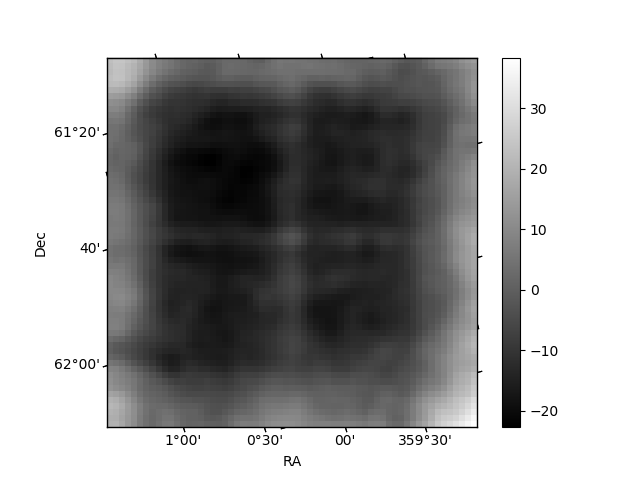
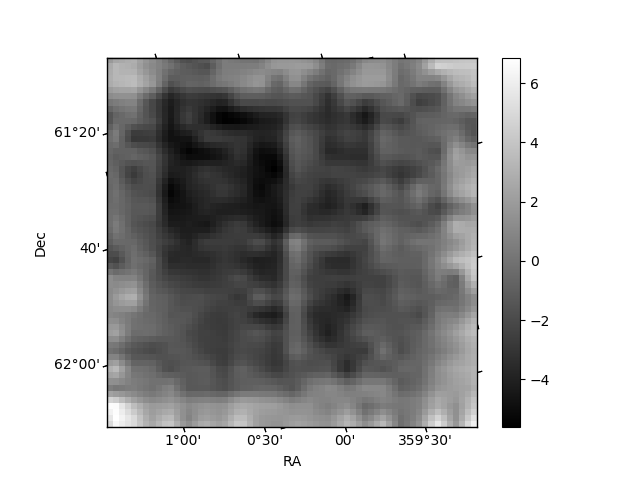
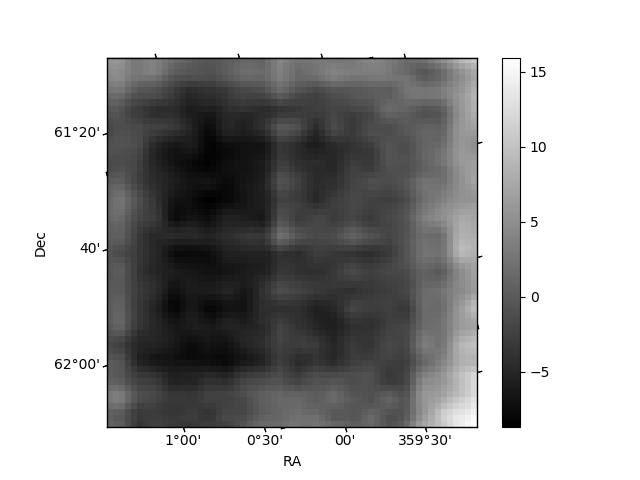
Histogram calculated using DETX and DETY for each event in the final _common_clean file
| Quadrant A | 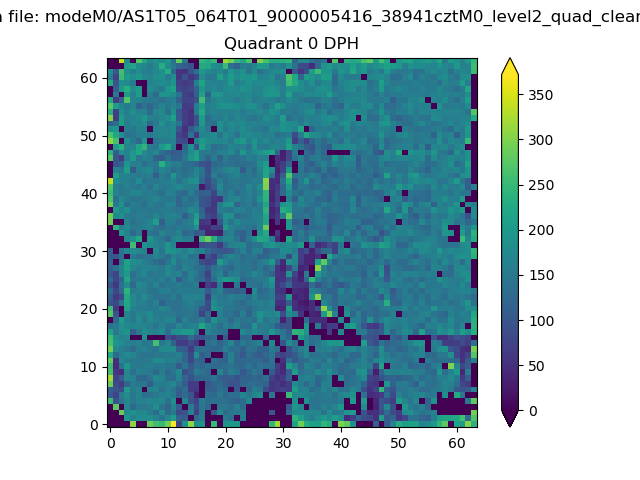 |
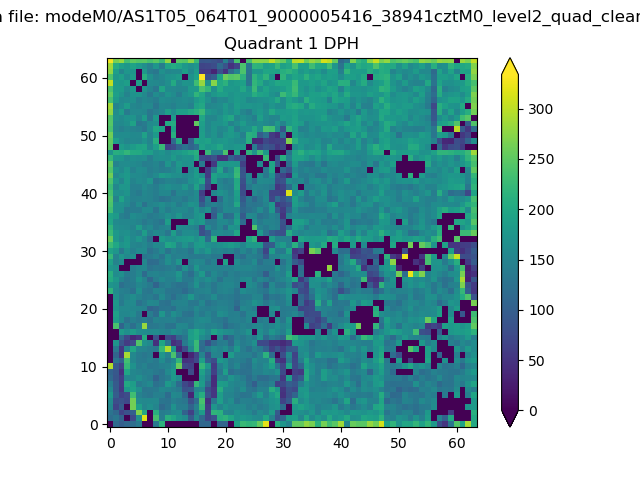 |
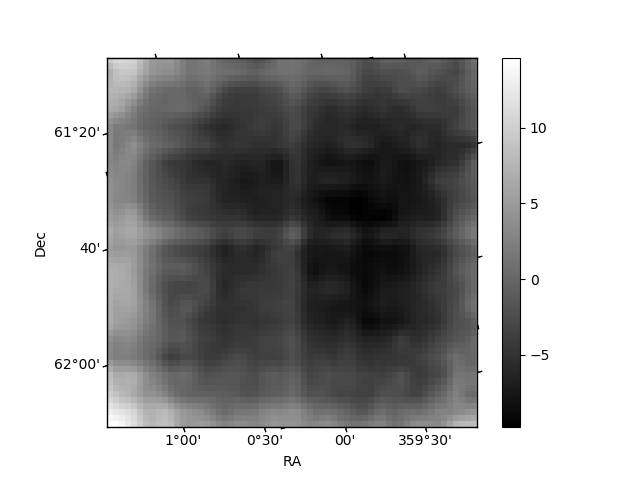
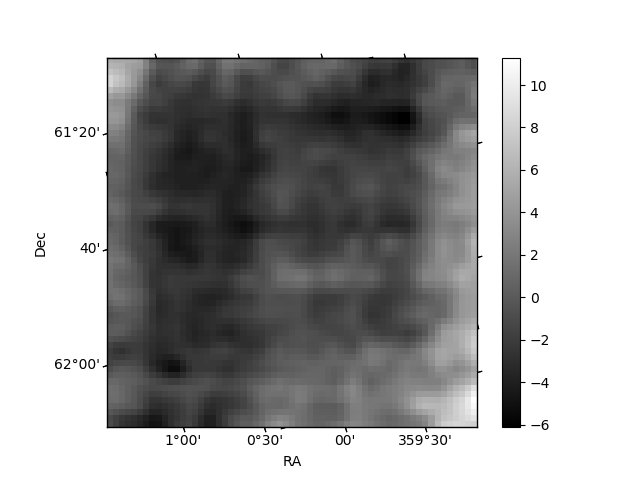
Quadrant B |
|---|---|---|---|
| Quadrant D | 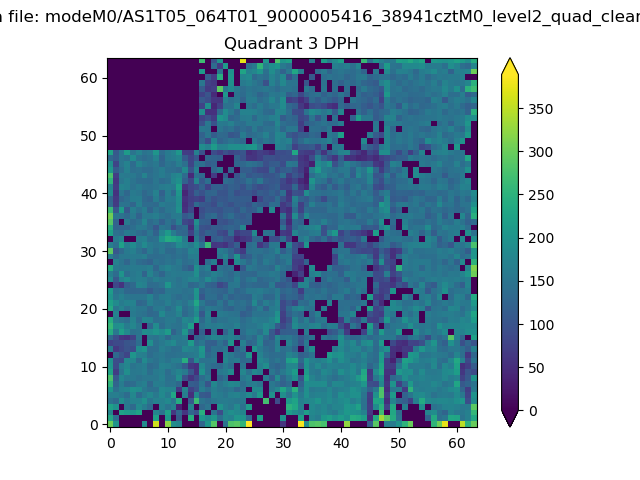 |
 |
Quadrant C |
| Plot type | Count rate plots | Images |
|---|---|---|
| Comparison with Poisson distribution Blue bars denote a histogram of data divided into 1 sec bins. Red curve is a Poisson curve with rate = median count rate of data. |
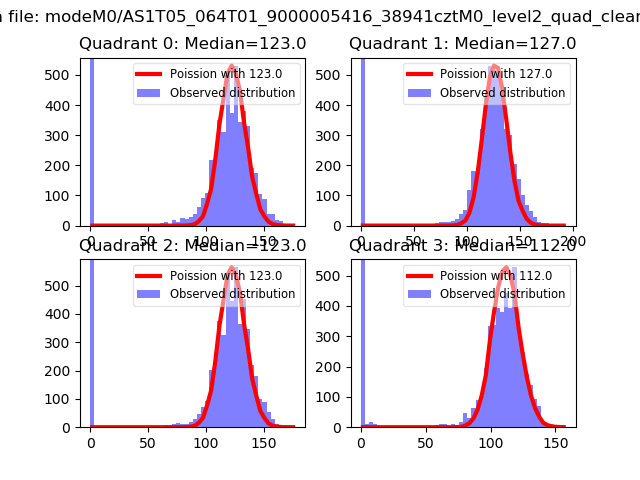 |
 |
| Quadrant-wise count rates Data is divided into 100 sec bins |
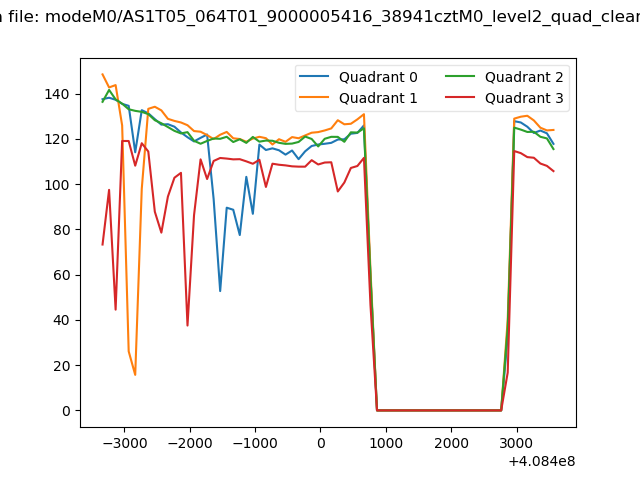 |
|
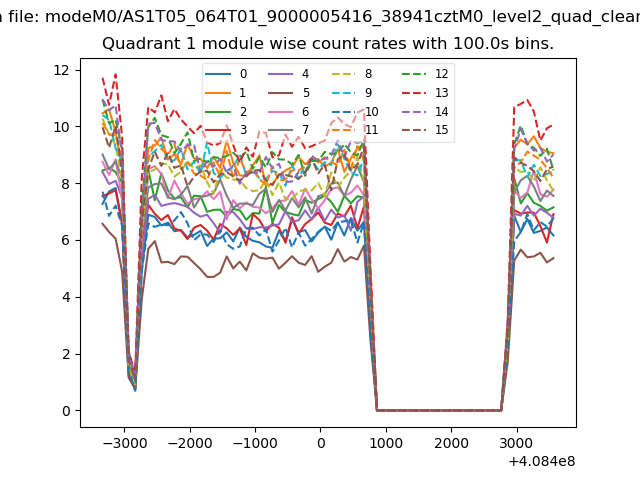
| Module-wise count rates for Quadrant A Data is divided into 100 sec bins |
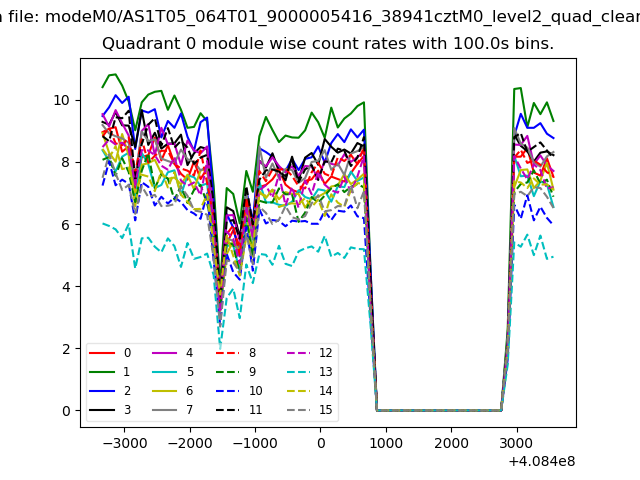 |
 |
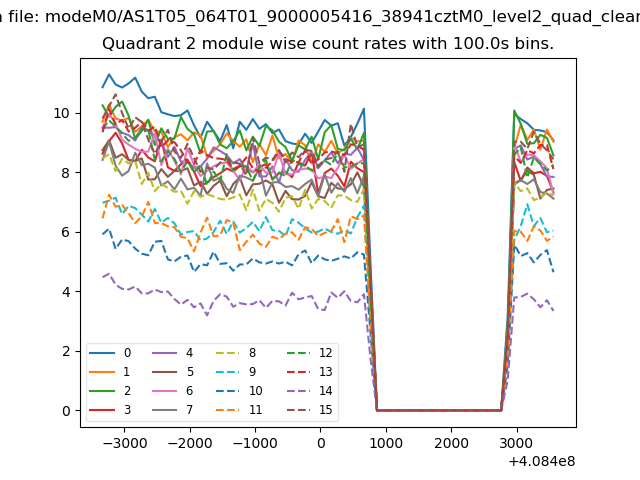
| Module-wise count rates for Quadrant B Data is divided into 100 sec bins |
 |
 |
| Module-wise count rates for Quadrant C Data is divided into 100 sec bins |
 |
 |
| Module-wise count rates for Quadrant D Data is divided into 100 sec bins |
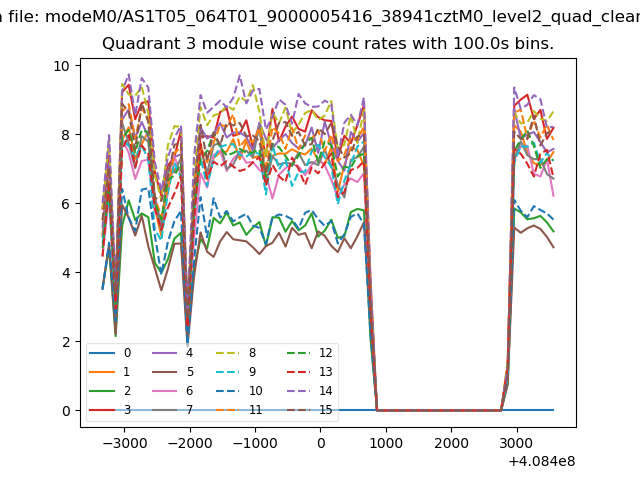 |
 |
| Parameter | Plot |
|---|---|
| CZT HV Monitor | 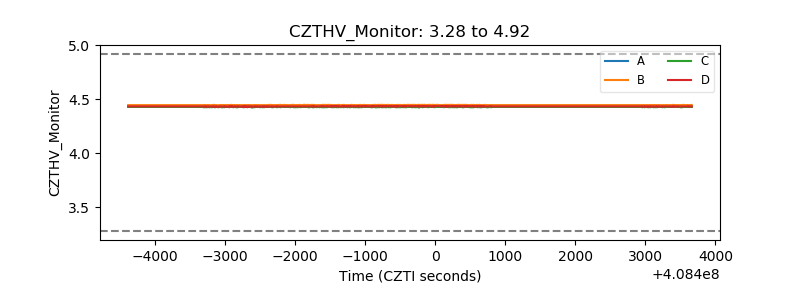 |
| D_VDD | 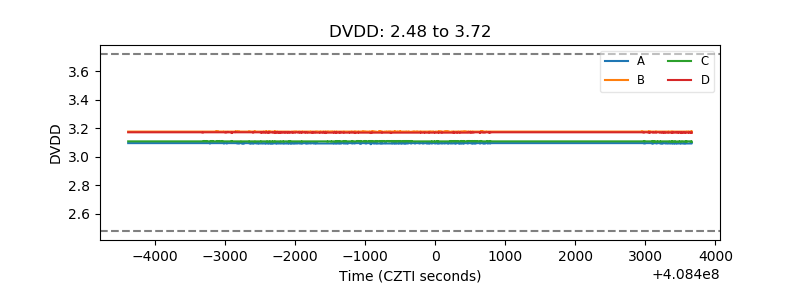 |
| Temperature 1 | 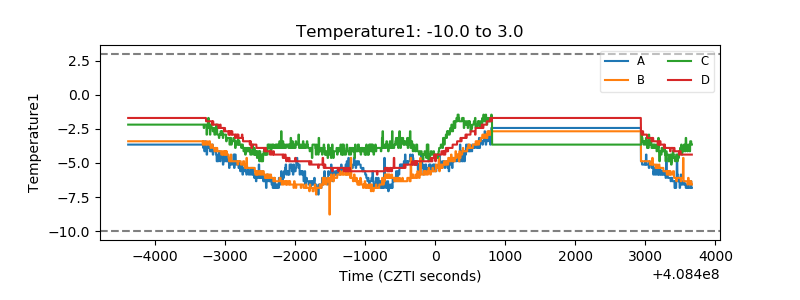 |
| Veto HV Monitor | 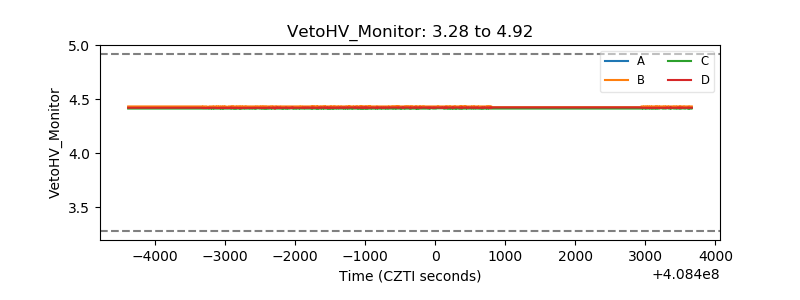 |
| Veto LLD | 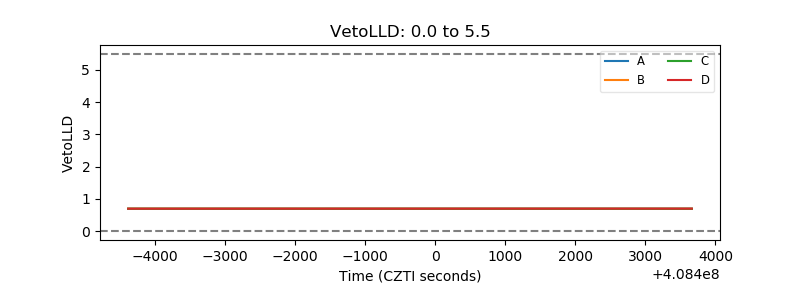 |
| Alpha Counter | 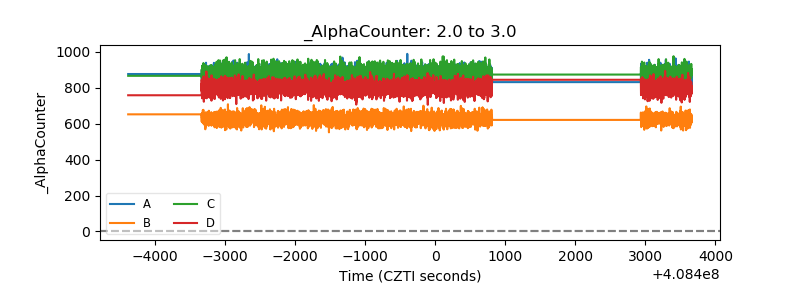 |
| _CPM_Rate | 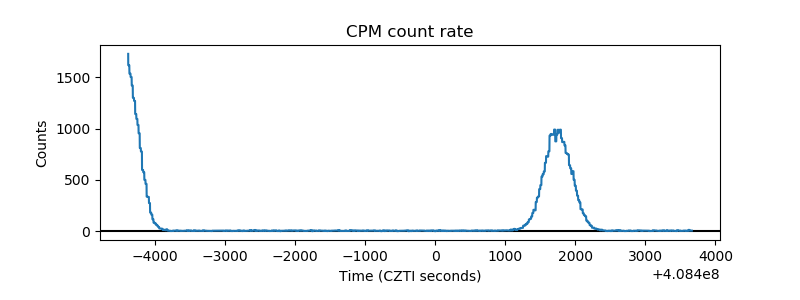 |
| CZT Counter | 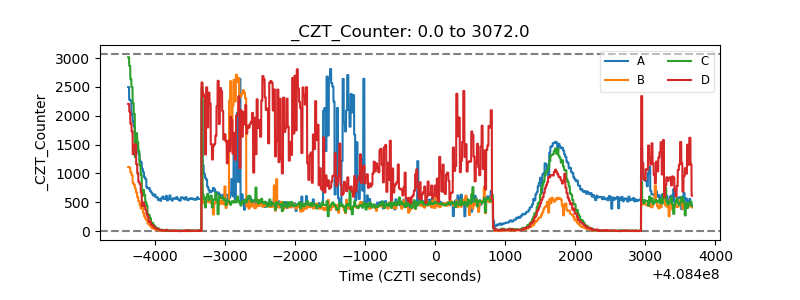 |
| +2.5 Volts monitor | 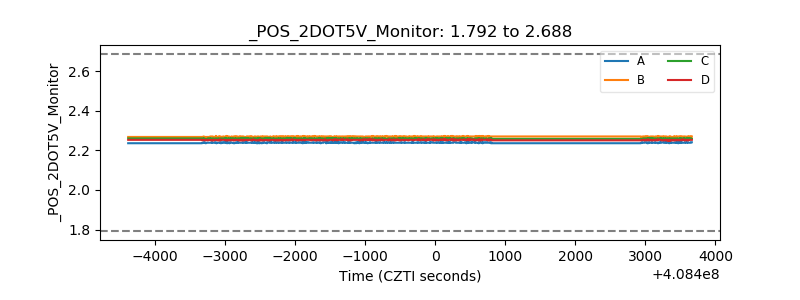 |
| +5 Volts monitor |  |
| _ROLL_ROT | 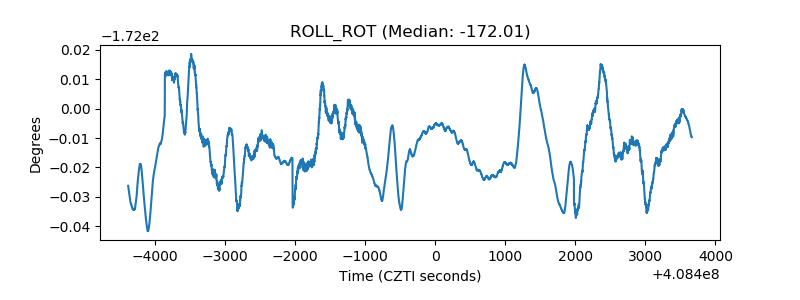 |
| _Roll_DEC | 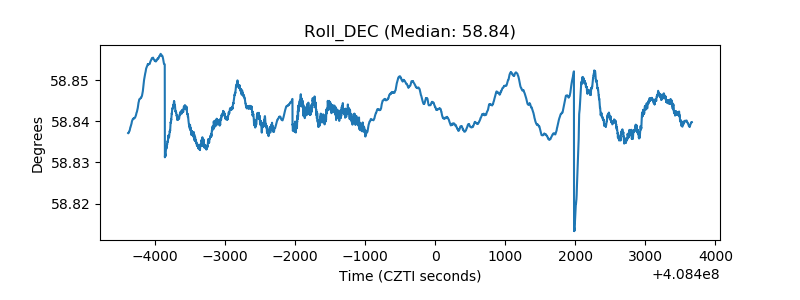 |
| _Roll_RA | 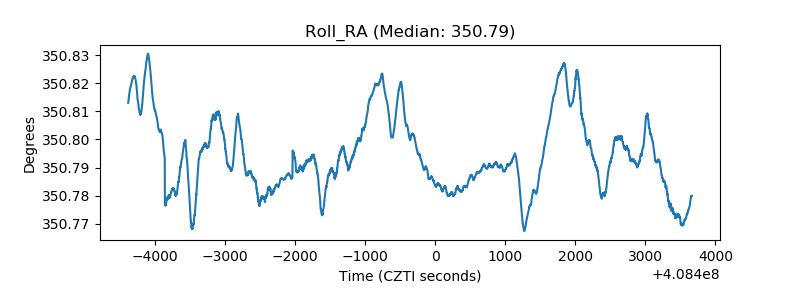 |
| Veto Counter | 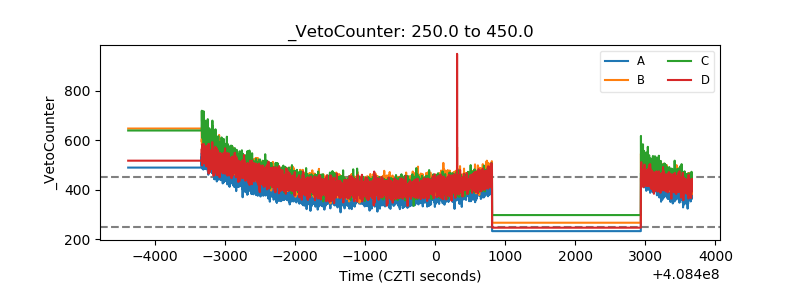 |