| Param | Original file | Final file |
|---|---|---|
| Filename | modeM0/AS1T05_064T01_9000005416_38942cztM0_level2.fits | modeM0/AS1T05_064T01_9000005416_38942cztM0_level2_quad_clean.evt |
| Size (bytes) | 339,174,720 | 86,008,320 |
| Size | 323.5 MB | 82.0 MB |
| Events in quadrant A | 2,679,220 | 574,377 |
| Events in quadrant B | 2,358,395 | 591,801 |
| Events in quadrant C | 2,331,677 | 575,433 |
| Events in quadrant D | 4,799,888 | 514,811 |
| Mode SS | |||
|---|---|---|---|
| Quadrant | BADHDUFLAG | Total packets | Discarded packets |
| A | 0 | 102 | 0 |
| B | 0 | 102 | 0 |
| C | 0 | 102 | 0 |
| D | 0 | 102 | 0 |
| Mode M9 | |||
|---|---|---|---|
| Quadrant | BADHDUFLAG | Total packets | Discarded packets |
| A | 0 | 39 | 0 |
| B | 0 | 39 | 0 |
| C | 0 | 39 | 0 |
| D | 0 | 40 | 0 |
| Mode M0 | |||
|---|---|---|---|
| Quadrant | BADHDUFLAG | Total packets | Discarded packets |
| A | 0 | 11083 | 3 |
| B | 0 | 10445 | 2 |
| C | 0 | 10002 | 2 |
| D | 0 | 17788 | 8 |
| Quadrant | Total seconds | Saturated seconds | Saturation percentage |
|---|---|---|---|
| A | 4961 | 28 | 0.564402% |
| B | 4961 | 17 | 0.342673% |
| C | 4961 | 2 | 0.040314% |
| D | 4960 | 178 | 3.588710% |
Noise dominated data is calculated using 1-second bins in cleaned event files. If a bin has >2000 counts, and if more than 50% of those come from <1% of pixels, then it is considered to be noise-dominated and hence unusable.
| Quadrant | # 1 sec bins | Bins with >0 counts | Bins with >2000 counts | High rate bins dominated by noise | Noise dominated (total time) | Noise dominated (detector-on time) | Marked lightcurve |
|---|---|---|---|---|---|---|---|
| A | 6995 | 4962 | 25 | 25 | 0.36% | 0.50% | 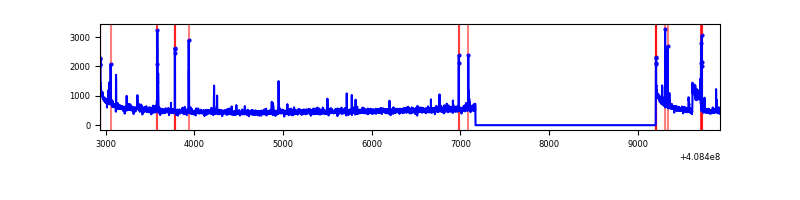 |
| B | 6995 | 4962 | 11 | 11 | 0.16% | 0.22% | 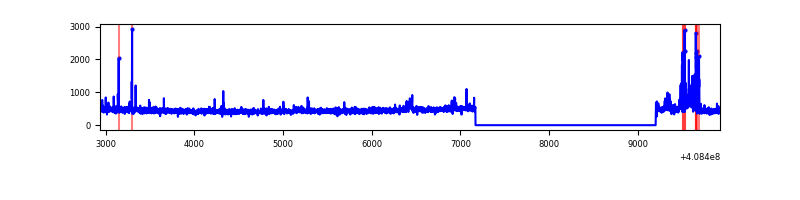 |
| C | 6995 | 4962 | 0 | 0 | 0.00% | 0.00% | 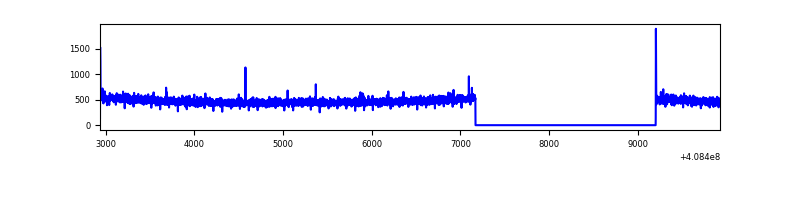 |
| D | 6994 | 4961 | 211 | 211 | 3.02% | 4.25% | 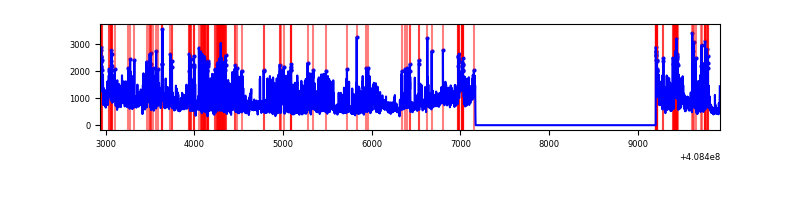 |
Top three noisy pixels from each quadrant. If the there are fewer than three noisy pixels in the level2.evt file, extra rows are filled as -1
| Pixel properties | Quadrant properties | ||||||
|---|---|---|---|---|---|---|---|
| Quadrant | DetID | PixID | Counts | Sigma | Mean | Median | Sigma |
| A | 10 | 83 | 389873 | 3530.11 | 543 | 532 | 110.3 |
| A | 15 | 222 | 146487 | 1323.36 | 543 | 532 | 110.3 |
| A | 13 | 248 | 32972 | 294.13 | 543 | 532 | 110.3 |
| B | 10 | 246 | 127133 | 1225.77 | 545 | 530 | 103.3 |
| B | 5 | 172 | 39242 | 374.81 | 545 | 530 | 103.3 |
| B | 0 | 230 | 26873 | 255.05 | 545 | 530 | 103.3 |
| C | 15 | 214 | 204976 | 1619.34 | 541 | 544 | 126.2 |
| C | 0 | 10 | 9101 | 67.78 | 541 | 544 | 126.2 |
| C | 5 | 237 | 5511 | 39.34 | 541 | 544 | 126.2 |
| D | 12 | 227 | 1025719 | 7949.14 | 526 | 510 | 129.0 |
| D | 12 | 235 | 983486 | 7621.68 | 526 | 510 | 129.0 |
| D | 12 | 6 | 251575 | 1946.68 | 526 | 510 | 129.0 |
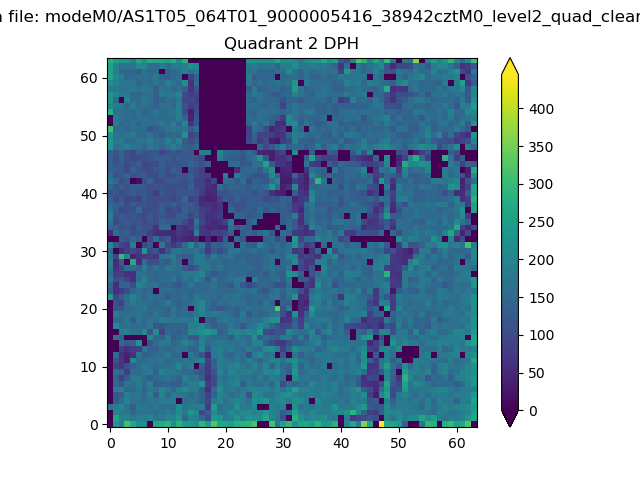
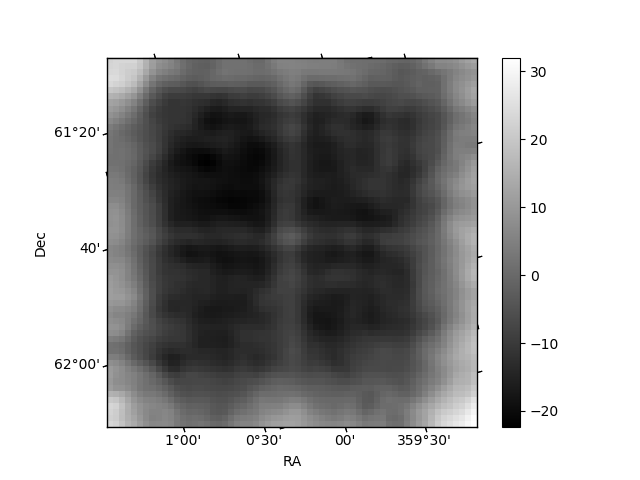
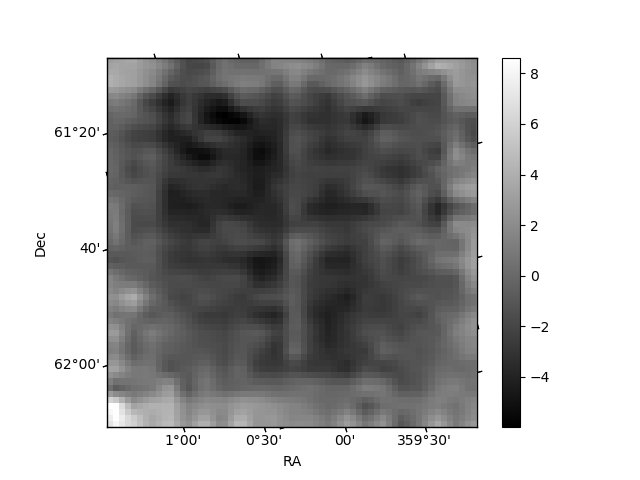
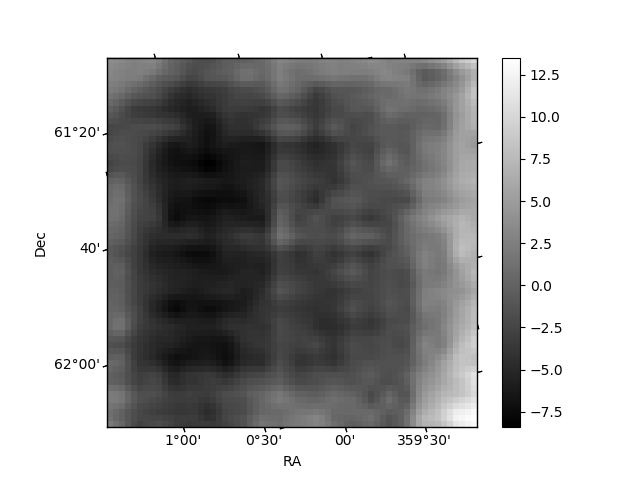
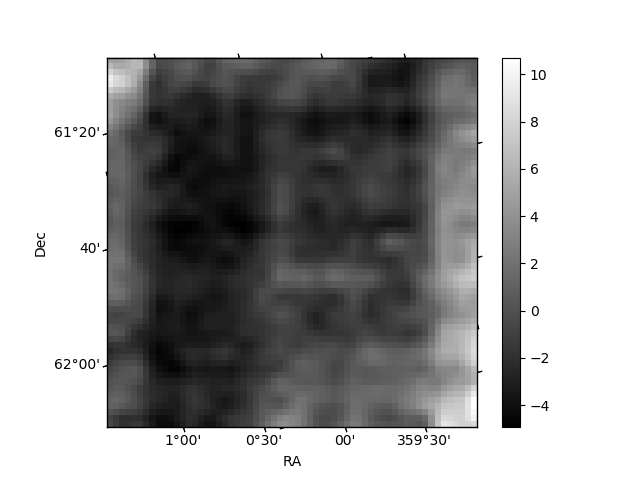
Histogram calculated using DETX and DETY for each event in the final _common_clean file
| Quadrant A | 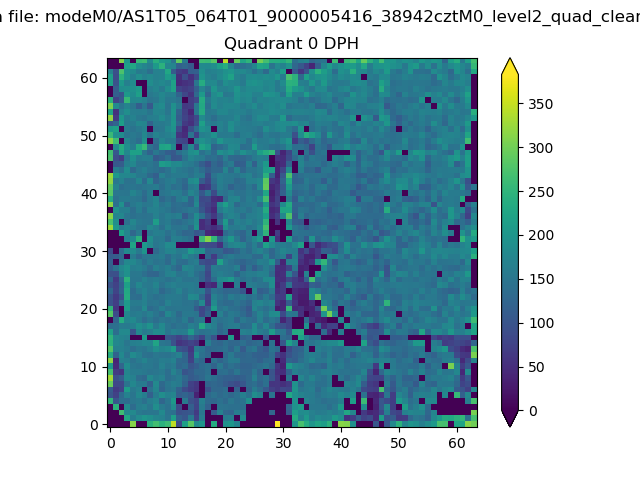 |
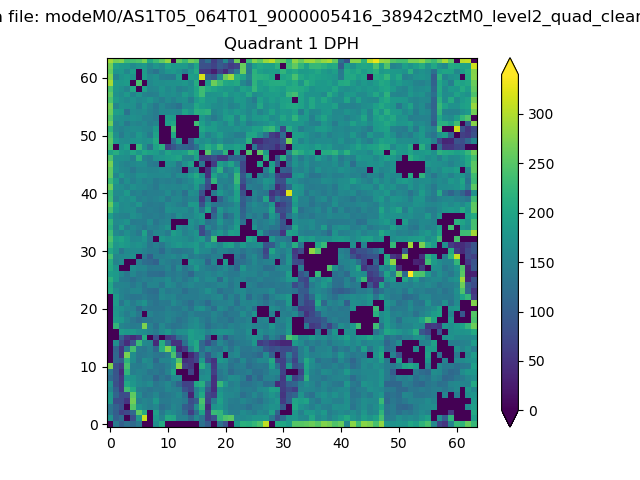 |
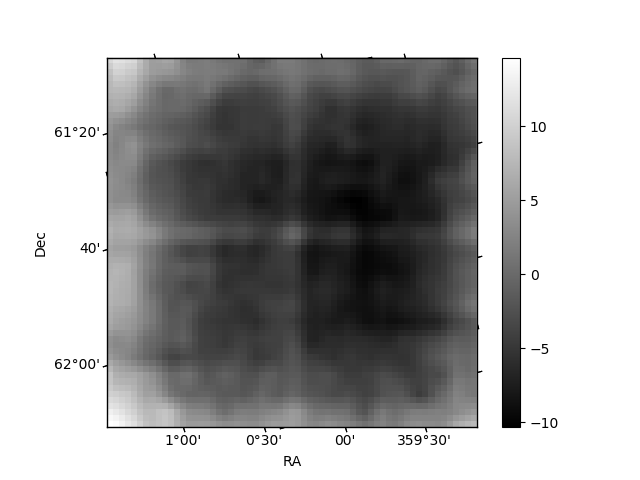
Quadrant B |
|---|---|---|---|
| Quadrant D | 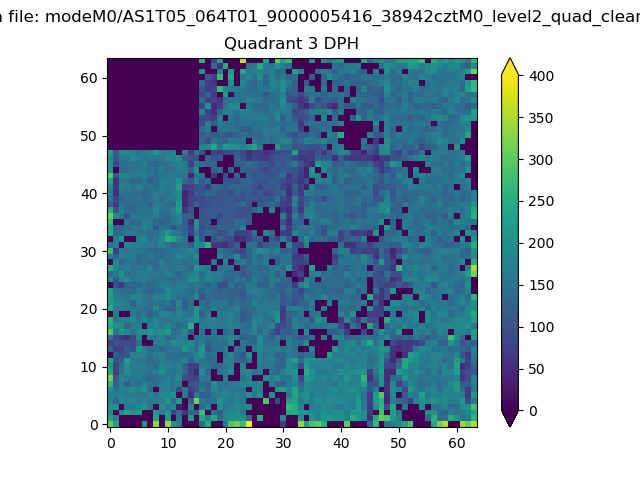 |
 |
Quadrant C |
| Plot type | Count rate plots | Images |
|---|---|---|
| Comparison with Poisson distribution Blue bars denote a histogram of data divided into 1 sec bins. Red curve is a Poisson curve with rate = median count rate of data. |
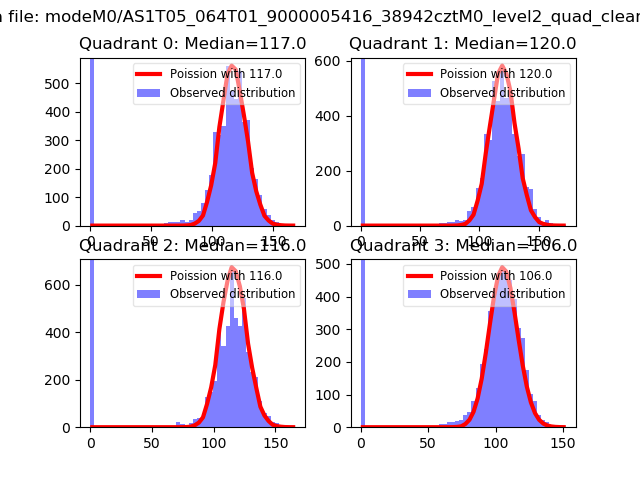 |
 |
| Quadrant-wise count rates Data is divided into 100 sec bins |
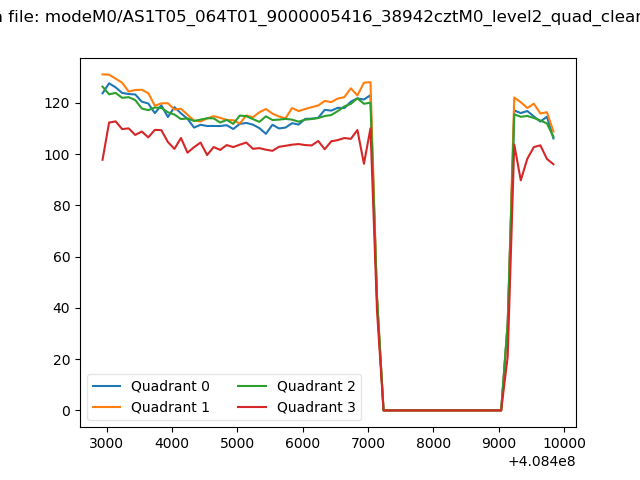 |
|
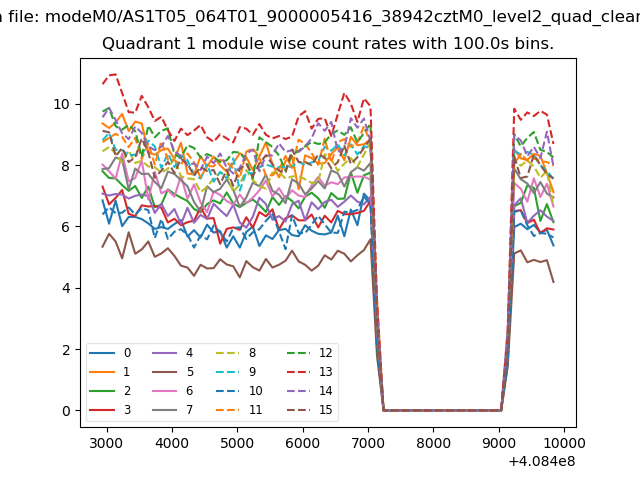
| Module-wise count rates for Quadrant A Data is divided into 100 sec bins |
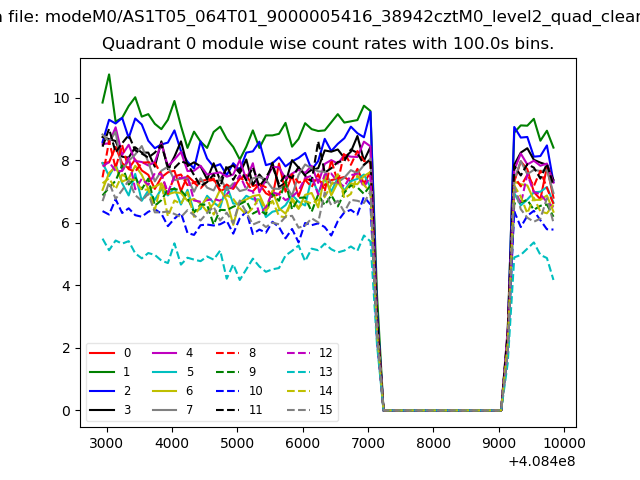 |
 |
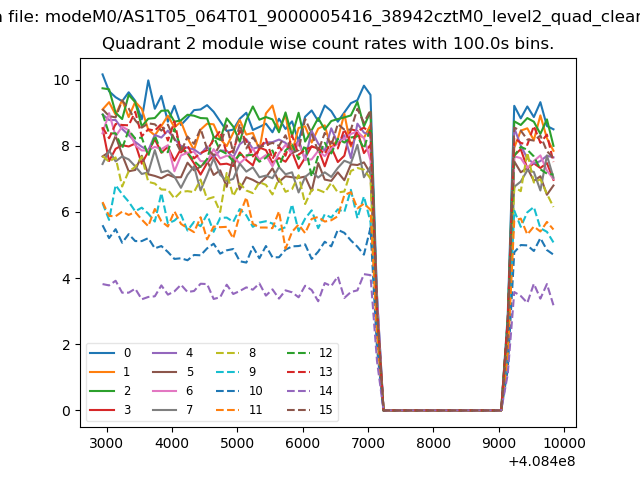
| Module-wise count rates for Quadrant B Data is divided into 100 sec bins |
 |
 |
| Module-wise count rates for Quadrant C Data is divided into 100 sec bins |
 |
 |
| Module-wise count rates for Quadrant D Data is divided into 100 sec bins |
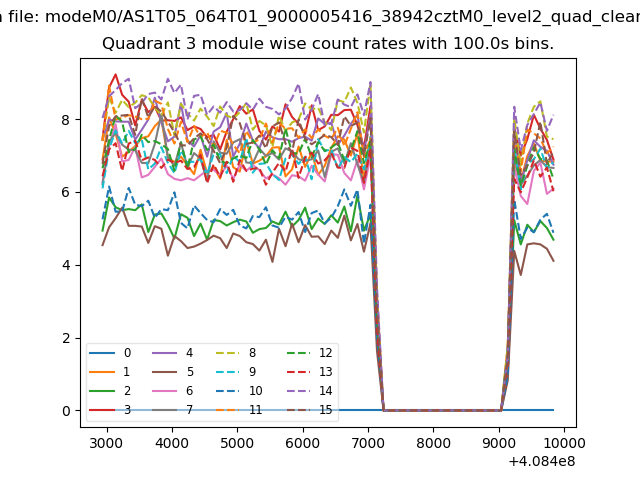 |
 |
| Parameter | Plot |
|---|---|
| CZT HV Monitor | 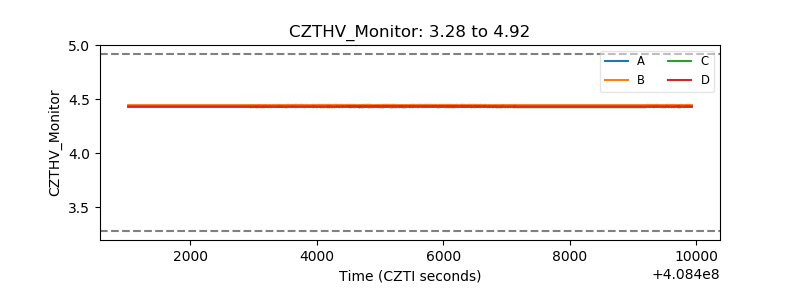 |
| D_VDD | 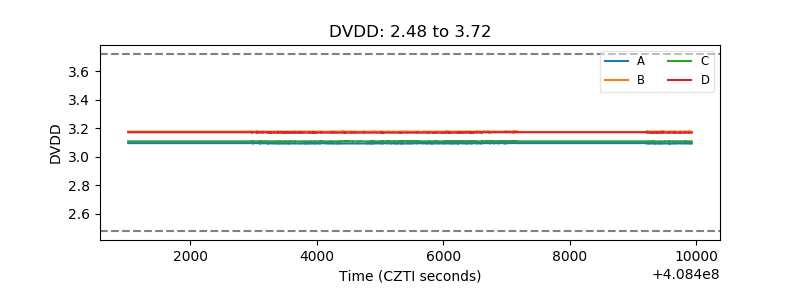 |
| Temperature 1 | 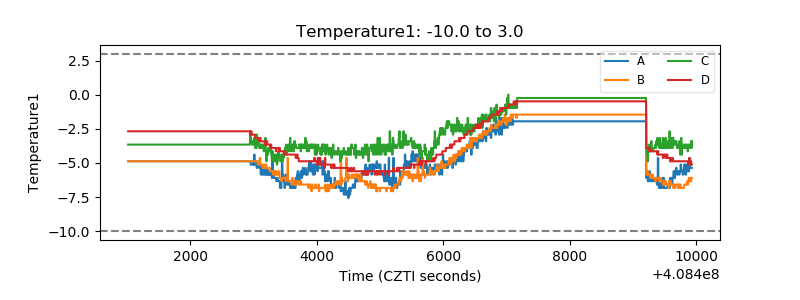 |
| Veto HV Monitor | 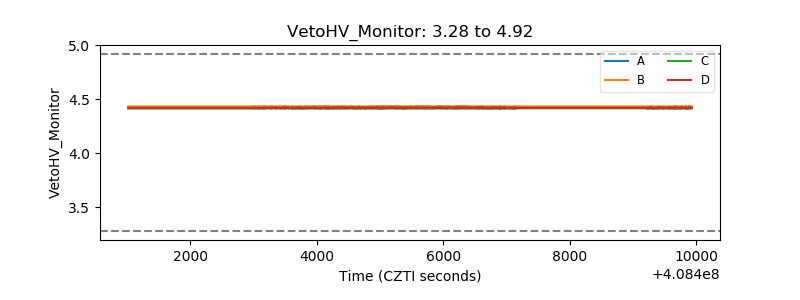 |
| Veto LLD | 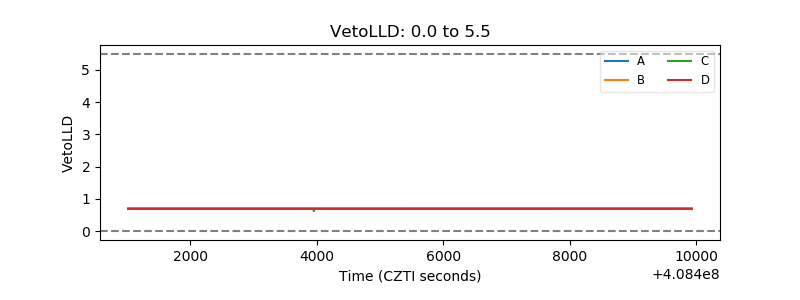 |
| Alpha Counter | 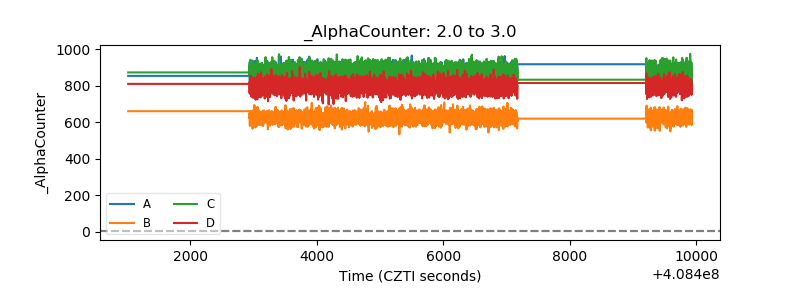 |
| _CPM_Rate | 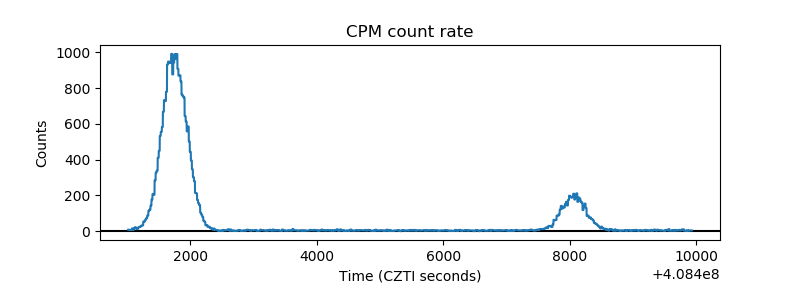 |
| CZT Counter | 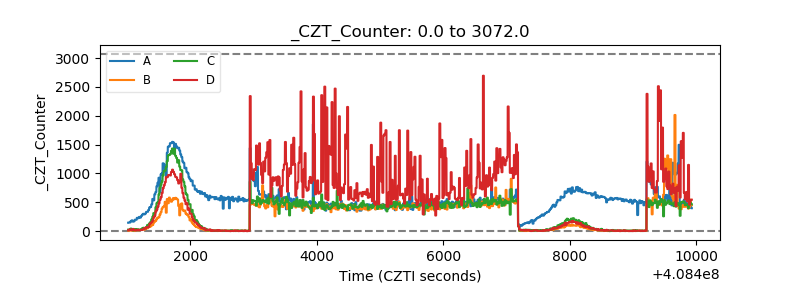 |
| +2.5 Volts monitor | 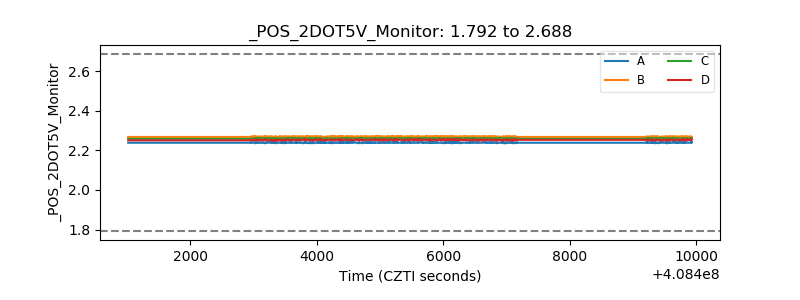 |
| +5 Volts monitor | 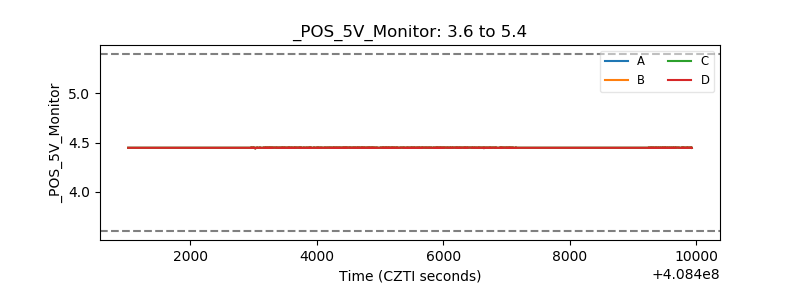 |
| _ROLL_ROT | 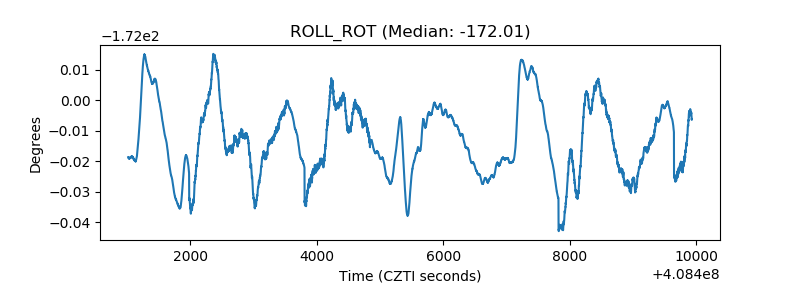 |
| _Roll_DEC | 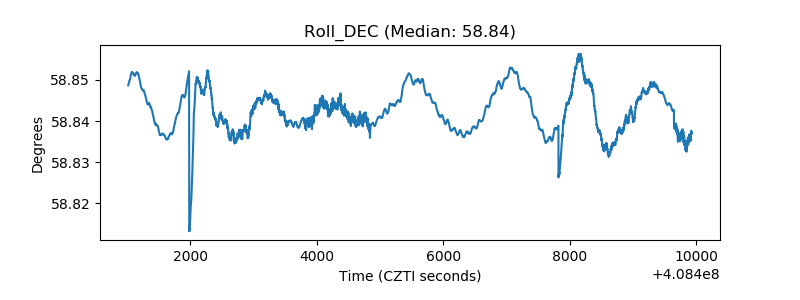 |
| _Roll_RA | 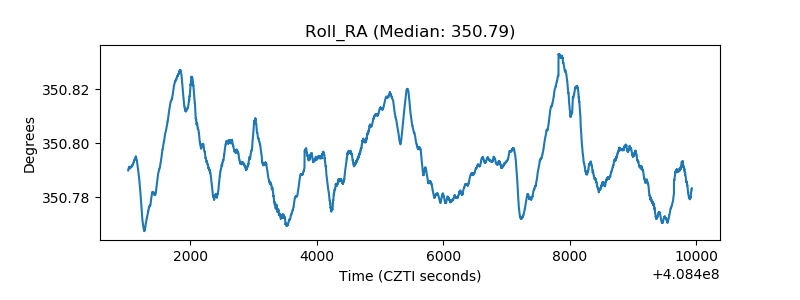 |
| Veto Counter | 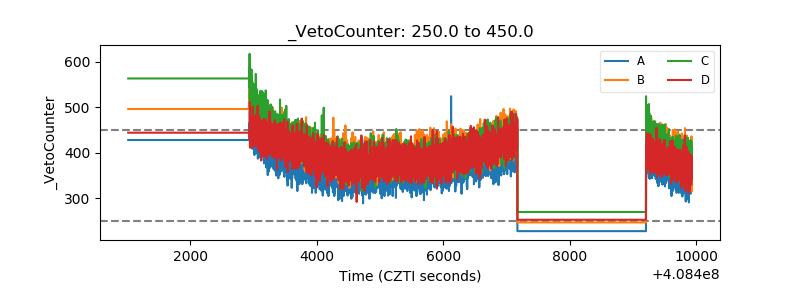 |