| Param | Original file | Final file |
|---|---|---|
| Filename | modeM0/AS1T05_064T01_9000005416_38943cztM0_level2.fits | modeM0/AS1T05_064T01_9000005416_38943cztM0_level2_quad_clean.evt |
| Size (bytes) | 349,220,160 | 89,795,520 |
| Size | 333.0 MB | 85.6 MB |
| Events in quadrant A | 3,126,535 | 593,979 |
| Events in quadrant B | 2,520,666 | 617,867 |
| Events in quadrant C | 2,496,192 | 600,481 |
| Events in quadrant D | 4,363,017 | 528,004 |
| Mode SS | |||
|---|---|---|---|
| Quadrant | BADHDUFLAG | Total packets | Discarded packets |
| A | 0 | 112 | 0 |
| B | 0 | 112 | 0 |
| C | 0 | 112 | 0 |
| D | 0 | 112 | 0 |
| Mode M9 | |||
|---|---|---|---|
| Quadrant | BADHDUFLAG | Total packets | Discarded packets |
| A | 0 | 30 | 0 |
| B | 0 | 30 | 0 |
| C | 0 | 30 | 0 |
| D | 0 | 31 | 0 |
| Mode M0 | |||
|---|---|---|---|
| Quadrant | BADHDUFLAG | Total packets | Discarded packets |
| A | 0 | 12665 | 3 |
| B | 0 | 11332 | 2 |
| C | 0 | 10865 | 2 |
| D | 0 | 16602 | 2 |
| Quadrant | Total seconds | Saturated seconds | Saturation percentage |
|---|---|---|---|
| A | 5400 | 108 | 2.000000% |
| B | 5400 | 26 | 0.481481% |
| C | 5400 | 3 | 0.055556% |
| D | 5400 | 316 | 5.851852% |
Noise dominated data is calculated using 1-second bins in cleaned event files. If a bin has >2000 counts, and if more than 50% of those come from <1% of pixels, then it is considered to be noise-dominated and hence unusable.
| Quadrant | # 1 sec bins | Bins with >0 counts | Bins with >2000 counts | High rate bins dominated by noise | Noise dominated (total time) | Noise dominated (detector-on time) | Marked lightcurve |
|---|---|---|---|---|---|---|---|
| A | 7133 | 5401 | 91 | 91 | 1.28% | 1.68% | 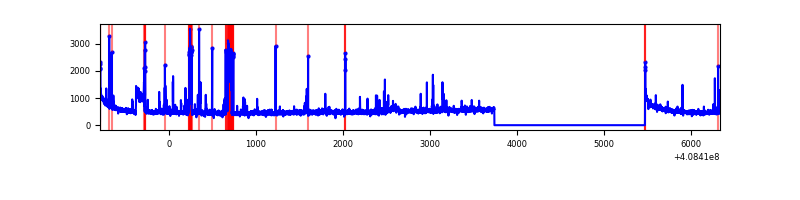 |
| B | 7133 | 5401 | 10 | 10 | 0.14% | 0.19% | 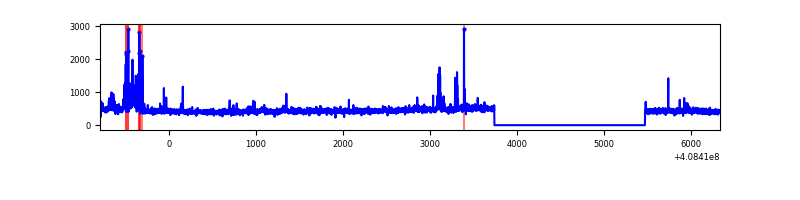 |
| C | 7133 | 5401 | 0 | 0 | 0.00% | 0.00% | 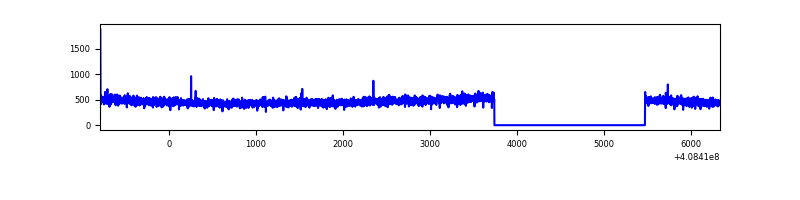 |
| D | 7133 | 5401 | 314 | 314 | 4.40% | 5.81% | 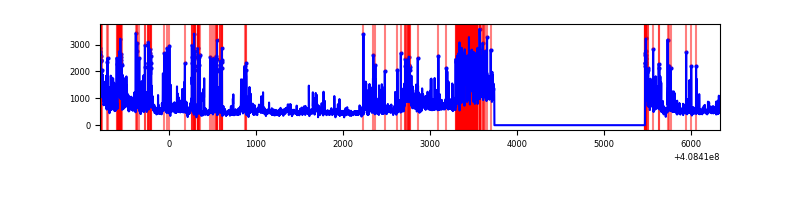 |
Top three noisy pixels from each quadrant. If the there are fewer than three noisy pixels in the level2.evt file, extra rows are filled as -1
| Pixel properties | Quadrant properties | ||||||
|---|---|---|---|---|---|---|---|
| Quadrant | DetID | PixID | Counts | Sigma | Mean | Median | Sigma |
| A | 10 | 83 | 421844 | 3589.03 | 581 | 569 | 117.4 |
| A | 9 | 143 | 207626 | 1764.01 | 581 | 569 | 117.4 |
| A | 15 | 222 | 197888 | 1681.05 | 581 | 569 | 117.4 |
| B | 10 | 246 | 132350 | 1185.95 | 585 | 569 | 111.1 |
| B | 5 | 172 | 51904 | 461.99 | 585 | 569 | 111.1 |
| B | 0 | 229 | 15889 | 137.87 | 585 | 569 | 111.1 |
| C | 15 | 214 | 221469 | 1622.68 | 578 | 583 | 136.1 |
| C | 14 | 254 | 9983 | 69.05 | 578 | 583 | 136.1 |
| C | 0 | 10 | 5106 | 33.23 | 578 | 583 | 136.1 |
| D | 12 | 227 | 967950 | 7031.96 | 562 | 545 | 137.6 |
| D | 12 | 235 | 478750 | 3476.02 | 562 | 545 | 137.6 |
| D | 12 | 6 | 216721 | 1571.36 | 562 | 545 | 137.6 |
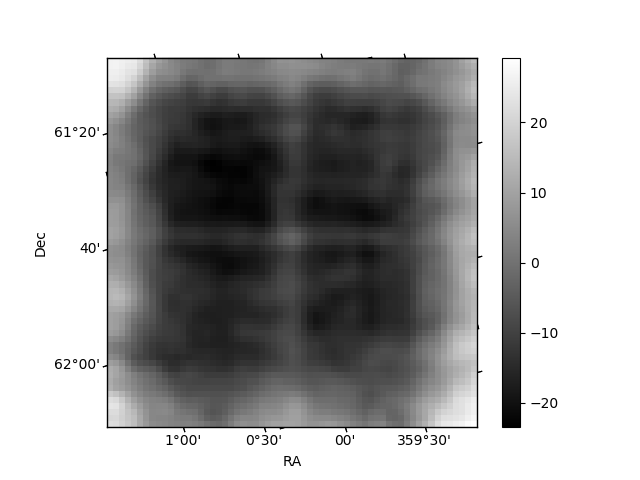
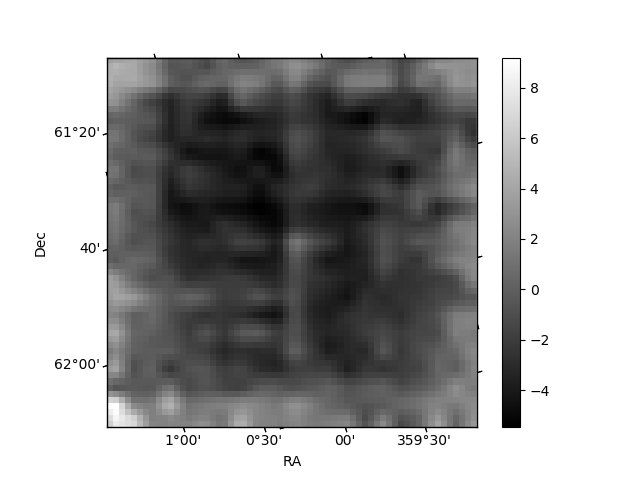
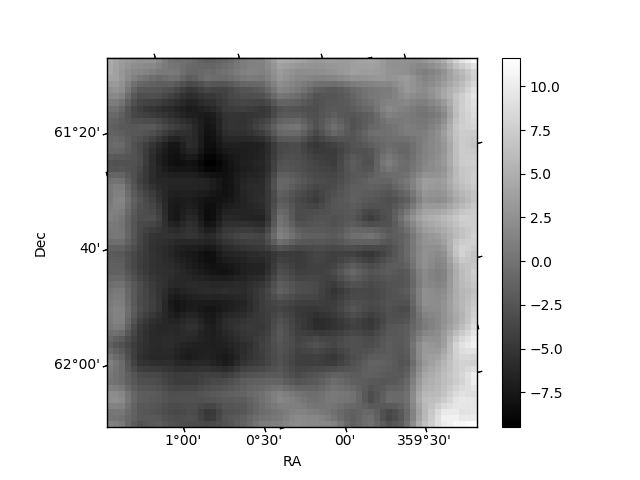
Histogram calculated using DETX and DETY for each event in the final _common_clean file
| Quadrant A | 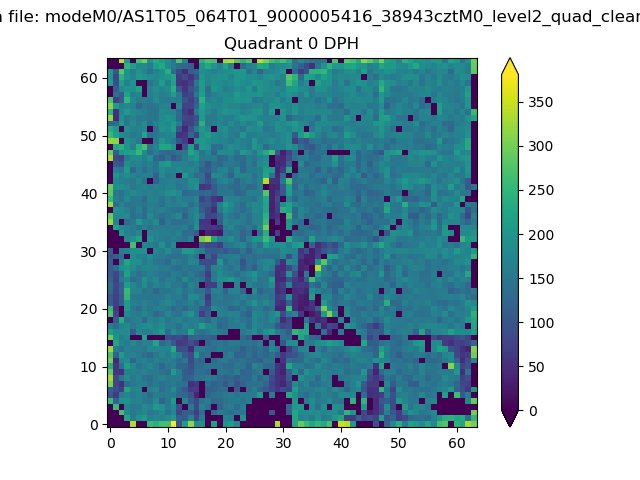 |
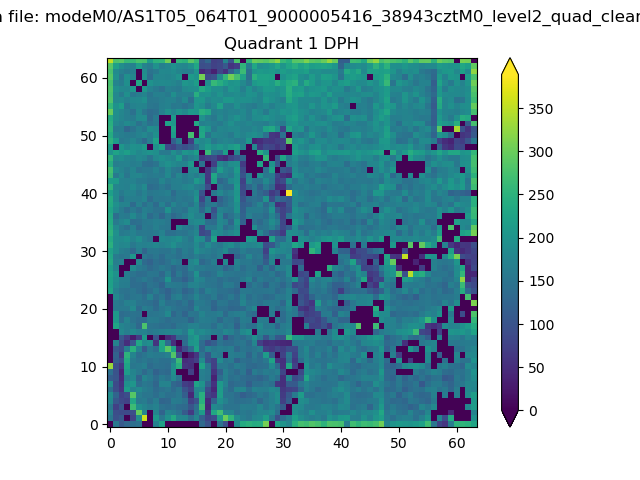 |
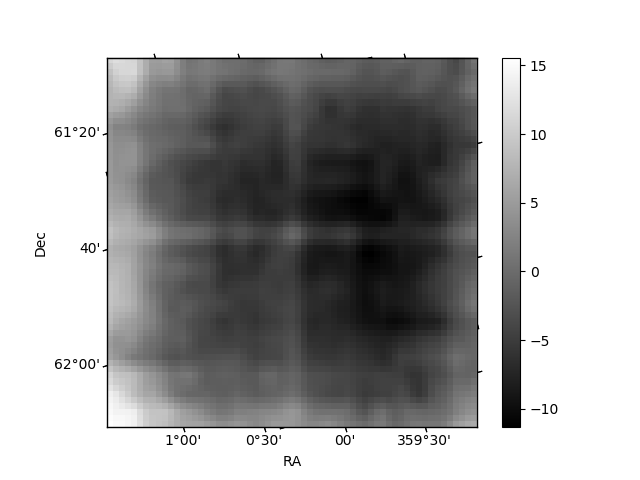
Quadrant B |
|---|---|---|---|
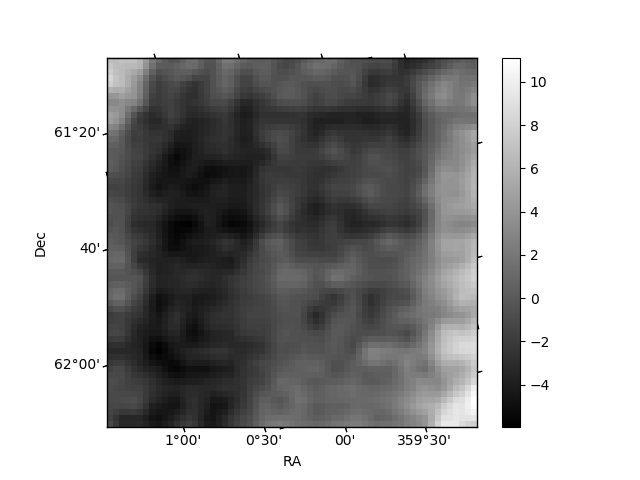
| Quadrant D | 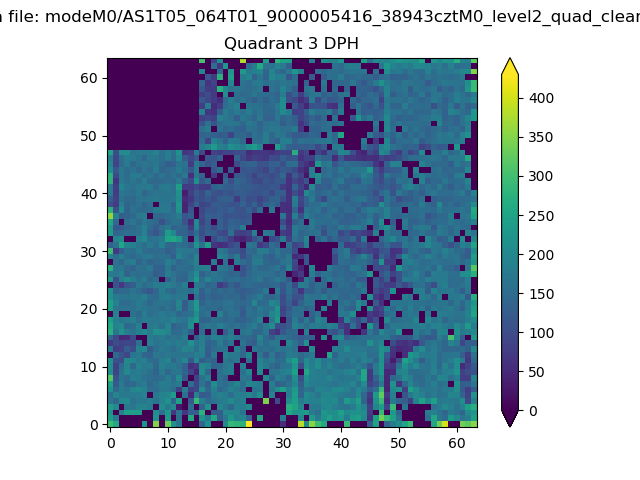 |
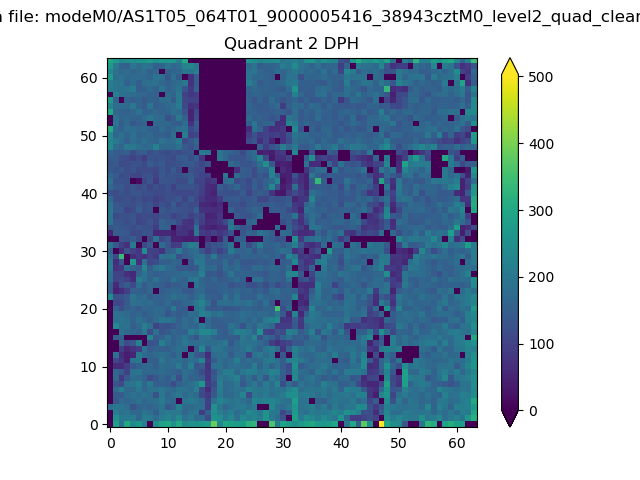 |
Quadrant C |
| Plot type | Count rate plots | Images |
|---|---|---|
| Comparison with Poisson distribution Blue bars denote a histogram of data divided into 1 sec bins. Red curve is a Poisson curve with rate = median count rate of data. |
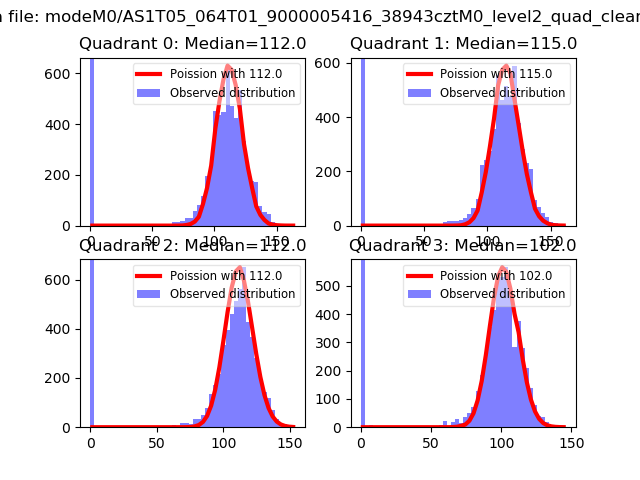 |
 |
| Quadrant-wise count rates Data is divided into 100 sec bins |
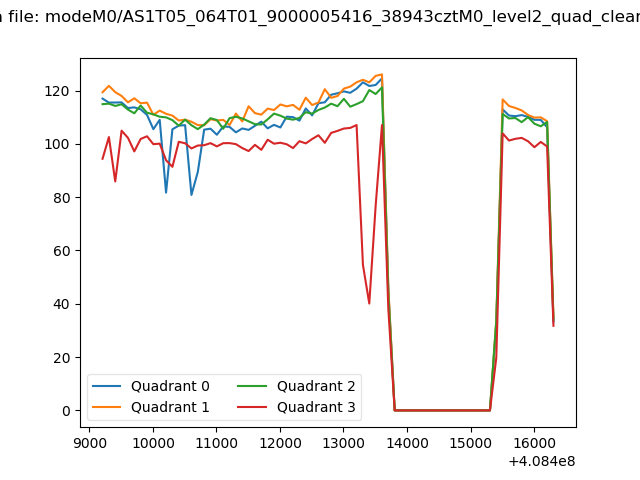 |
|
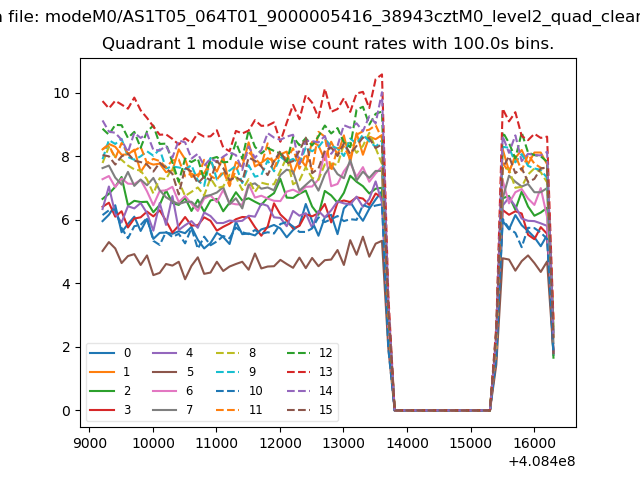
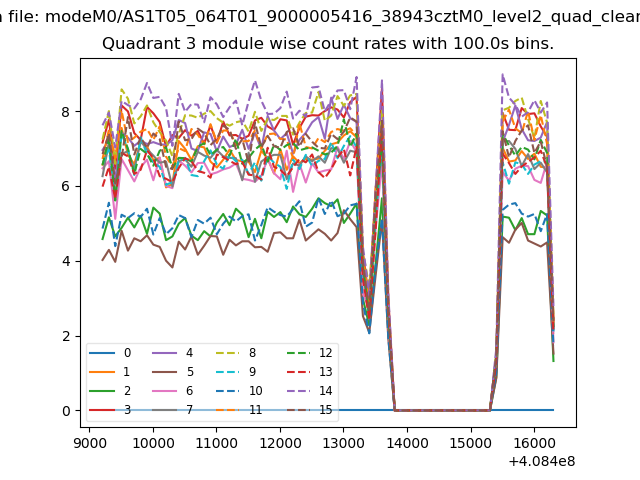
| Module-wise count rates for Quadrant A Data is divided into 100 sec bins |
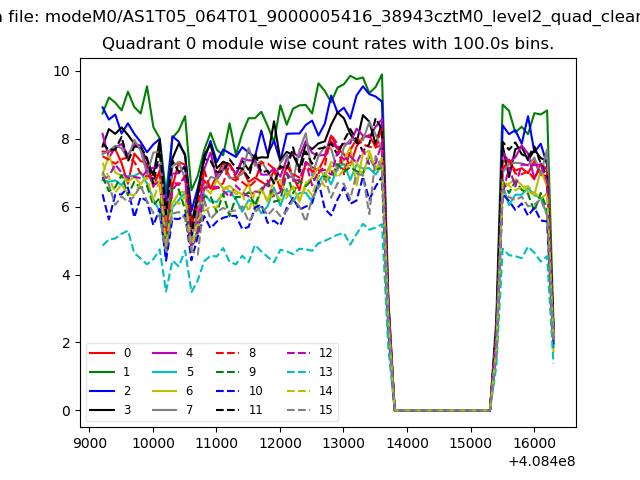 |
 |
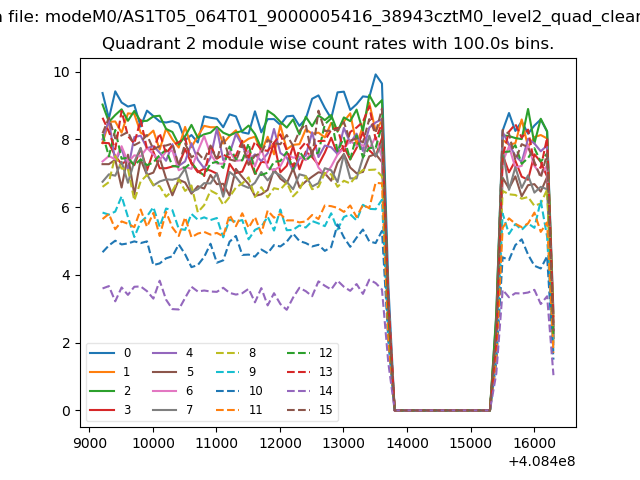
| Module-wise count rates for Quadrant B Data is divided into 100 sec bins |
 |
 |
| Module-wise count rates for Quadrant C Data is divided into 100 sec bins |
 |
 |
| Module-wise count rates for Quadrant D Data is divided into 100 sec bins |
 |
 |
| Parameter | Plot |
|---|---|
| CZT HV Monitor | 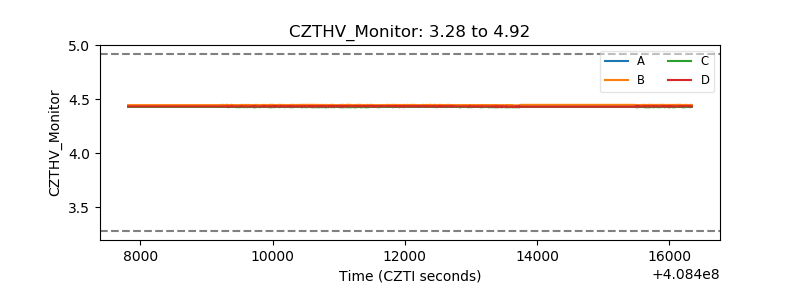 |
| D_VDD | 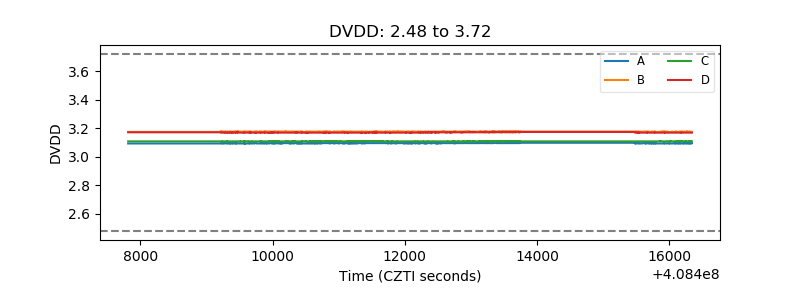 |
| Temperature 1 | 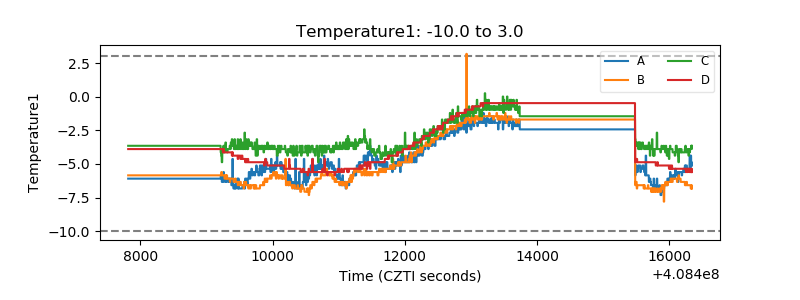 |
| Veto HV Monitor | 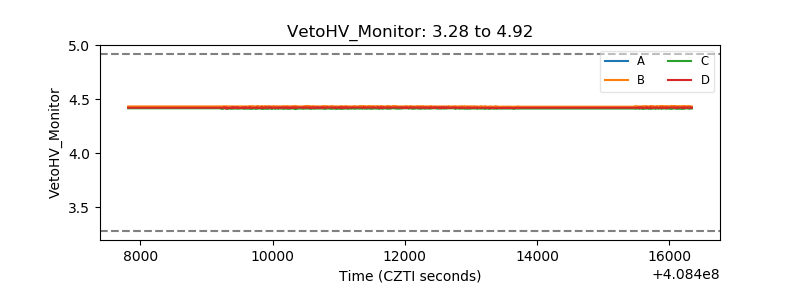 |
| Veto LLD |  |
| Alpha Counter | 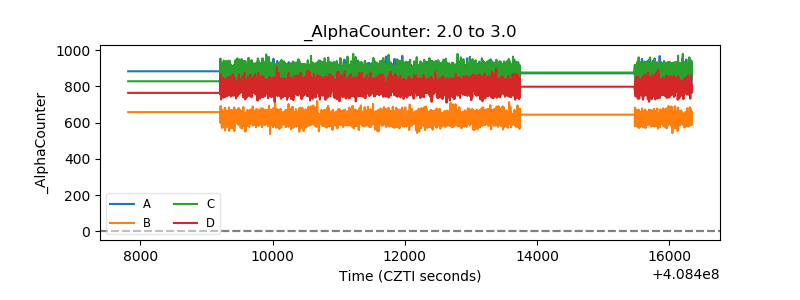 |
| _CPM_Rate | 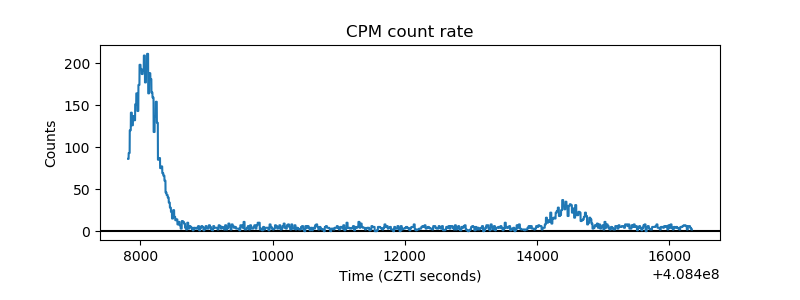 |
| CZT Counter | 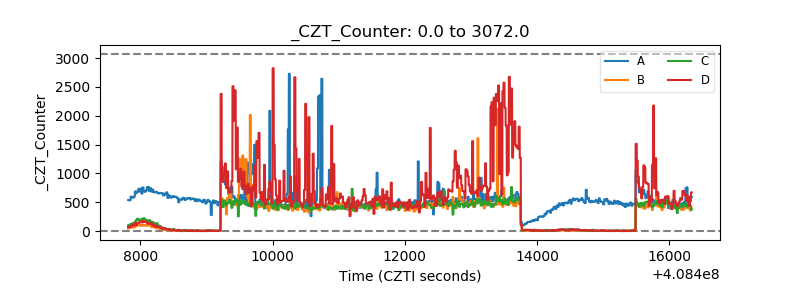 |
| +2.5 Volts monitor | 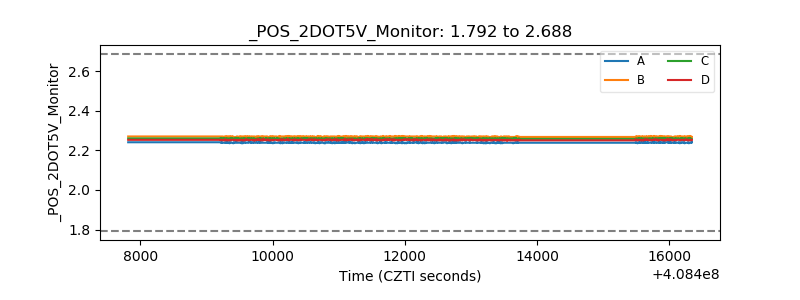 |
| +5 Volts monitor | 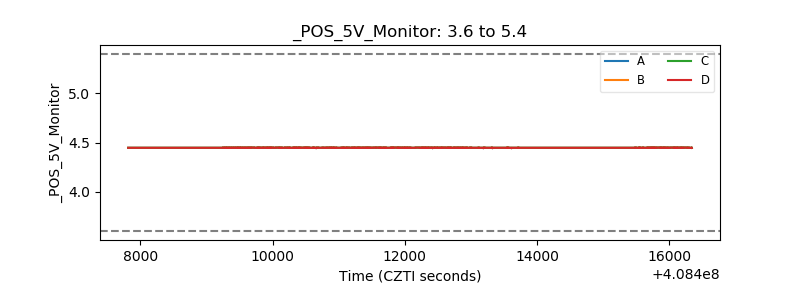 |
| _ROLL_ROT | 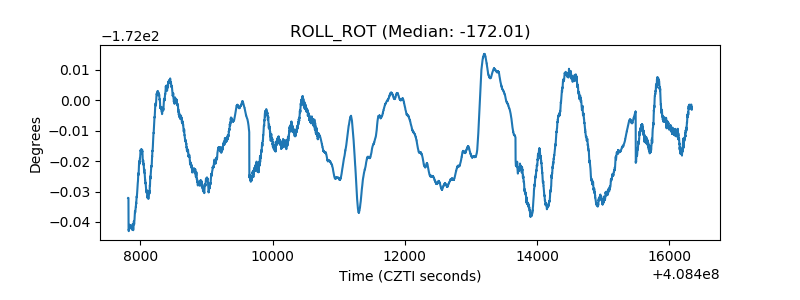 |
| _Roll_DEC | 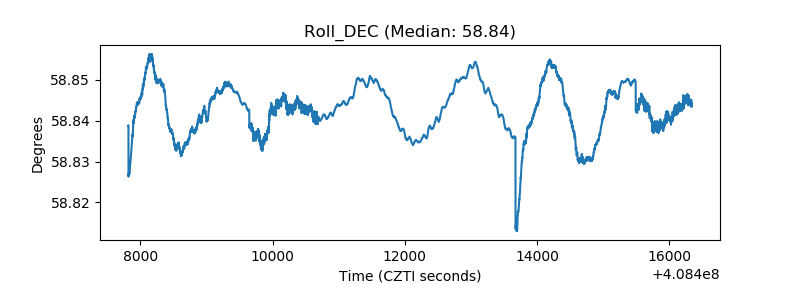 |
| _Roll_RA | 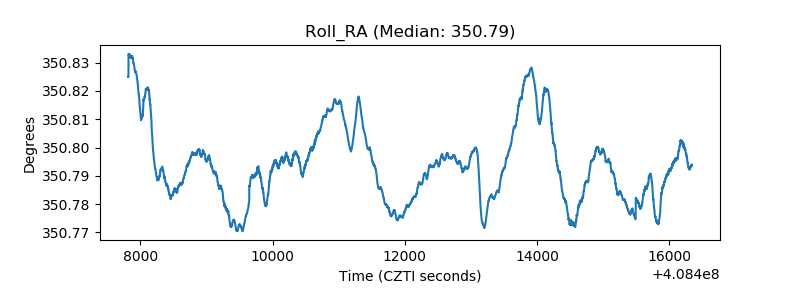 |
| Veto Counter | 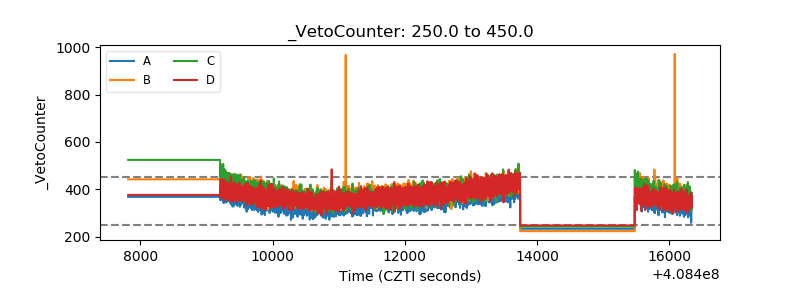 |