| Param | Original file | Final file |
|---|---|---|
| Filename | modeM0/AS1T05_064T01_9000005416_38945cztM0_level2.fits | modeM0/AS1T05_064T01_9000005416_38945cztM0_level2_quad_clean.evt |
| Size (bytes) | 365,368,320 | 94,383,360 |
| Size | 348.4 MB | 90.0 MB |
| Events in quadrant A | 3,115,938 | 628,058 |
| Events in quadrant B | 2,806,431 | 638,459 |
| Events in quadrant C | 2,677,326 | 627,055 |
| Events in quadrant D | 4,477,472 | 562,369 |
| Mode SS | |||
|---|---|---|---|
| Quadrant | BADHDUFLAG | Total packets | Discarded packets |
| A | 0 | 116 | 0 |
| B | 0 | 116 | 0 |
| C | 0 | 116 | 0 |
| D | 0 | 116 | 0 |
| Mode M9 | |||
|---|---|---|---|
| Quadrant | BADHDUFLAG | Total packets | Discarded packets |
| A | 0 | 22 | 0 |
| B | 0 | 22 | 0 |
| C | 0 | 22 | 0 |
| D | 0 | 23 | 0 |
| Mode M0 | |||
|---|---|---|---|
| Quadrant | BADHDUFLAG | Total packets | Discarded packets |
| A | 0 | 12734 | 3 |
| B | 0 | 12332 | 2 |
| C | 0 | 11583 | 2 |
| D | 0 | 17199 | 2 |
| Quadrant | Total seconds | Saturated seconds | Saturation percentage |
|---|---|---|---|
| A | 5751 | 57 | 0.991132% |
| B | 5751 | 92 | 1.599722% |
| C | 5751 | 3 | 0.052165% |
| D | 5751 | 241 | 4.190576% |
Noise dominated data is calculated using 1-second bins in cleaned event files. If a bin has >2000 counts, and if more than 50% of those come from <1% of pixels, then it is considered to be noise-dominated and hence unusable.
| Quadrant | # 1 sec bins | Bins with >0 counts | Bins with >2000 counts | High rate bins dominated by noise | Noise dominated (total time) | Noise dominated (detector-on time) | Marked lightcurve |
|---|---|---|---|---|---|---|---|
| A | 7063 | 5752 | 41 | 41 | 0.58% | 0.71% | 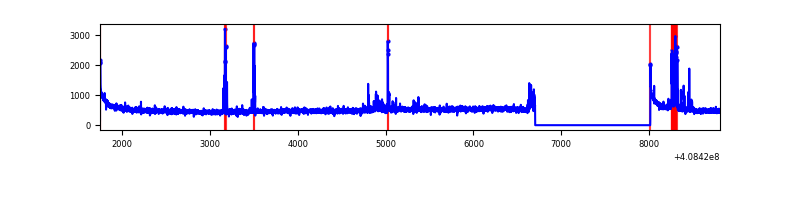 |
| B | 7063 | 5752 | 79 | 79 | 1.12% | 1.37% | 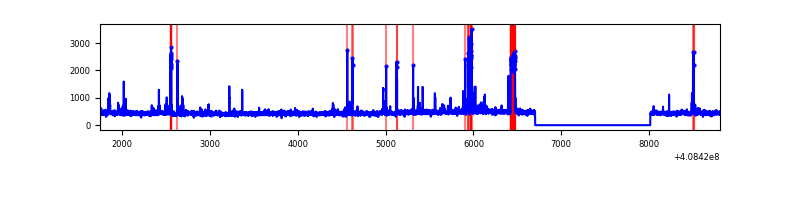 |
| C | 7063 | 5752 | 0 | 0 | 0.00% | 0.00% | 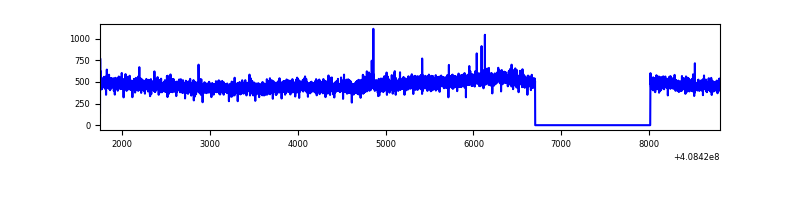 |
| D | 7063 | 5752 | 248 | 248 | 3.51% | 4.31% | 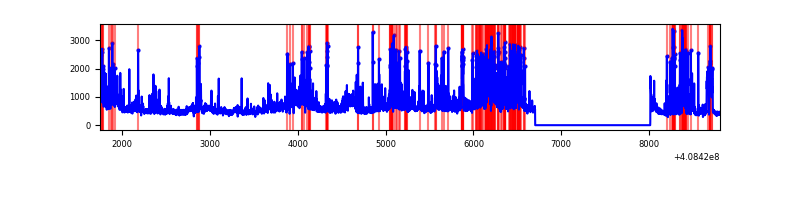 |
Top three noisy pixels from each quadrant. If the there are fewer than three noisy pixels in the level2.evt file, extra rows are filled as -1
| Pixel properties | Quadrant properties | ||||||
|---|---|---|---|---|---|---|---|
| Quadrant | DetID | PixID | Counts | Sigma | Mean | Median | Sigma |
| A | 10 | 83 | 448804 | 3475.99 | 632 | 618 | 128.9 |
| A | 13 | 248 | 199626 | 1543.44 | 632 | 618 | 128.9 |
| A | 9 | 143 | 10758 | 78.64 | 632 | 618 | 128.9 |
| B | 5 | 172 | 290131 | 2380.6 | 627 | 609 | 121.6 |
| B | 0 | 230 | 20098 | 160.25 | 627 | 609 | 121.6 |
| B | 12 | 111 | 15250 | 120.39 | 627 | 609 | 121.6 |
| C | 15 | 214 | 240174 | 1637.88 | 622 | 626 | 146.3 |
| C | 1 | 23 | 6943 | 43.19 | 622 | 626 | 146.3 |
| C | 13 | 61 | 4358 | 25.52 | 622 | 626 | 146.3 |
| D | 12 | 227 | 860252 | 5730.73 | 610 | 592 | 150.0 |
| D | 12 | 235 | 257846 | 1714.92 | 610 | 592 | 150.0 |
| D | 2 | 250 | 203726 | 1354.14 | 610 | 592 | 150.0 |
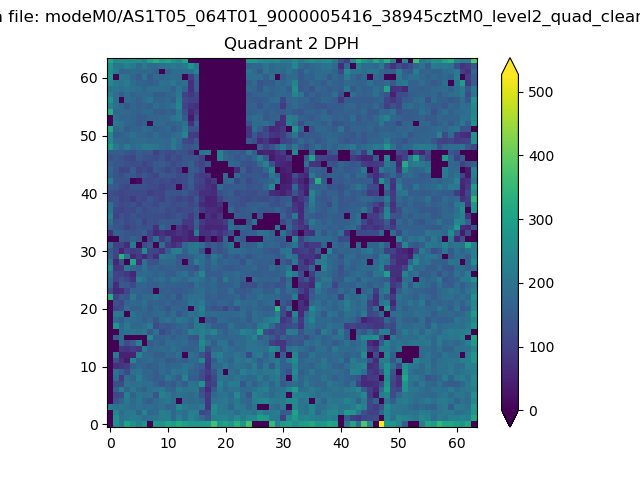
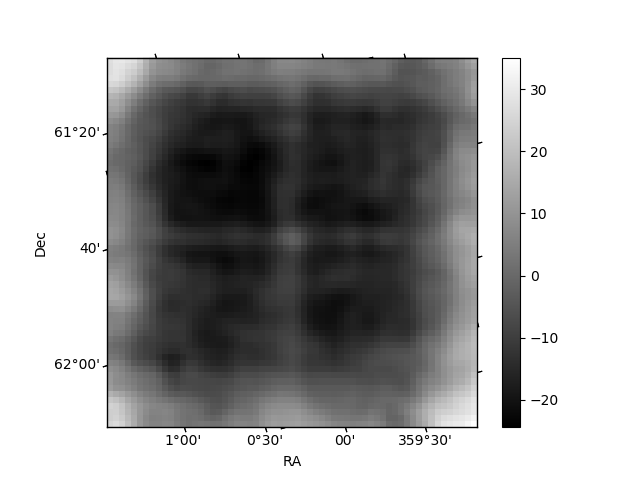
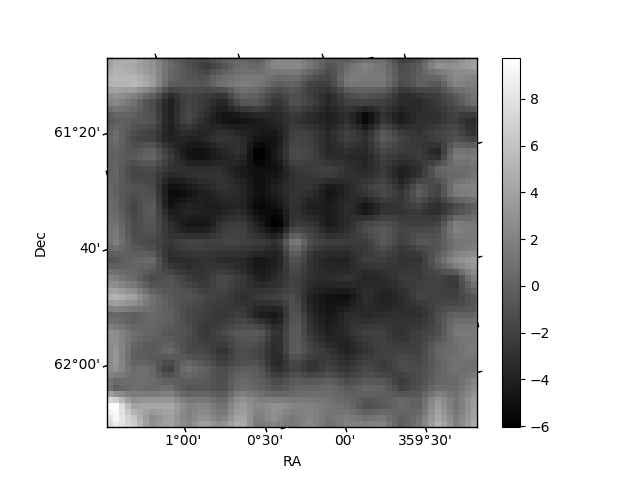
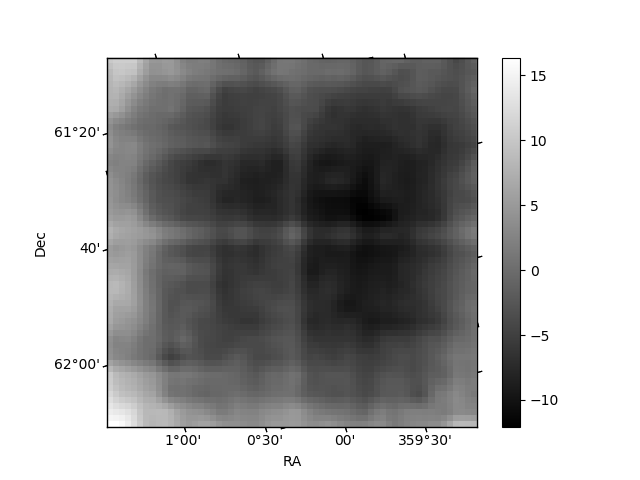
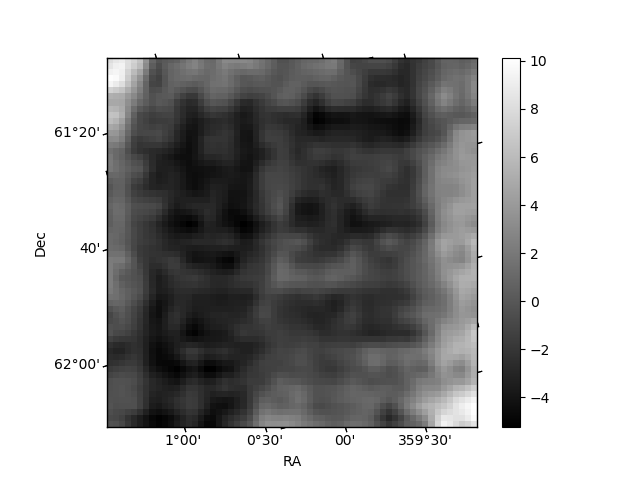
Histogram calculated using DETX and DETY for each event in the final _common_clean file
| Quadrant A | 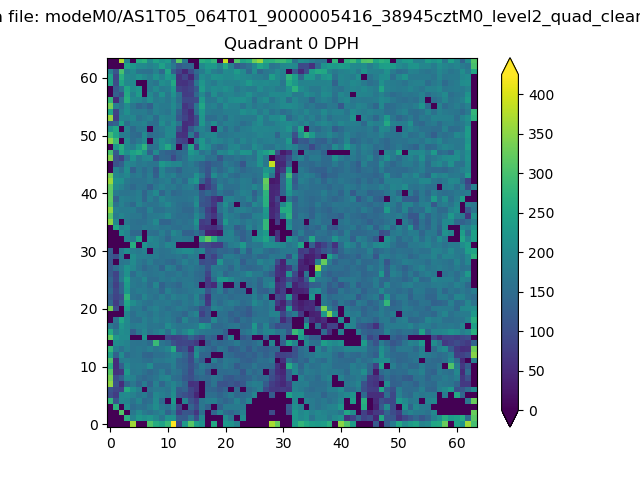 |
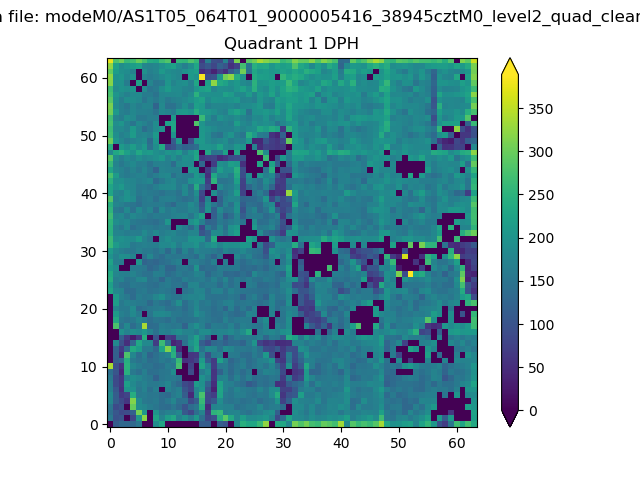 |
Quadrant B |
|---|---|---|---|
| Quadrant D | 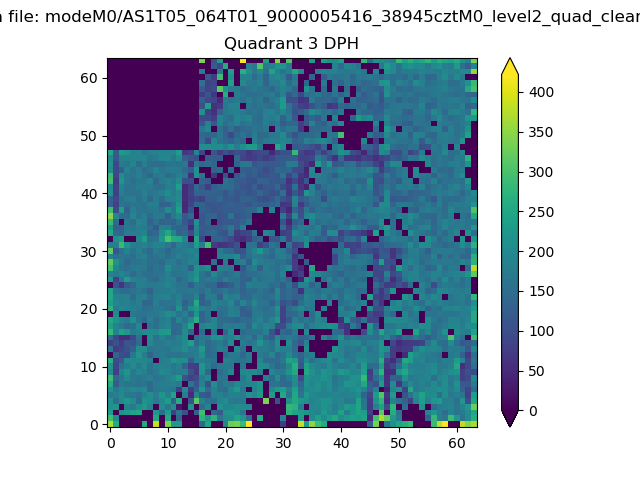 |
 |
Quadrant C |
| Plot type | Count rate plots | Images |
|---|---|---|
| Comparison with Poisson distribution Blue bars denote a histogram of data divided into 1 sec bins. Red curve is a Poisson curve with rate = median count rate of data. |
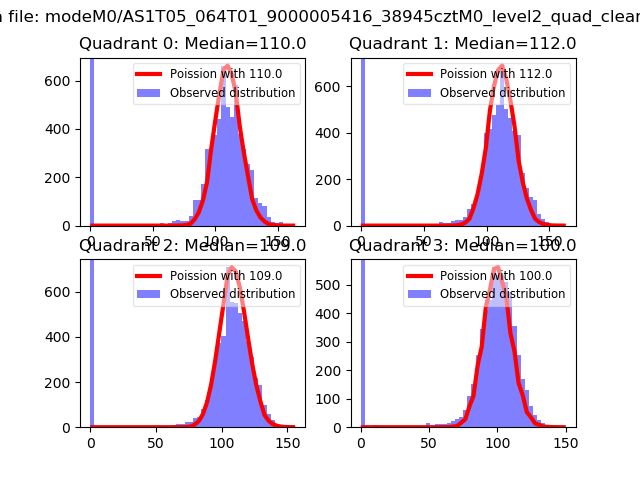 |
 |
| Quadrant-wise count rates Data is divided into 100 sec bins |
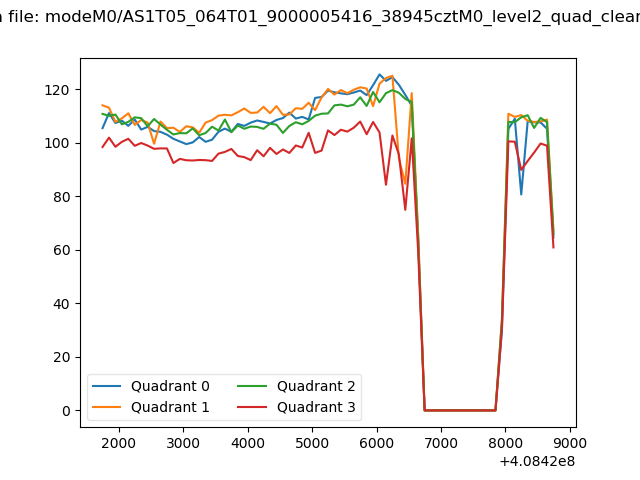 |
|
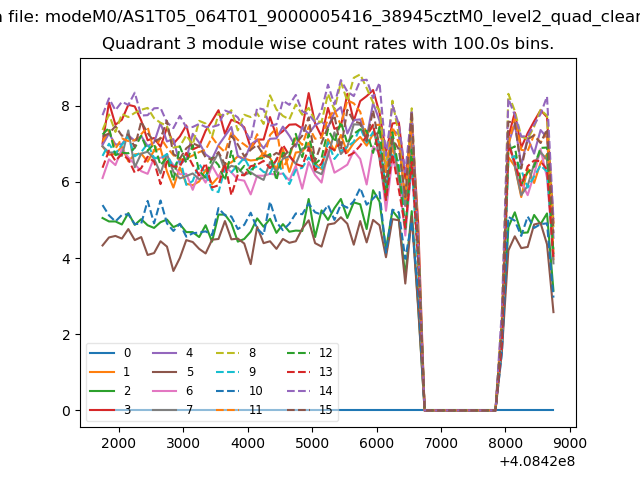
| Module-wise count rates for Quadrant A Data is divided into 100 sec bins |
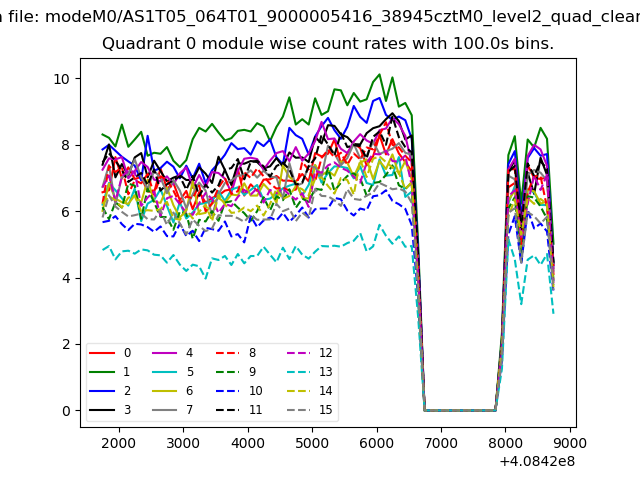 |
 |
| Module-wise count rates for Quadrant B Data is divided into 100 sec bins |
 |
 |
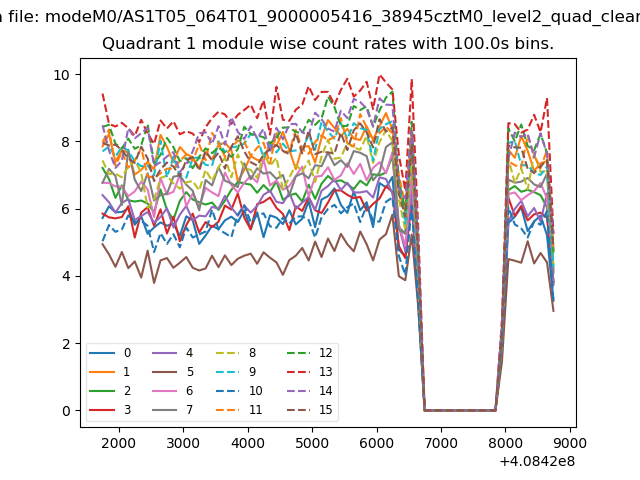
| Module-wise count rates for Quadrant C Data is divided into 100 sec bins |
 |
 |
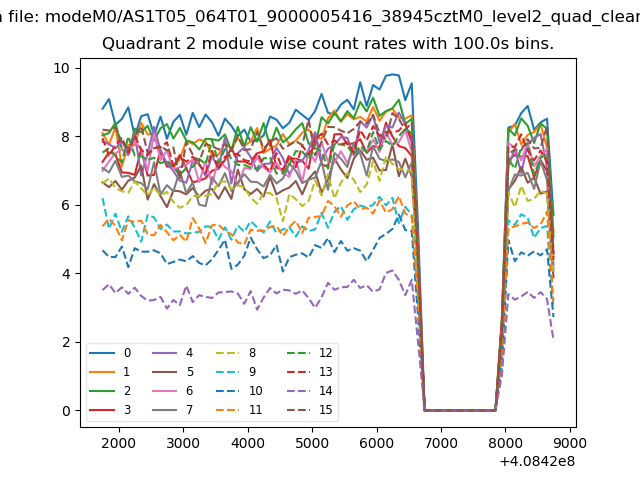
| Module-wise count rates for Quadrant D Data is divided into 100 sec bins |
 |
 |
| Parameter | Plot |
|---|---|
| CZT HV Monitor | 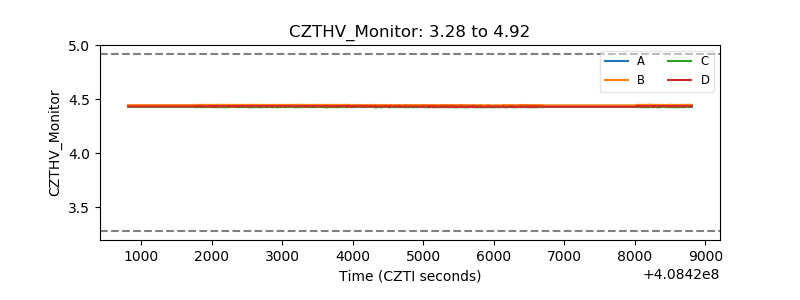 |
| D_VDD | 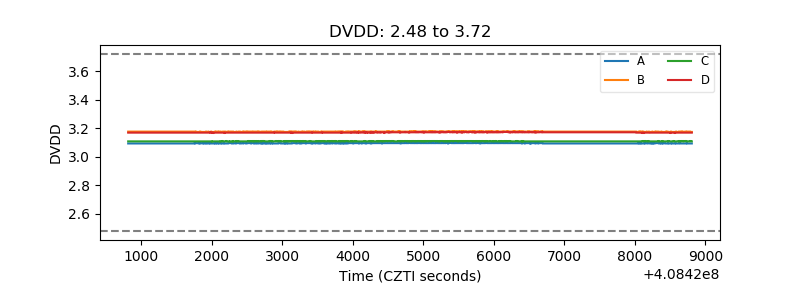 |
| Temperature 1 | 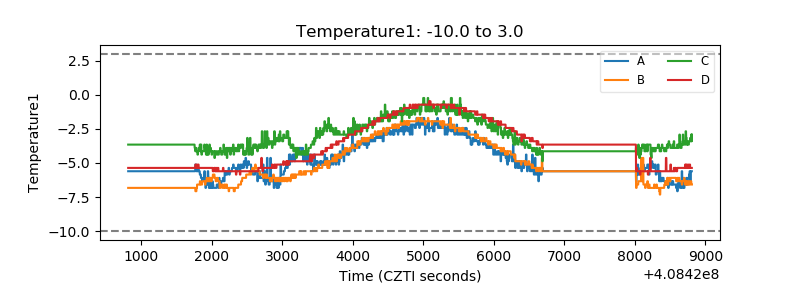 |
| Veto HV Monitor |  |
| Veto LLD | 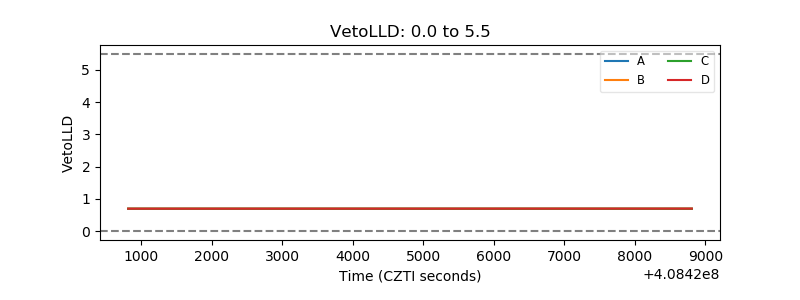 |
| Alpha Counter | 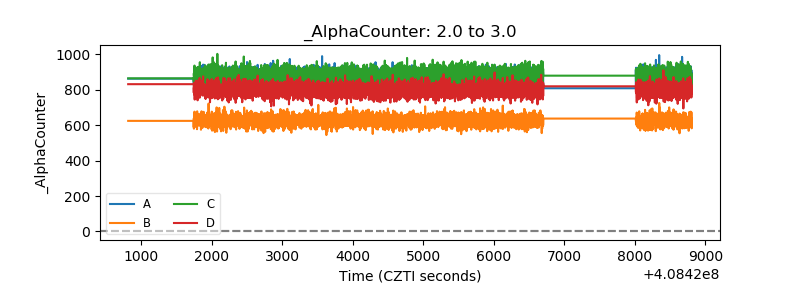 |
| _CPM_Rate | 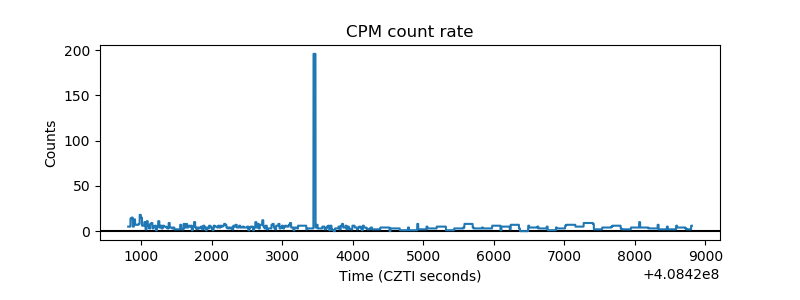 |
| CZT Counter | 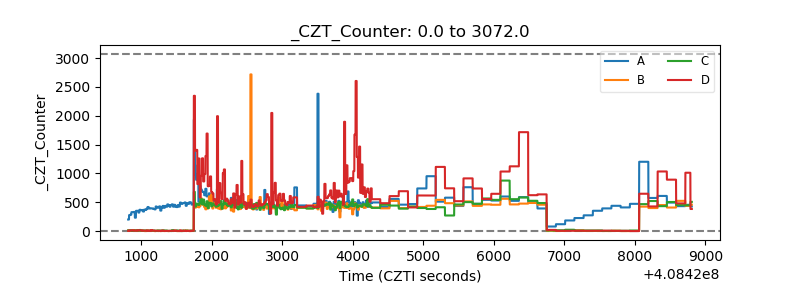 |
| +2.5 Volts monitor | 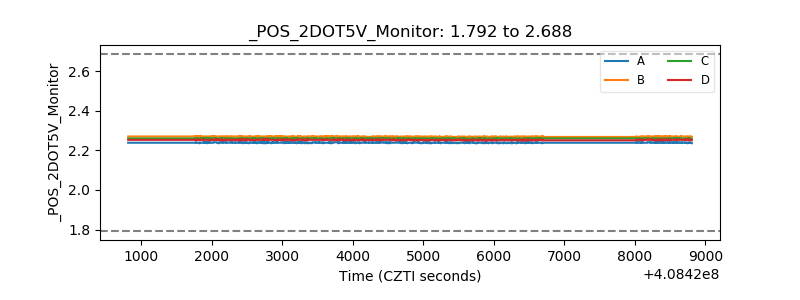 |
| +5 Volts monitor | 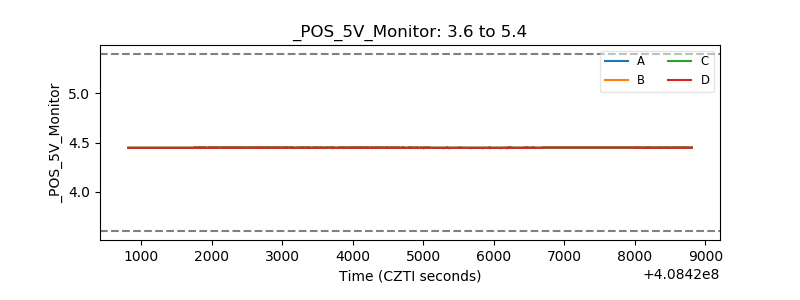 |
| _ROLL_ROT | 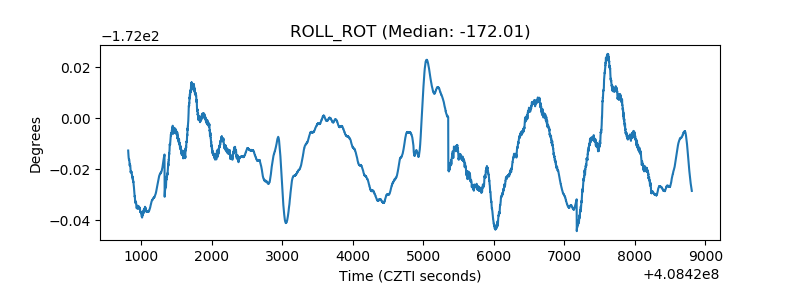 |
| _Roll_DEC | 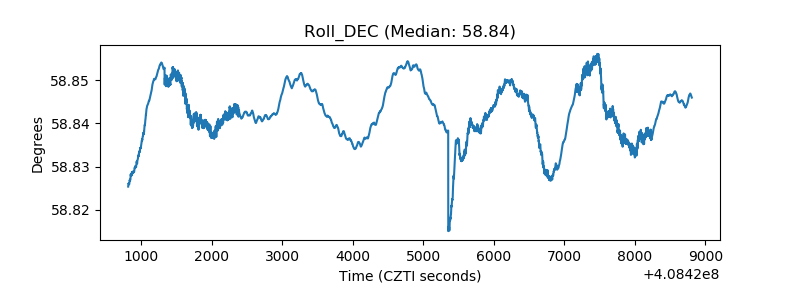 |
| _Roll_RA | 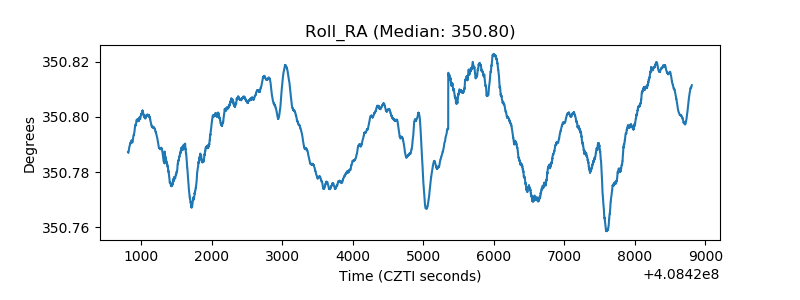 |
| Veto Counter | 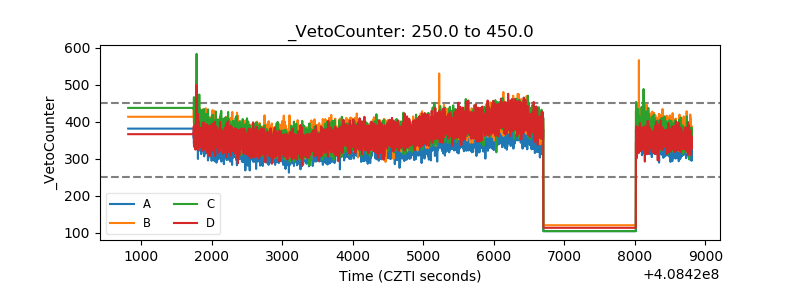 |