| Param | Original file | Final file |
|---|---|---|
| Filename | modeM0/AS1T05_064T01_9000005416_38948cztM0_level2.fits | modeM0/AS1T05_064T01_9000005416_38948cztM0_level2_quad_clean.evt |
| Size (bytes) | 1,021,561,920 | 262,704,960 |
| Size | 974.2 MB | 250.5 MB |
| Events in quadrant A | 8,324,423 | 1,771,517 |
| Events in quadrant B | 7,819,892 | 1,797,552 |
| Events in quadrant C | 8,333,187 | 1,741,675 |
| Events in quadrant D | 12,090,897 | 1,532,446 |
| Mode SS | |||
|---|---|---|---|
| Quadrant | BADHDUFLAG | Total packets | Discarded packets |
| A | 0 | 330 | 0 |
| B | 0 | 330 | 0 |
| C | 0 | 330 | 0 |
| D | 0 | 330 | 0 |
| Mode M9 | |||
|---|---|---|---|
| Quadrant | BADHDUFLAG | Total packets | Discarded packets |
| A | 0 | 55 | 0 |
| B | 0 | 55 | 0 |
| C | 0 | 55 | 0 |
| D | 0 | 55 | 0 |
| Mode M0 | |||
|---|---|---|---|
| Quadrant | BADHDUFLAG | Total packets | Discarded packets |
| A | 0 | 34316 | 5 |
| B | 0 | 34012 | 4 |
| C | 0 | 34792 | 4 |
| D | 0 | 46746 | 4 |
| Quadrant | Total seconds | Saturated seconds | Saturation percentage |
|---|---|---|---|
| A | 16102 | 87 | 0.540306% |
| B | 16102 | 132 | 0.819774% |
| C | 16102 | 22 | 0.136629% |
| D | 16102 | 691 | 4.291392% |
Noise dominated data is calculated using 1-second bins in cleaned event files. If a bin has >2000 counts, and if more than 50% of those come from <1% of pixels, then it is considered to be noise-dominated and hence unusable.
| Quadrant | # 1 sec bins | Bins with >0 counts | Bins with >2000 counts | High rate bins dominated by noise | Noise dominated (total time) | Noise dominated (detector-on time) | Marked lightcurve |
|---|---|---|---|---|---|---|---|
| A | 21592 | 16106 | 58 | 58 | 0.27% | 0.36% | 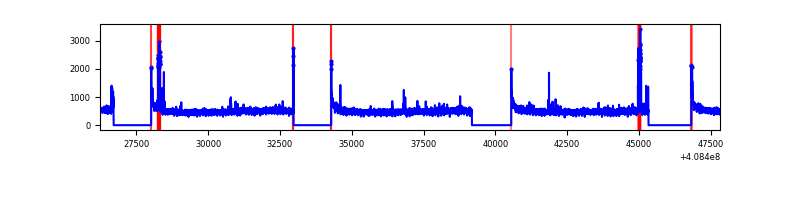 |
| B | 21592 | 16106 | 99 | 99 | 0.46% | 0.61% | 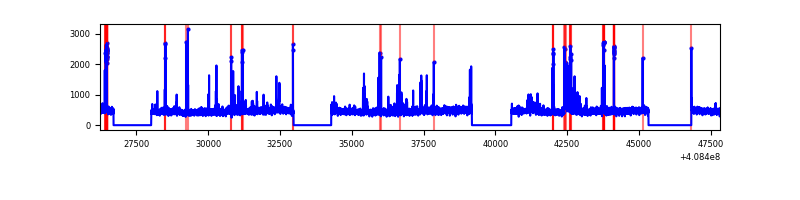 |
| C | 21592 | 16106 | 2 | 2 | 0.01% | 0.01% | 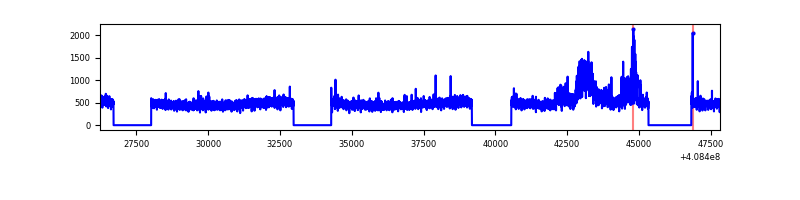 |
| D | 21592 | 16106 | 684 | 684 | 3.17% | 4.25% | 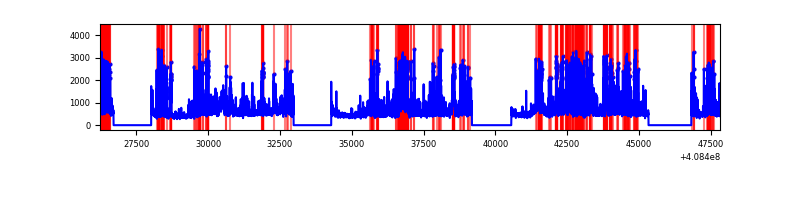 |
Top three noisy pixels from each quadrant. If the there are fewer than three noisy pixels in the level2.evt file, extra rows are filled as -1
| Pixel properties | Quadrant properties | ||||||
|---|---|---|---|---|---|---|---|
| Quadrant | DetID | PixID | Counts | Sigma | Mean | Median | Sigma |
| A | 10 | 83 | 1111537 | 3055.52 | 1795 | 1753 | 363.2 |
| A | 13 | 248 | 168323 | 458.61 | 1795 | 1753 | 363.2 |
| A | 9 | 143 | 83508 | 225.09 | 1795 | 1753 | 363.2 |
| B | 5 | 172 | 386968 | 1131.78 | 1777 | 1726 | 340.4 |
| B | 5 | 200 | 218288 | 636.23 | 1777 | 1726 | 340.4 |
| B | 0 | 230 | 74996 | 215.26 | 1777 | 1726 | 340.4 |
| C | 14 | 254 | 764492 | 1875.55 | 1757 | 1767 | 406.7 |
| C | 15 | 214 | 683159 | 1675.55 | 1757 | 1767 | 406.7 |
| C | 1 | 128 | 11952 | 25.04 | 1757 | 1767 | 406.7 |
| D | 12 | 227 | 1409812 | 3339.55 | 1733 | 1684 | 421.7 |
| D | 12 | 235 | 826472 | 1956.09 | 1733 | 1684 | 421.7 |
| D | 12 | 233 | 778573 | 1842.49 | 1733 | 1684 | 421.7 |
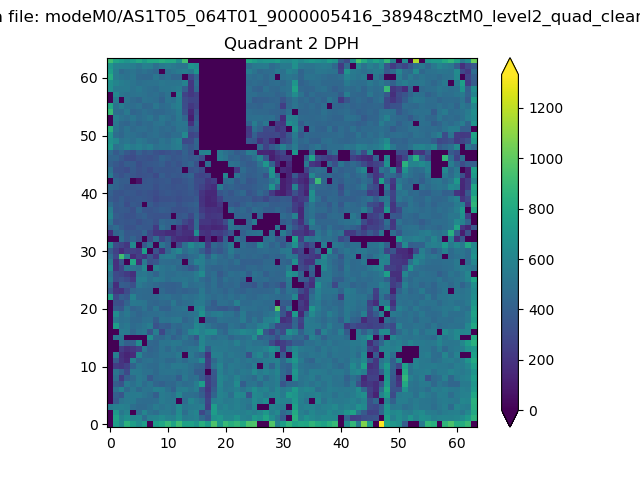
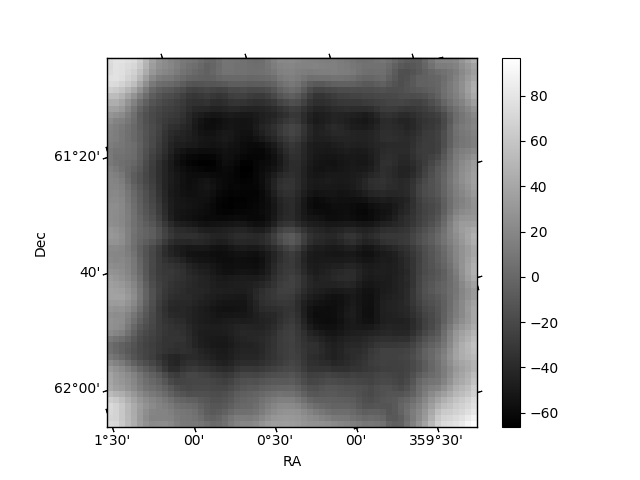
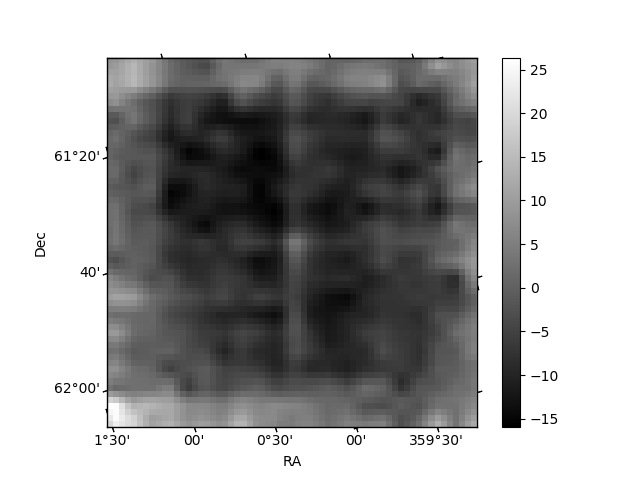
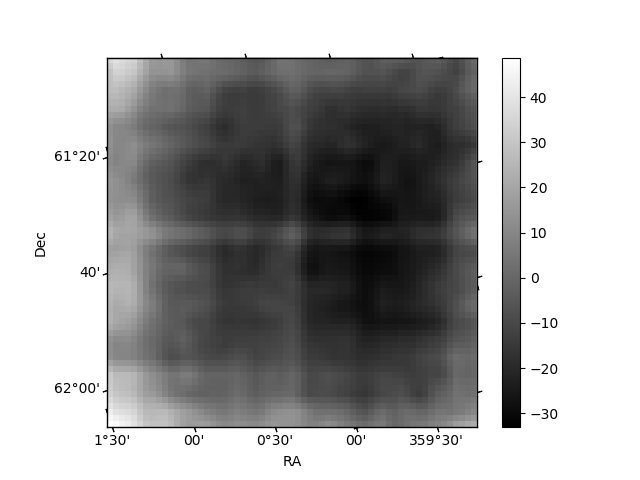
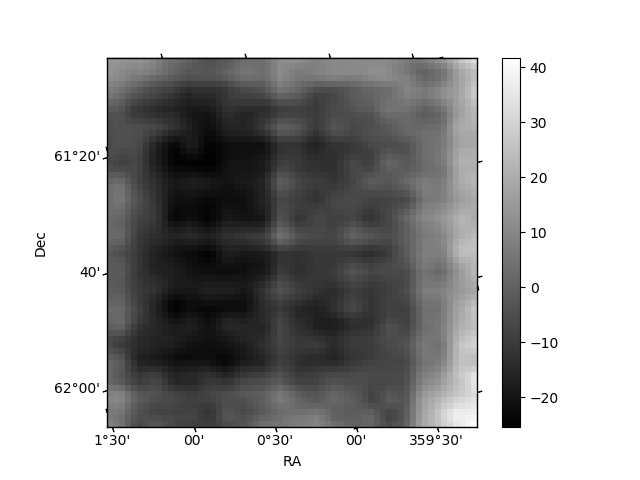
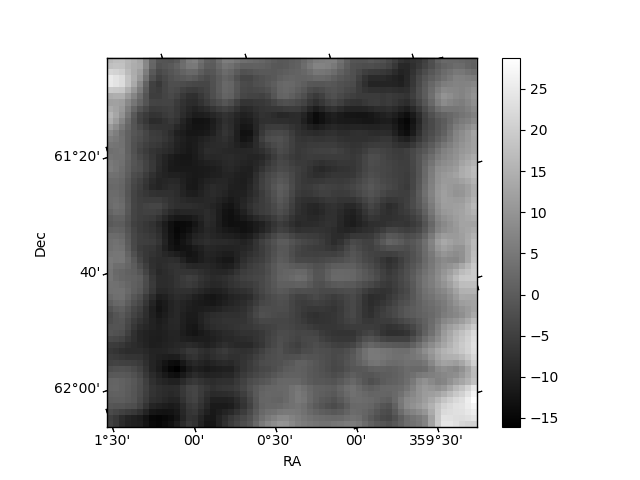
Histogram calculated using DETX and DETY for each event in the final _common_clean file
| Quadrant A | 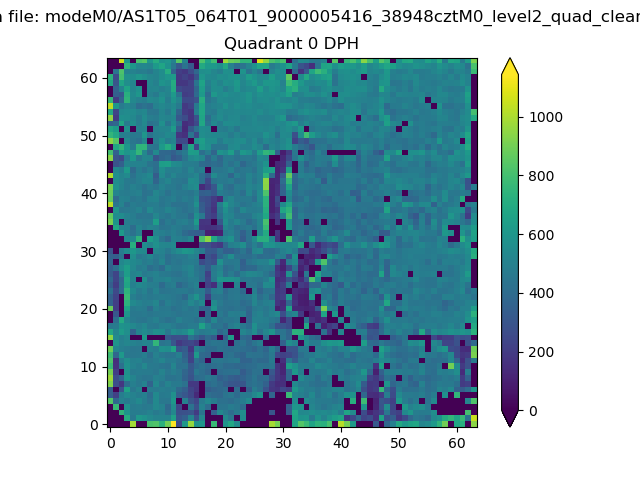 |
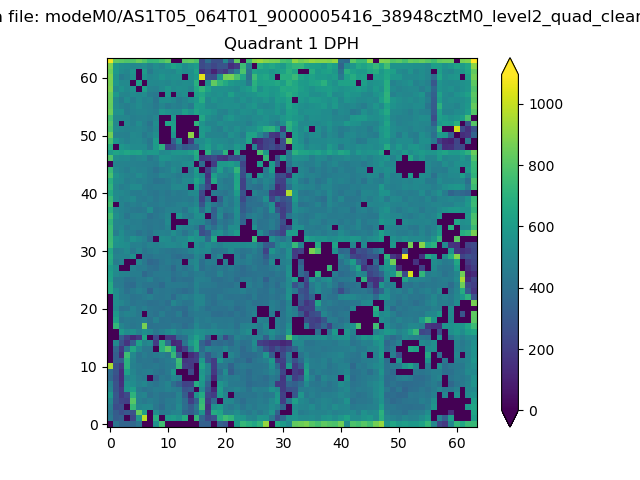 |
Quadrant B |
|---|---|---|---|
| Quadrant D | 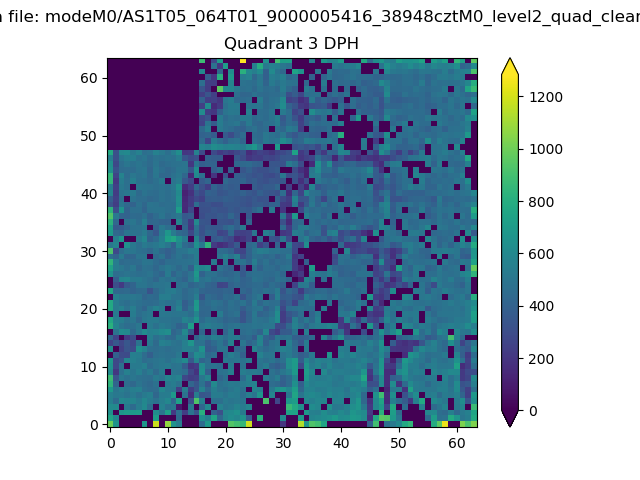 |
 |
Quadrant C |
| Plot type | Count rate plots | Images |
|---|---|---|
| Comparison with Poisson distribution Blue bars denote a histogram of data divided into 1 sec bins. Red curve is a Poisson curve with rate = median count rate of data. |
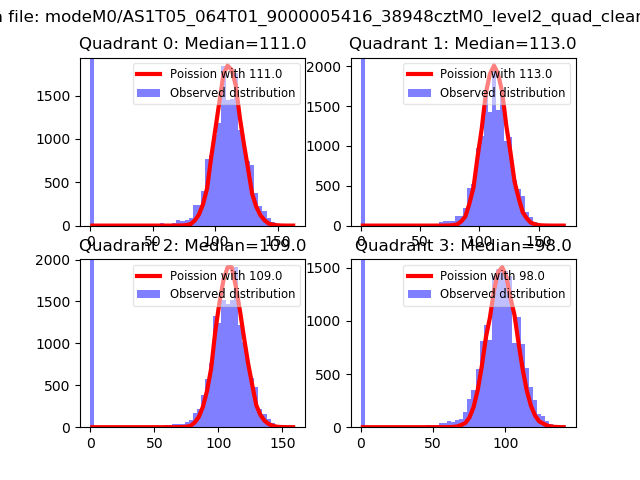 |
 |
| Quadrant-wise count rates Data is divided into 100 sec bins |
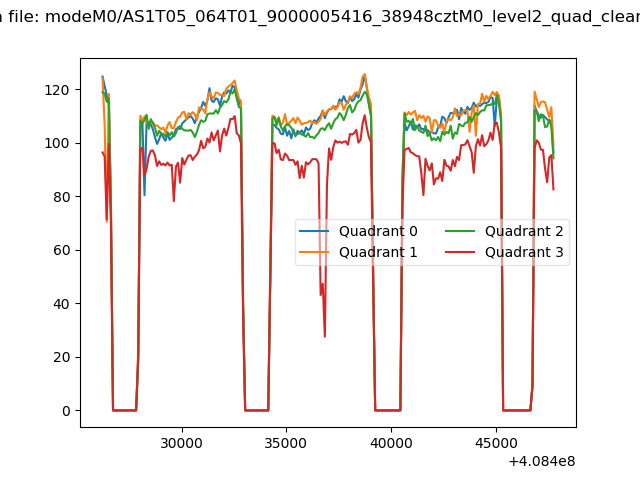 |
|
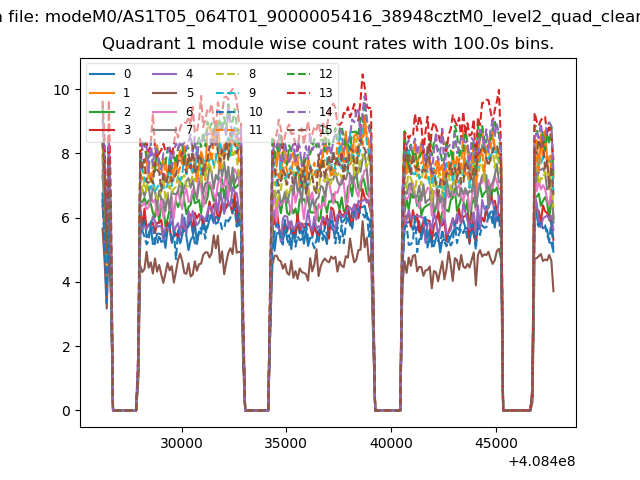
| Module-wise count rates for Quadrant A Data is divided into 100 sec bins |
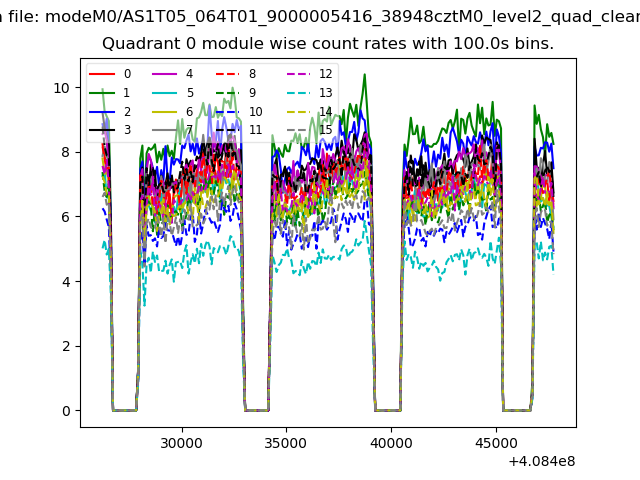 |
 |
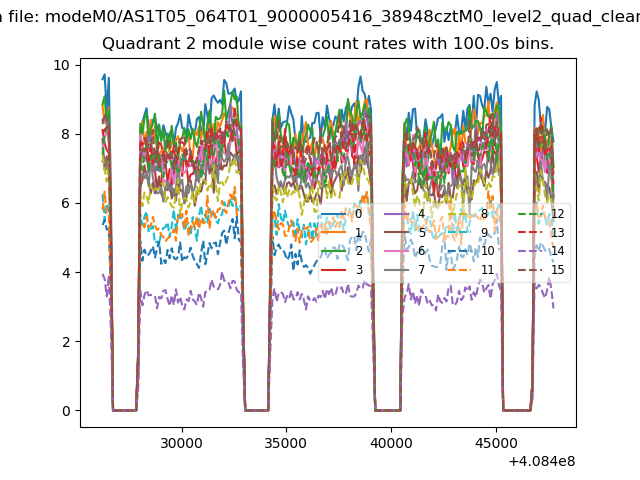
| Module-wise count rates for Quadrant B Data is divided into 100 sec bins |
 |
 |
| Module-wise count rates for Quadrant C Data is divided into 100 sec bins |
 |
 |
| Module-wise count rates for Quadrant D Data is divided into 100 sec bins |
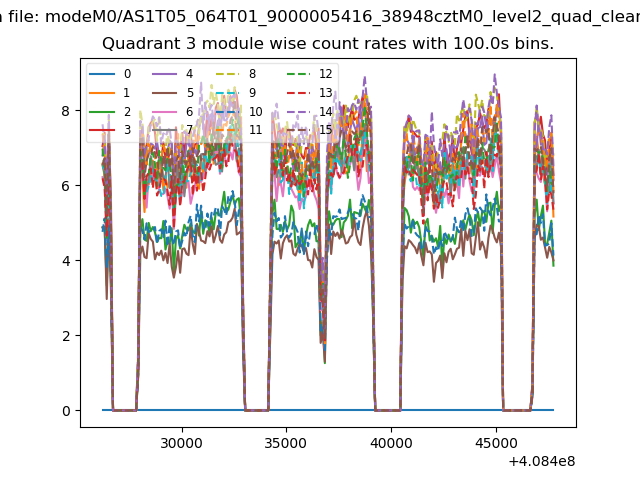 |
 |
| Parameter | Plot |
|---|---|
| CZT HV Monitor | 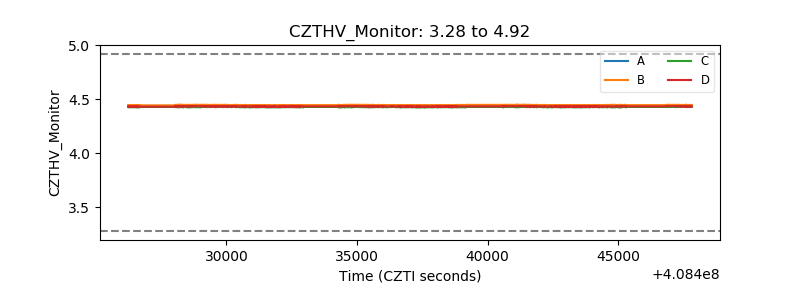 |
| D_VDD | 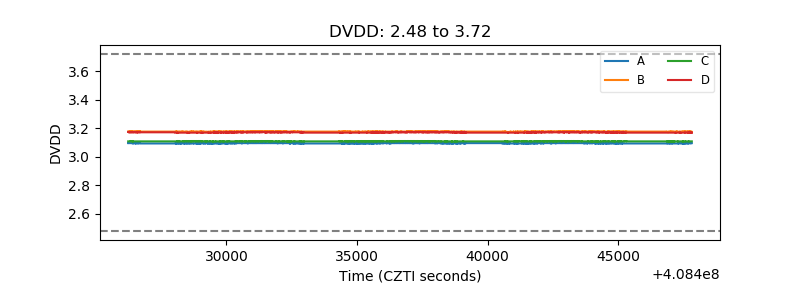 |
| Temperature 1 | 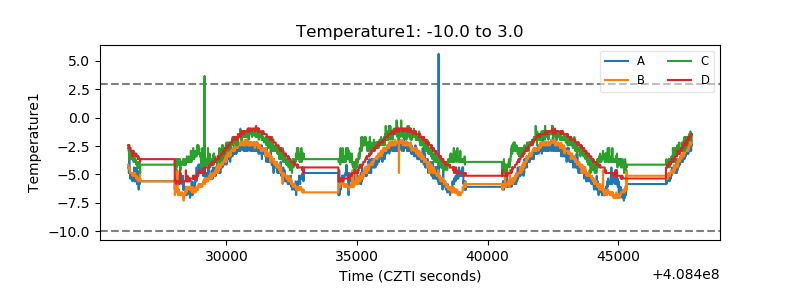 |
| Veto HV Monitor | 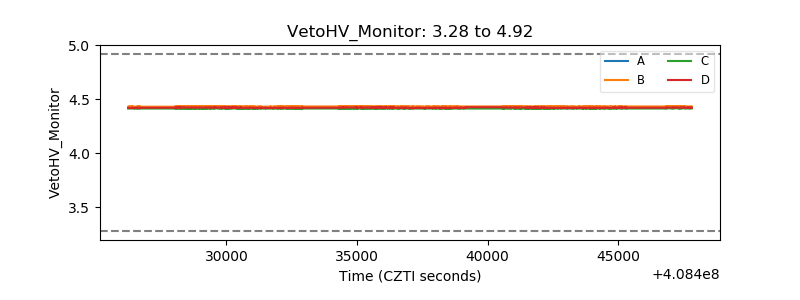 |
| Veto LLD | 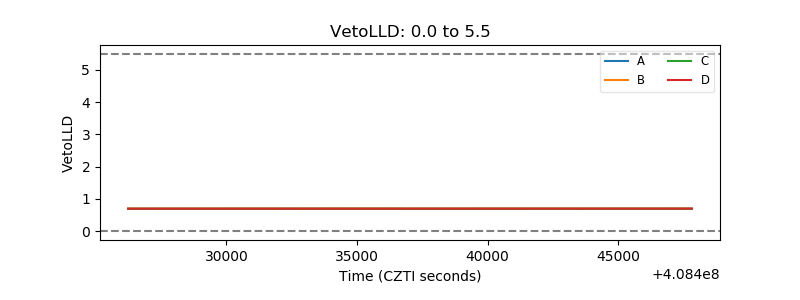 |
| Alpha Counter | 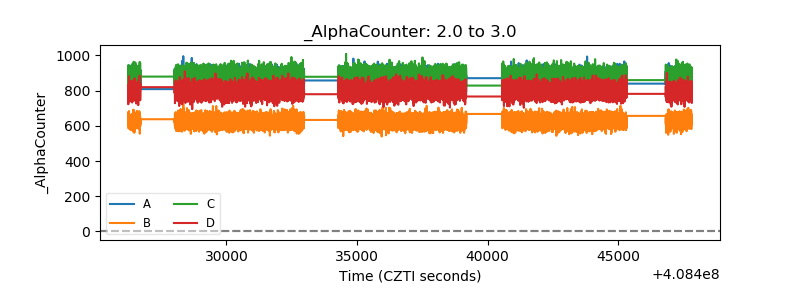 |
| _CPM_Rate | 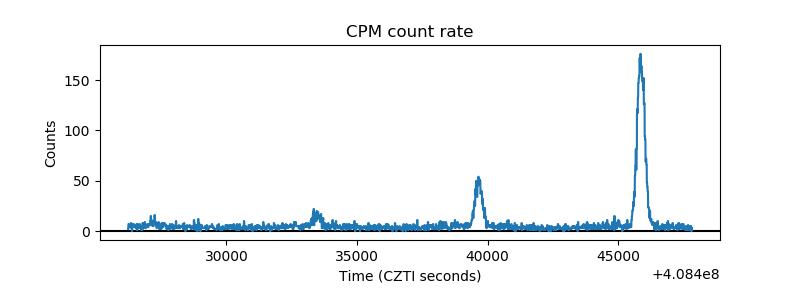 |
| CZT Counter | 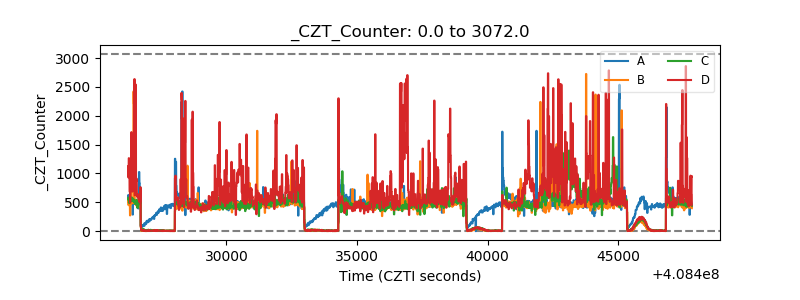 |
| +2.5 Volts monitor | 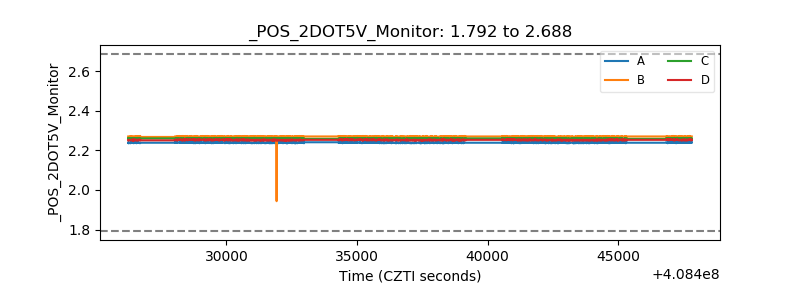 |
| +5 Volts monitor | 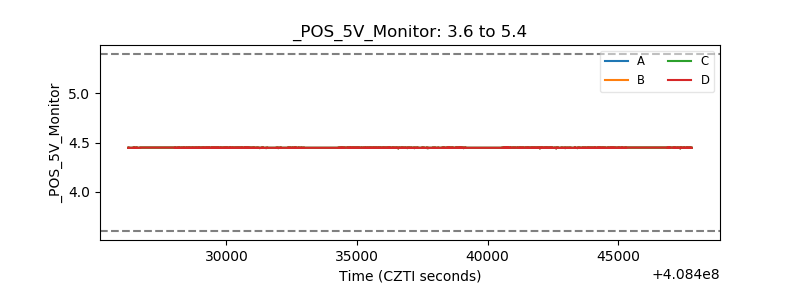 |
| _ROLL_ROT | 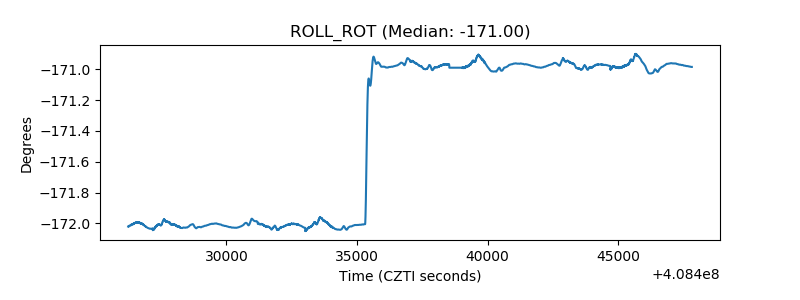 |
| _Roll_DEC | 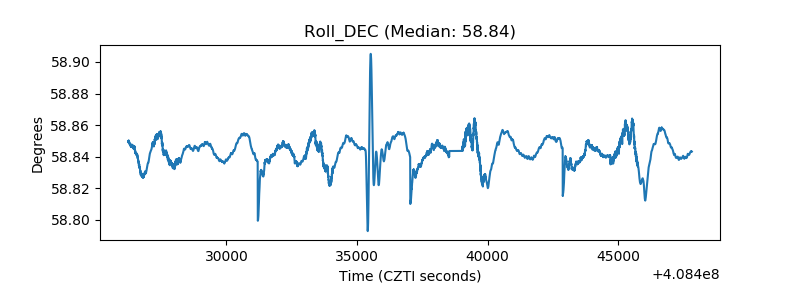 |
| _Roll_RA | 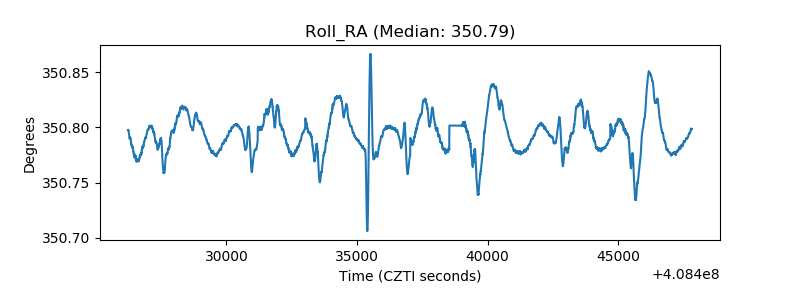 |
| Veto Counter | 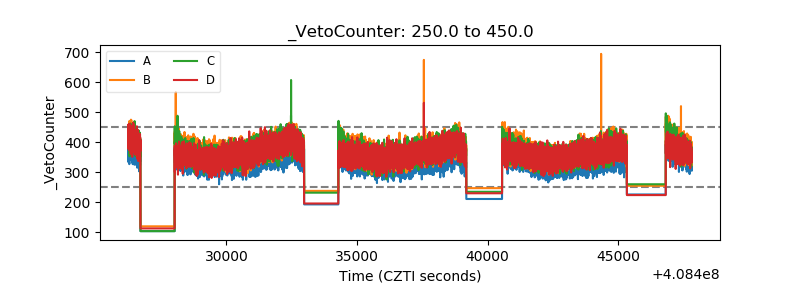 |