| Param | Original file | Final file |
|---|---|---|
| Filename | modeM0/AS1T05_064T01_9000005416_38949cztM0_level2.fits | modeM0/AS1T05_064T01_9000005416_38949cztM0_level2_quad_clean.evt |
| Size (bytes) | 364,913,280 | 91,054,080 |
| Size | 348.0 MB | 86.8 MB |
| Events in quadrant A | 2,915,625 | 619,353 |
| Events in quadrant B | 2,818,314 | 623,411 |
| Events in quadrant C | 3,313,102 | 591,390 |
| Events in quadrant D | 4,029,056 | 535,031 |
| Mode SS | |||
|---|---|---|---|
| Quadrant | BADHDUFLAG | Total packets | Discarded packets |
| A | 0 | 112 | 0 |
| B | 0 | 112 | 0 |
| C | 0 | 112 | 0 |
| D | 0 | 112 | 0 |
| Mode M9 | |||
|---|---|---|---|
| Quadrant | BADHDUFLAG | Total packets | Discarded packets |
| A | 0 | 21 | 0 |
| B | 0 | 21 | 0 |
| C | 0 | 21 | 0 |
| D | 0 | 22 | 0 |
| Mode M0 | |||
|---|---|---|---|
| Quadrant | BADHDUFLAG | Total packets | Discarded packets |
| A | 0 | 12063 | 3 |
| B | 0 | 12032 | 2 |
| C | 0 | 13392 | 2 |
| D | 0 | 15538 | 2 |
| Quadrant | Total seconds | Saturated seconds | Saturation percentage |
|---|---|---|---|
| A | 5545 | 26 | 0.468891% |
| B | 5545 | 103 | 1.857529% |
| C | 5545 | 130 | 2.344454% |
| D | 5545 | 335 | 6.041479% |
Noise dominated data is calculated using 1-second bins in cleaned event files. If a bin has >2000 counts, and if more than 50% of those come from <1% of pixels, then it is considered to be noise-dominated and hence unusable.
| Quadrant | # 1 sec bins | Bins with >0 counts | Bins with >2000 counts | High rate bins dominated by noise | Noise dominated (total time) | Noise dominated (detector-on time) | Marked lightcurve |
|---|---|---|---|---|---|---|---|
| A | 7159 | 5546 | 14 | 14 | 0.20% | 0.25% | 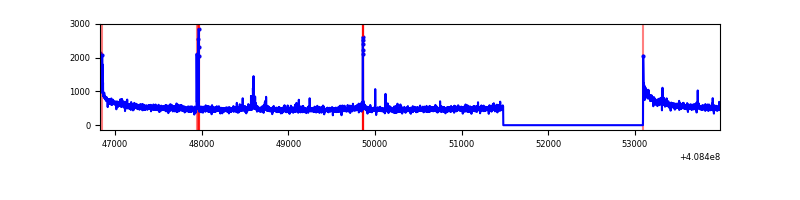 |
| B | 7159 | 5546 | 90 | 90 | 1.26% | 1.62% | 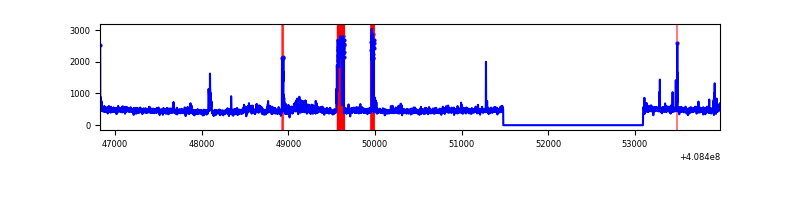 |
| C | 7159 | 5546 | 130 | 130 | 1.82% | 2.34% | 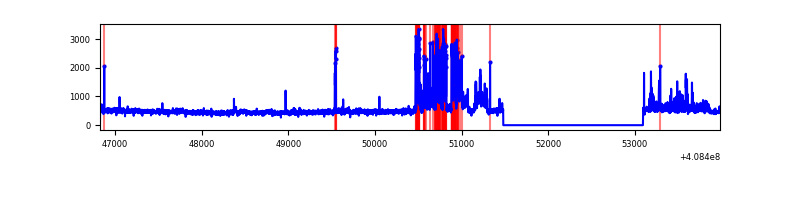 |
| D | 7159 | 5546 | 326 | 326 | 4.55% | 5.88% | 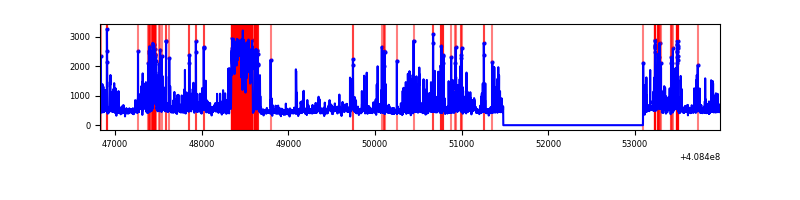 |
Top three noisy pixels from each quadrant. If the there are fewer than three noisy pixels in the level2.evt file, extra rows are filled as -1
| Pixel properties | Quadrant properties | ||||||
|---|---|---|---|---|---|---|---|
| Quadrant | DetID | PixID | Counts | Sigma | Mean | Median | Sigma |
| A | 10 | 83 | 428928 | 3408.19 | 617 | 603 | 125.7 |
| A | 13 | 248 | 44474 | 349.08 | 617 | 603 | 125.7 |
| A | 9 | 143 | 38332 | 300.21 | 617 | 603 | 125.7 |
| B | 5 | 172 | 282719 | 2404.74 | 604 | 588 | 117.3 |
| B | 0 | 230 | 61932 | 522.86 | 604 | 588 | 117.3 |
| B | 0 | 229 | 38894 | 326.5 | 604 | 588 | 117.3 |
| C | 14 | 254 | 735944 | 5256.15 | 594 | 598 | 139.9 |
| C | 15 | 214 | 244521 | 1743.53 | 594 | 598 | 139.9 |
| C | 1 | 128 | 11539 | 78.2 | 594 | 598 | 139.9 |
| D | 12 | 227 | 842281 | 5838.72 | 591 | 573 | 144.2 |
| D | 2 | 16 | 234122 | 1620.07 | 591 | 573 | 144.2 |
| D | 12 | 6 | 230954 | 1598.09 | 591 | 573 | 144.2 |
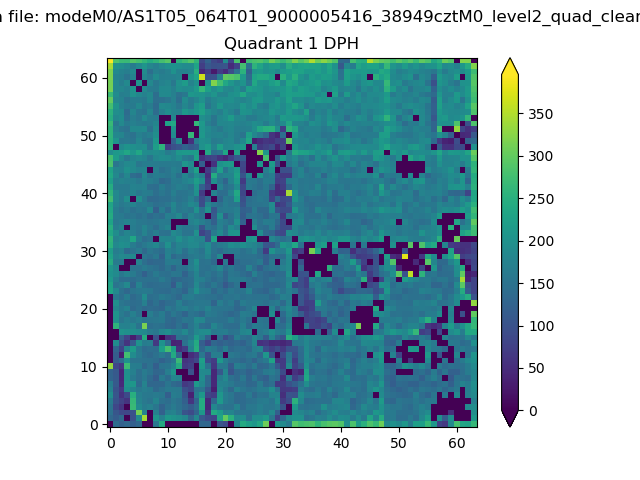
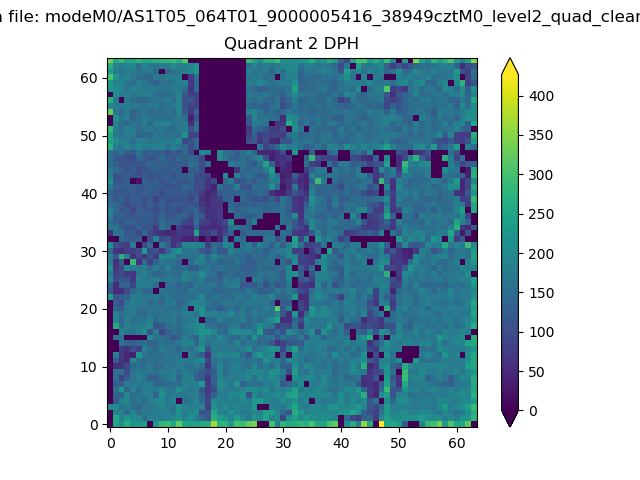
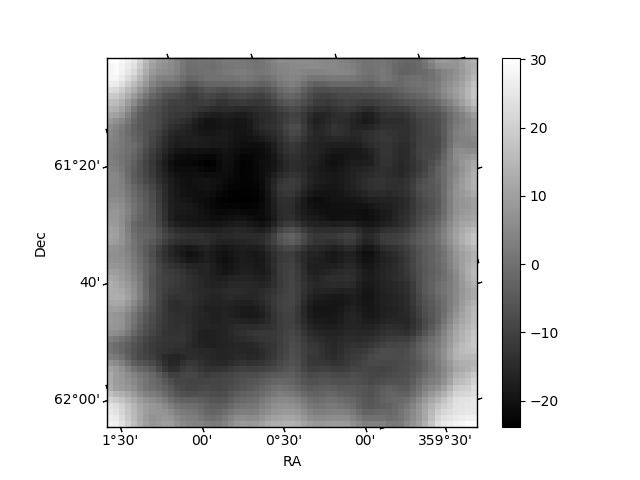
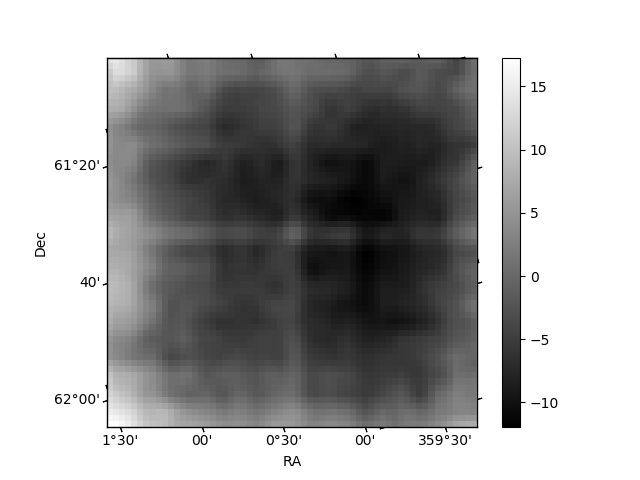
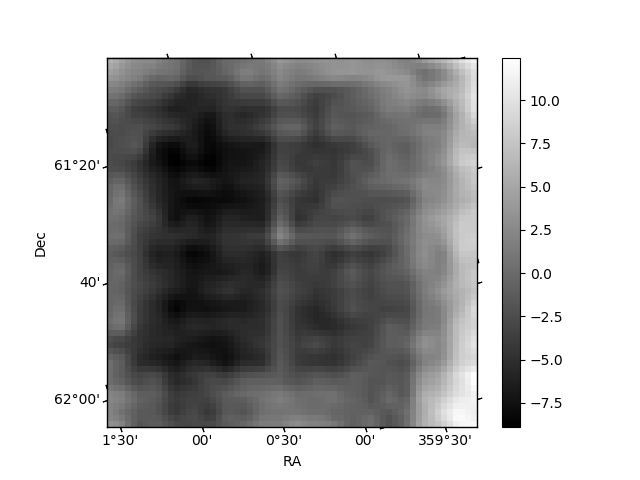
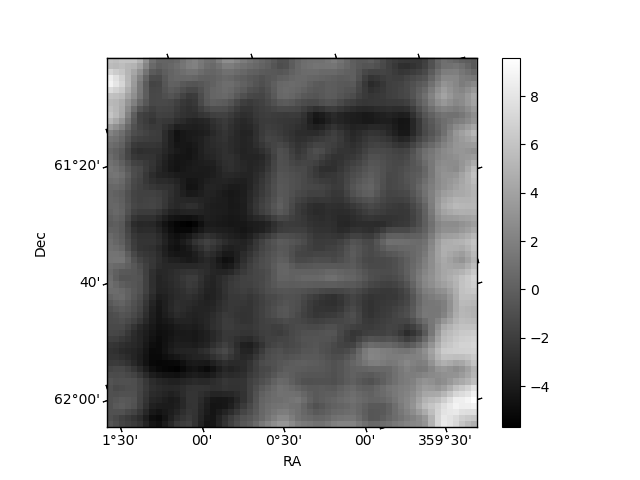
Histogram calculated using DETX and DETY for each event in the final _common_clean file
| Quadrant A |  |
 |
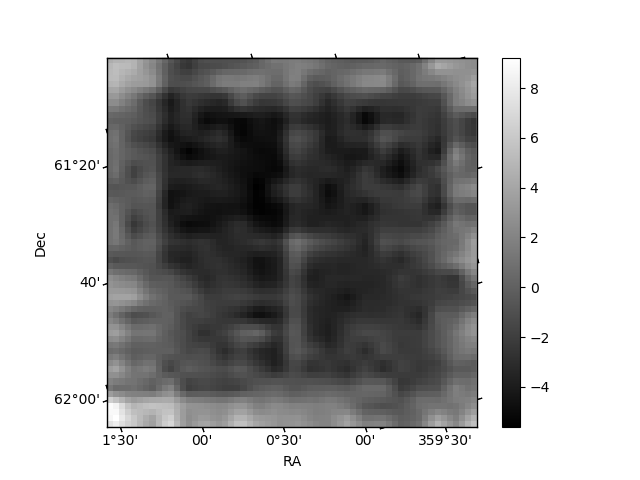
Quadrant B |
|---|---|---|---|
| Quadrant D | 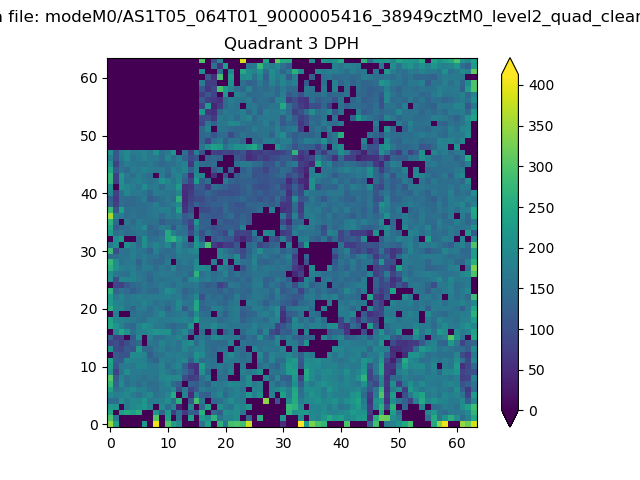 |
 |
Quadrant C |
| Plot type | Count rate plots | Images |
|---|---|---|
| Comparison with Poisson distribution Blue bars denote a histogram of data divided into 1 sec bins. Red curve is a Poisson curve with rate = median count rate of data. |
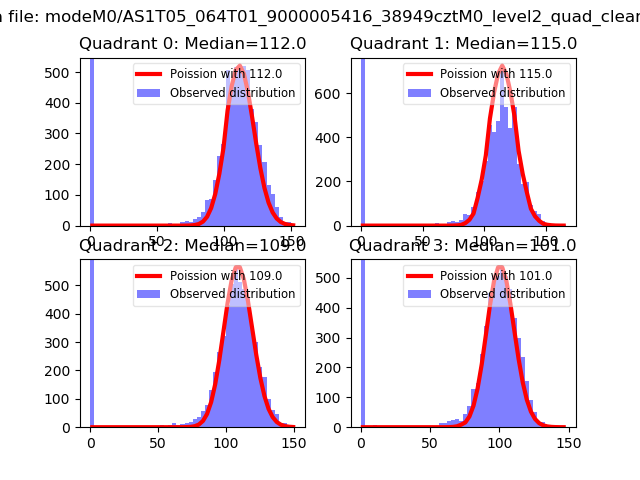 |
 |
| Quadrant-wise count rates Data is divided into 100 sec bins |
 |
|
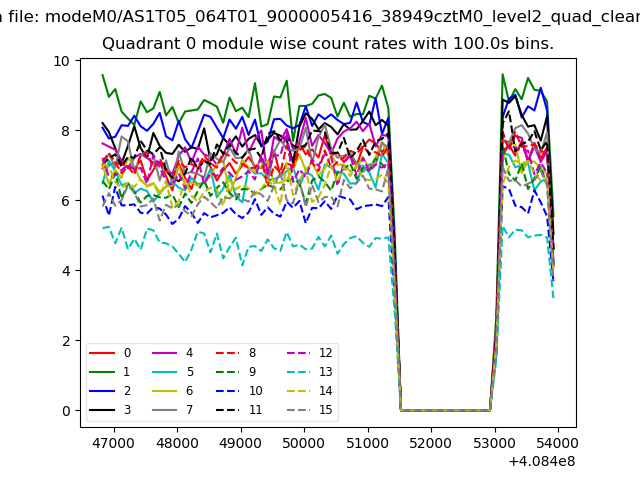
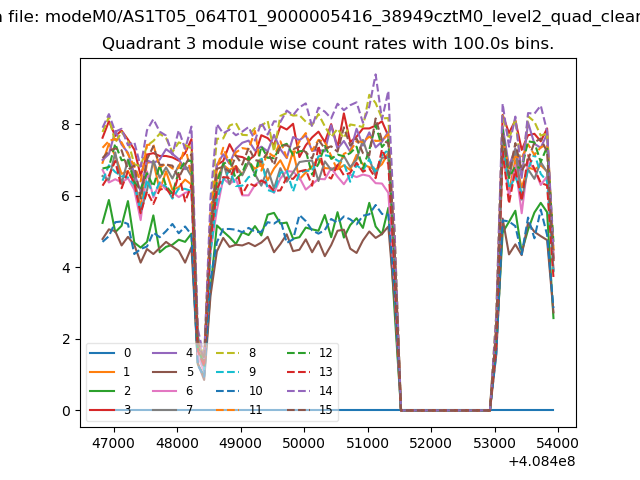
| Module-wise count rates for Quadrant A Data is divided into 100 sec bins |
 |
 |
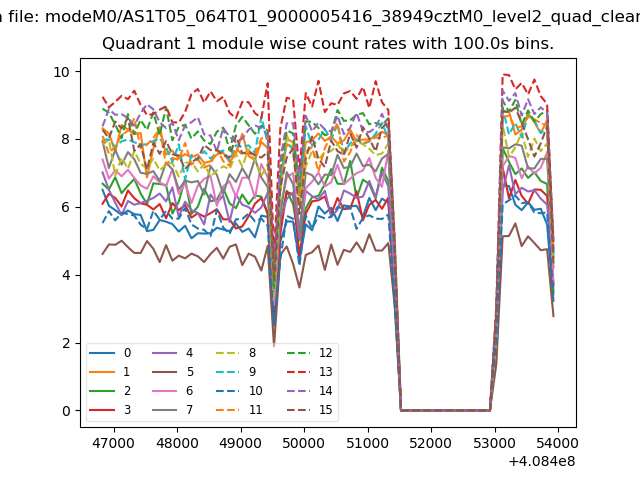
| Module-wise count rates for Quadrant B Data is divided into 100 sec bins |
 |
 |
| Module-wise count rates for Quadrant C Data is divided into 100 sec bins |
 |
 |
| Module-wise count rates for Quadrant D Data is divided into 100 sec bins |
 |
 |
| Parameter | Plot |
|---|---|
| CZT HV Monitor | 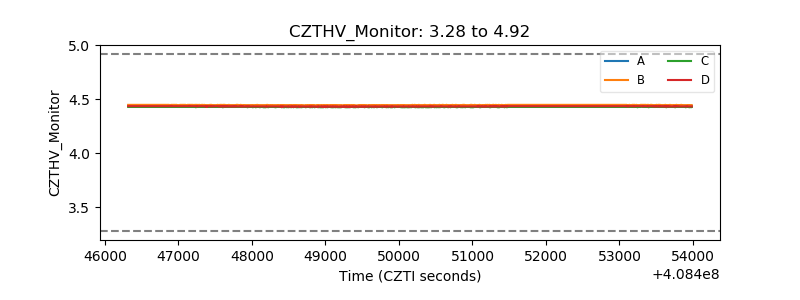 |
| D_VDD | 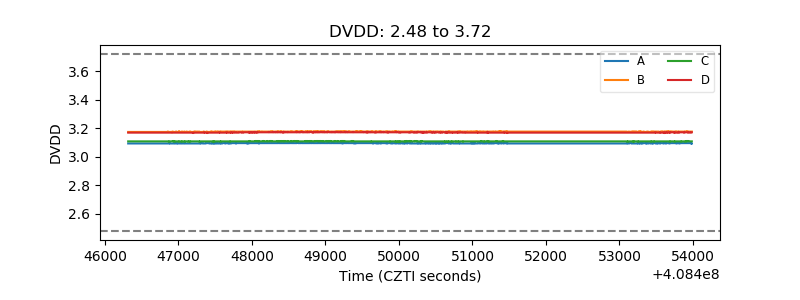 |
| Temperature 1 | 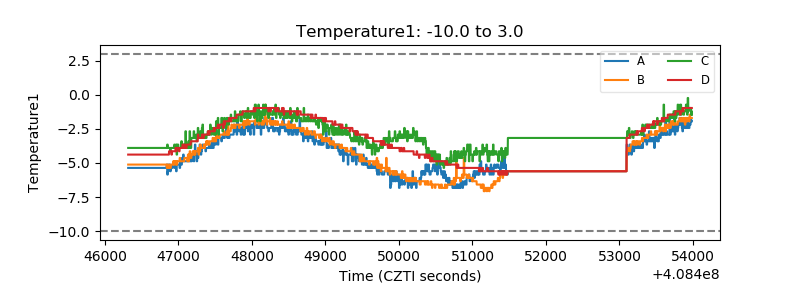 |
| Veto HV Monitor | 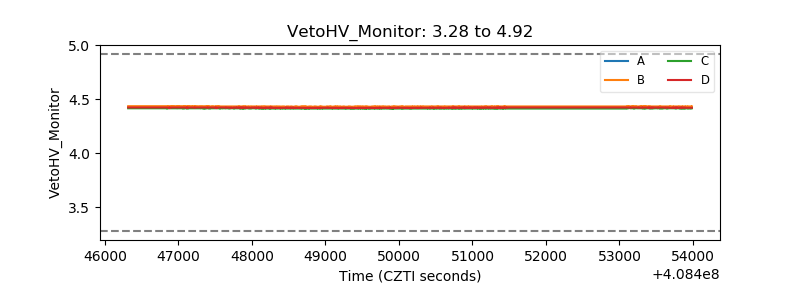 |
| Veto LLD | 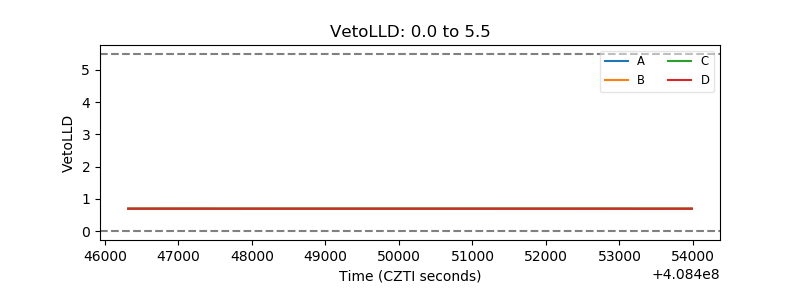 |
| Alpha Counter | 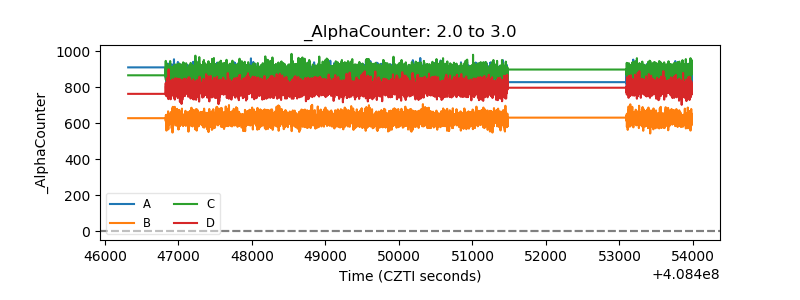 |
| _CPM_Rate | 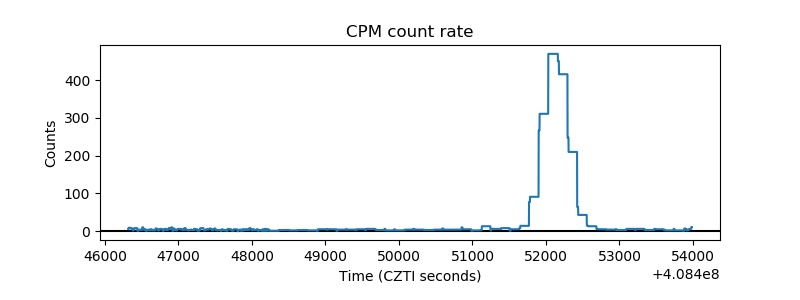 |
| CZT Counter | 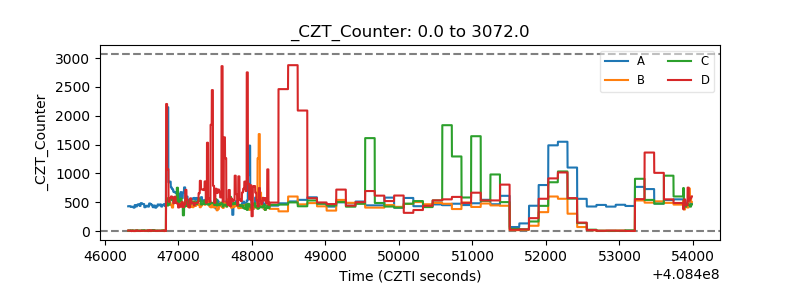 |
| +2.5 Volts monitor | 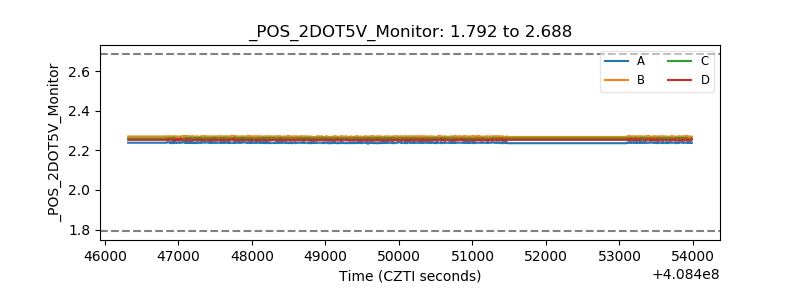 |
| +5 Volts monitor | 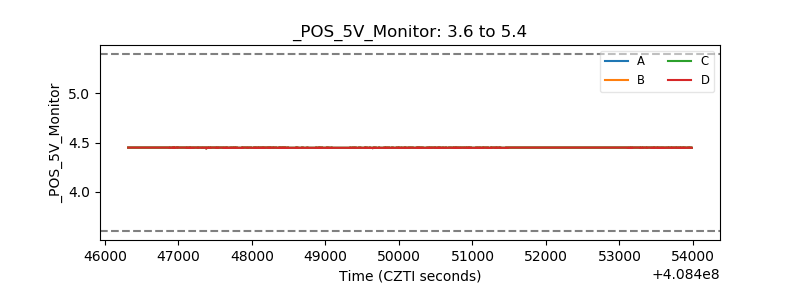 |
| _ROLL_ROT | 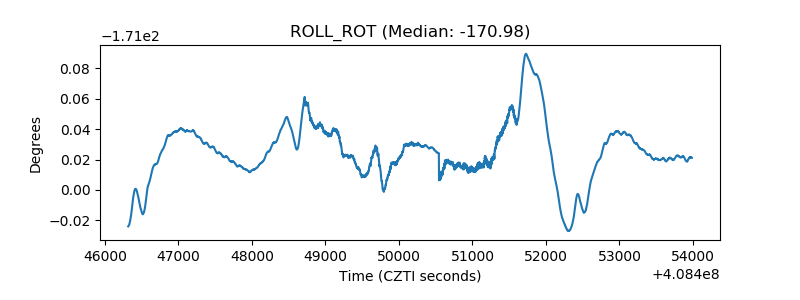 |
| _Roll_DEC | 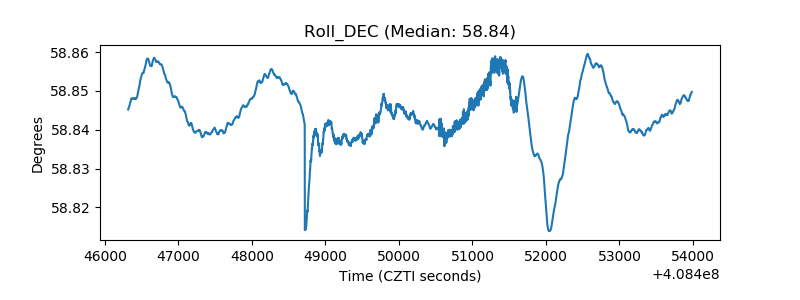 |
| _Roll_RA | 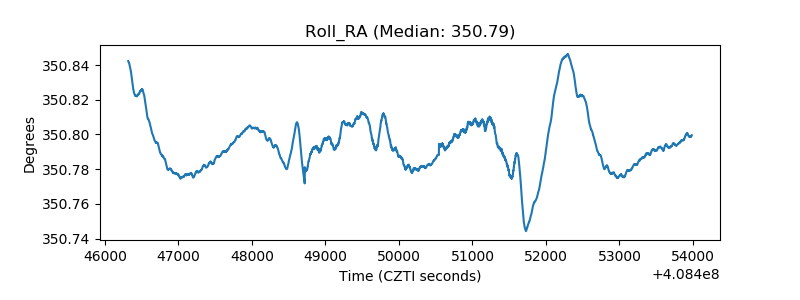 |
| Veto Counter | 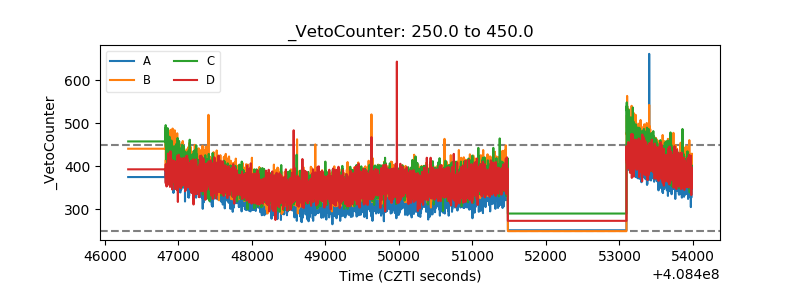 |