| Param | Original file | Final file |
|---|---|---|
| Filename | modeM0/AS1T05_064T01_9000005416_38951cztM0_level2.fits | modeM0/AS1T05_064T01_9000005416_38951cztM0_level2_quad_clean.evt |
| Size (bytes) | 357,589,440 | 96,004,800 |
| Size | 341.0 MB | 91.6 MB |
| Events in quadrant A | 3,019,472 | 653,919 |
| Events in quadrant B | 2,735,253 | 659,029 |
| Events in quadrant C | 2,823,237 | 628,595 |
| Events in quadrant D | 4,223,159 | 574,251 |
| Mode SS | |||
|---|---|---|---|
| Quadrant | BADHDUFLAG | Total packets | Discarded packets |
| A | 0 | 112 | 0 |
| B | 0 | 112 | 0 |
| C | 0 | 112 | 0 |
| D | 0 | 112 | 0 |
| Mode M9 | |||
|---|---|---|---|
| Quadrant | BADHDUFLAG | Total packets | Discarded packets |
| A | 0 | 18 | 0 |
| B | 0 | 18 | 0 |
| C | 0 | 18 | 0 |
| D | 0 | 18 | 0 |
| Mode M0 | |||
|---|---|---|---|
| Quadrant | BADHDUFLAG | Total packets | Discarded packets |
| A | 0 | 12457 | 2 |
| B | 0 | 11893 | 1 |
| C | 0 | 11816 | 1 |
| D | 0 | 16300 | 1 |
| Quadrant | Total seconds | Saturated seconds | Saturation percentage |
|---|---|---|---|
| A | 5599 | 17 | 0.303626% |
| B | 5599 | 53 | 0.946598% |
| C | 5599 | 10 | 0.178603% |
| D | 5599 | 210 | 3.750670% |
Noise dominated data is calculated using 1-second bins in cleaned event files. If a bin has >2000 counts, and if more than 50% of those come from <1% of pixels, then it is considered to be noise-dominated and hence unusable.
| Quadrant | # 1 sec bins | Bins with >0 counts | Bins with >2000 counts | High rate bins dominated by noise | Noise dominated (total time) | Noise dominated (detector-on time) | Marked lightcurve |
|---|---|---|---|---|---|---|---|
| A | 7332 | 5600 | 9 | 9 | 0.12% | 0.16% | 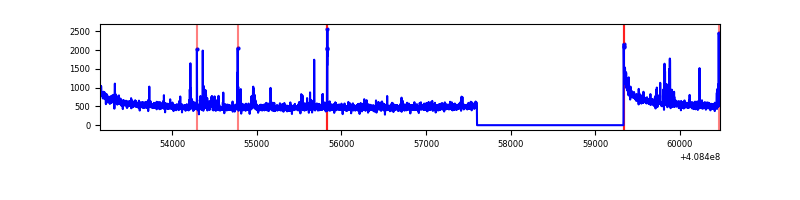 |
| B | 7332 | 5600 | 38 | 38 | 0.52% | 0.68% | 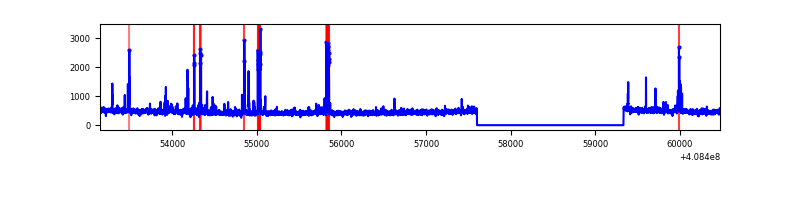 |
| C | 7332 | 5600 | 4 | 4 | 0.05% | 0.07% | 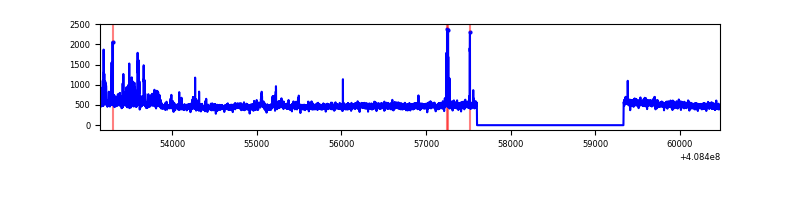 |
| D | 7332 | 5600 | 200 | 200 | 2.73% | 3.57% | 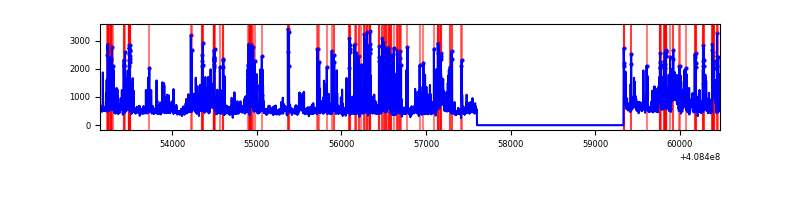 |
Top three noisy pixels from each quadrant. If the there are fewer than three noisy pixels in the level2.evt file, extra rows are filled as -1
| Pixel properties | Quadrant properties | ||||||
|---|---|---|---|---|---|---|---|
| Quadrant | DetID | PixID | Counts | Sigma | Mean | Median | Sigma |
| A | 10 | 83 | 418545 | 3274.29 | 629 | 616 | 127.6 |
| A | 13 | 248 | 81098 | 630.54 | 629 | 616 | 127.6 |
| A | 12 | 16 | 56616 | 438.74 | 629 | 616 | 127.6 |
| B | 5 | 172 | 212871 | 1780.72 | 620 | 604 | 119.2 |
| B | 0 | 230 | 23357 | 190.88 | 620 | 604 | 119.2 |
| B | 0 | 229 | 22965 | 187.59 | 620 | 604 | 119.2 |
| C | 15 | 214 | 246789 | 1732.75 | 612 | 614 | 142.1 |
| C | 14 | 254 | 179746 | 1260.85 | 612 | 614 | 142.1 |
| C | 1 | 128 | 5614 | 35.19 | 612 | 614 | 142.1 |
| D | 12 | 227 | 882329 | 5934.49 | 608 | 590 | 148.6 |
| D | 12 | 235 | 227579 | 1527.74 | 608 | 590 | 148.6 |
| D | 2 | 16 | 181394 | 1216.89 | 608 | 590 | 148.6 |
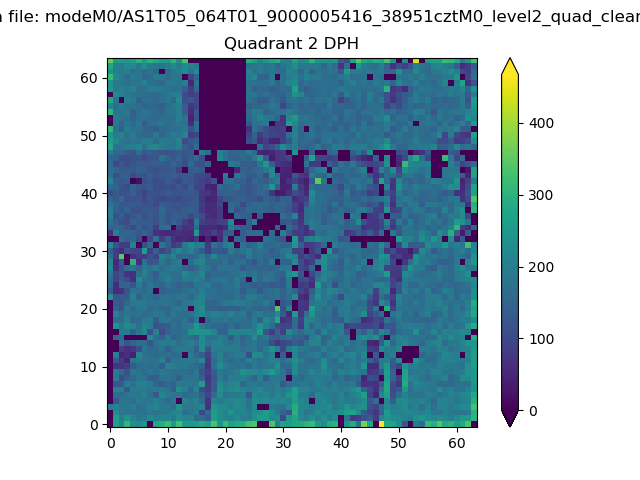
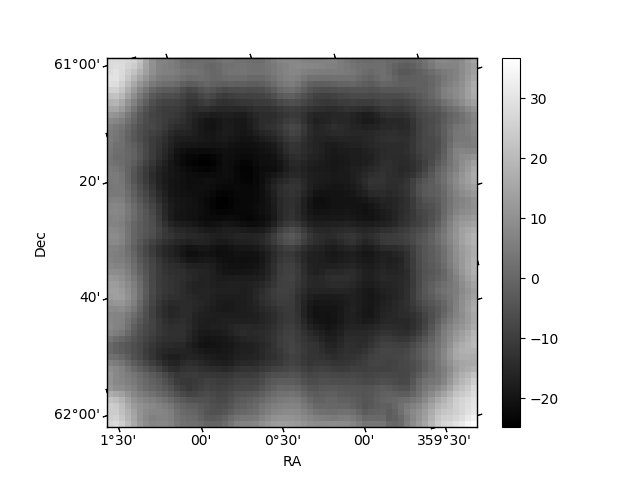
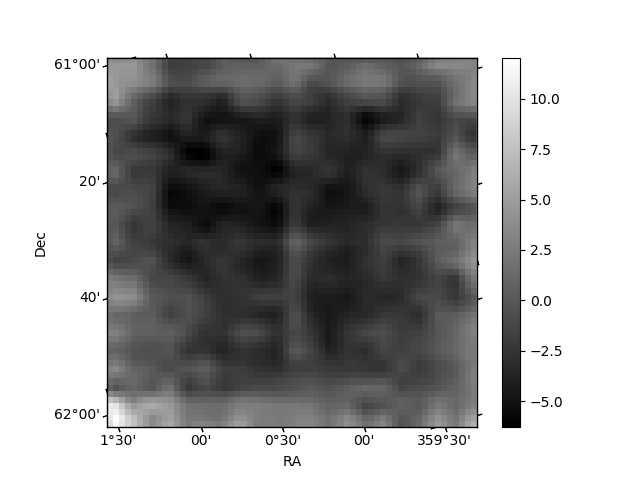
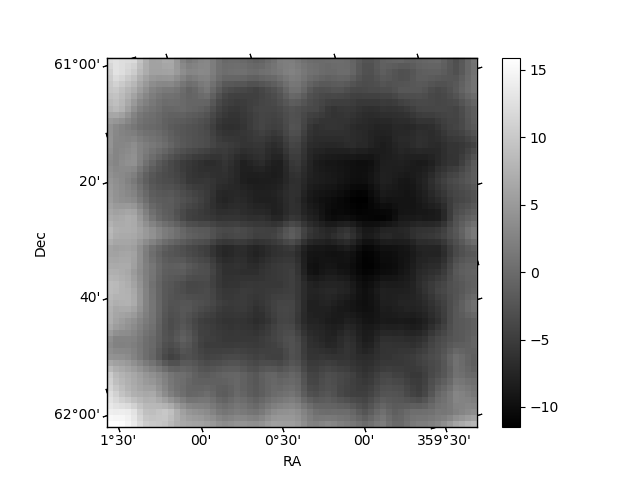
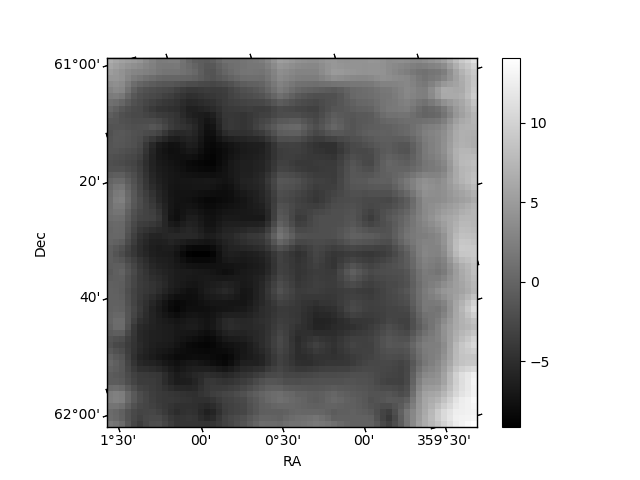
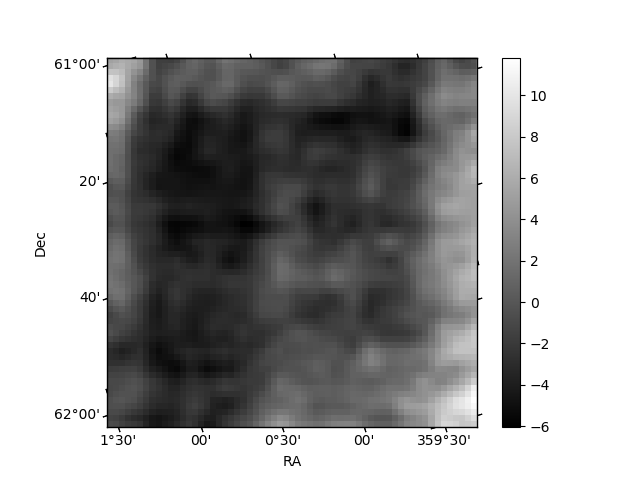
Histogram calculated using DETX and DETY for each event in the final _common_clean file
| Quadrant A | 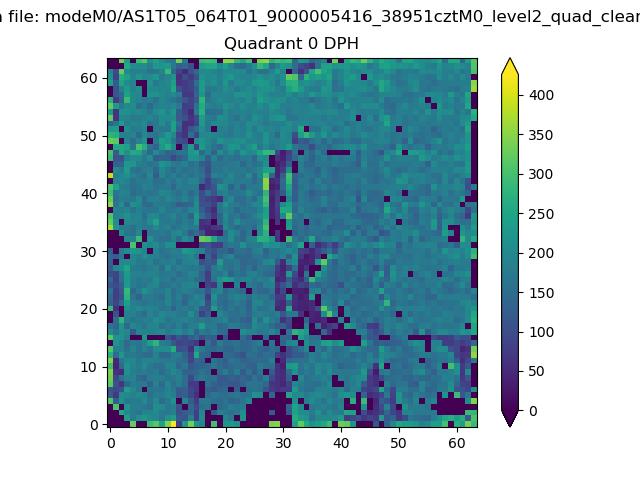 |
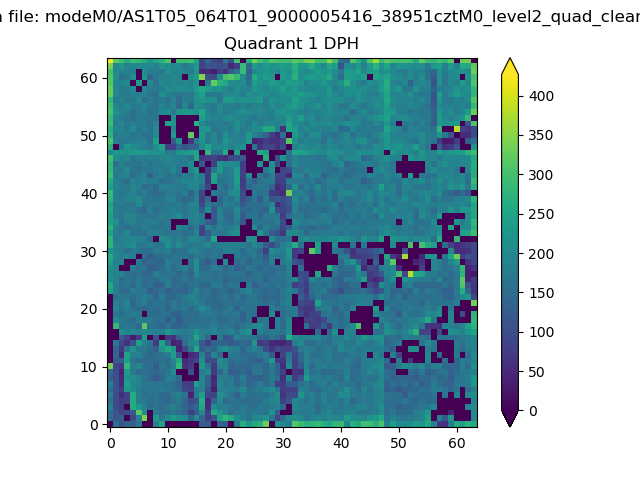 |
Quadrant B |
|---|---|---|---|
| Quadrant D | 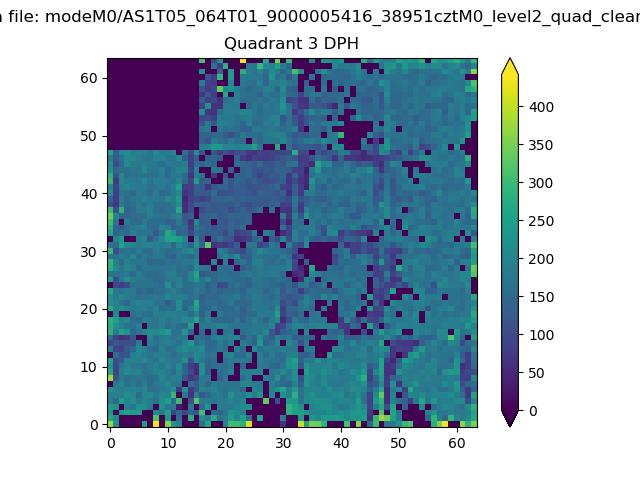 |
 |
Quadrant C |
| Plot type | Count rate plots | Images |
|---|---|---|
| Comparison with Poisson distribution Blue bars denote a histogram of data divided into 1 sec bins. Red curve is a Poisson curve with rate = median count rate of data. |
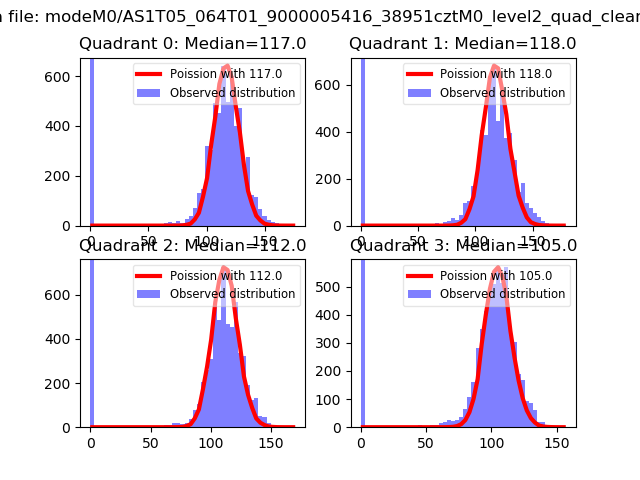 |
 |
| Quadrant-wise count rates Data is divided into 100 sec bins |
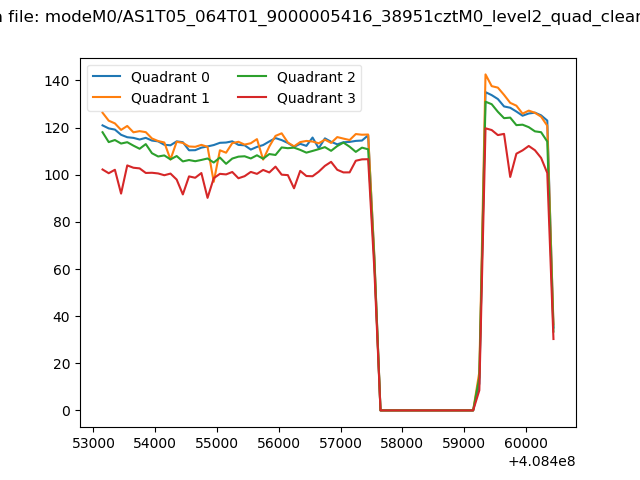 |
|
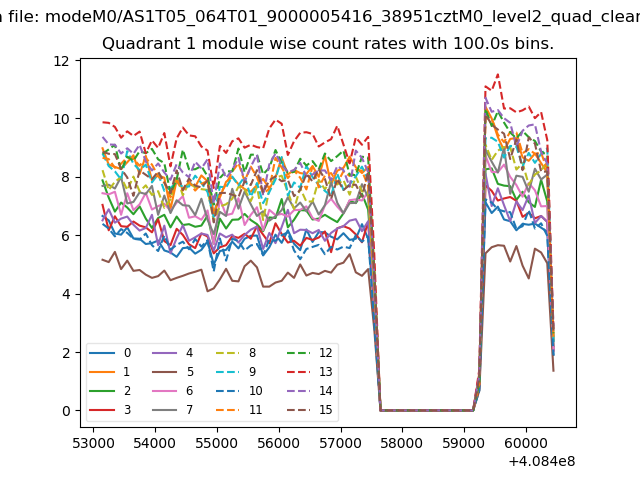
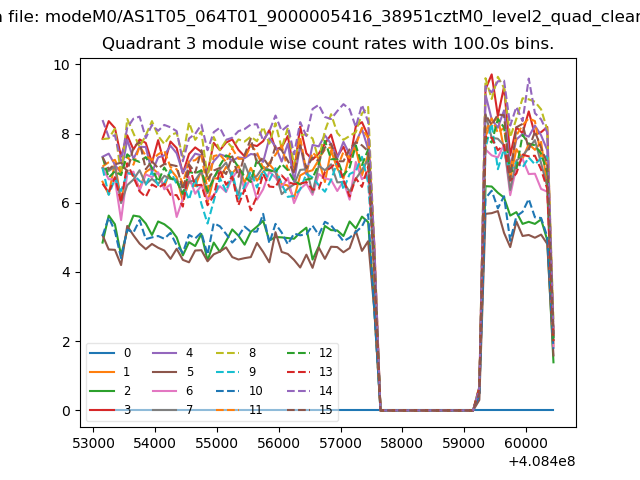
| Module-wise count rates for Quadrant A Data is divided into 100 sec bins |
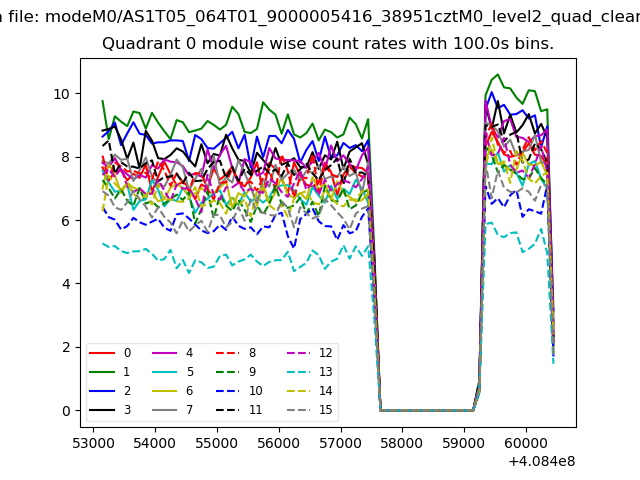 |
 |
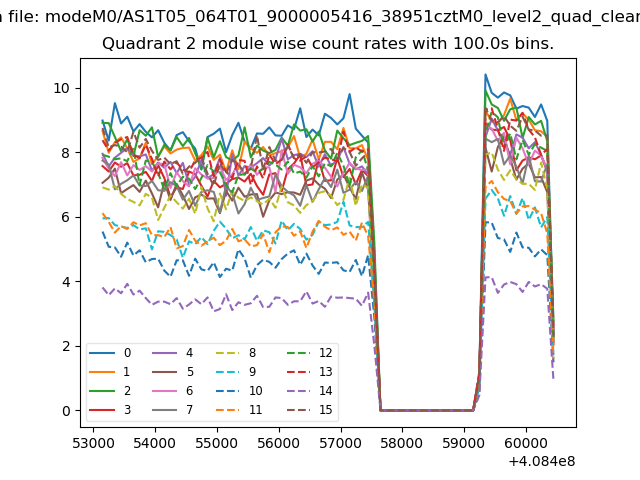
| Module-wise count rates for Quadrant B Data is divided into 100 sec bins |
 |
 |
| Module-wise count rates for Quadrant C Data is divided into 100 sec bins |
 |
 |
| Module-wise count rates for Quadrant D Data is divided into 100 sec bins |
 |
 |
| Parameter | Plot |
|---|---|
| CZT HV Monitor | 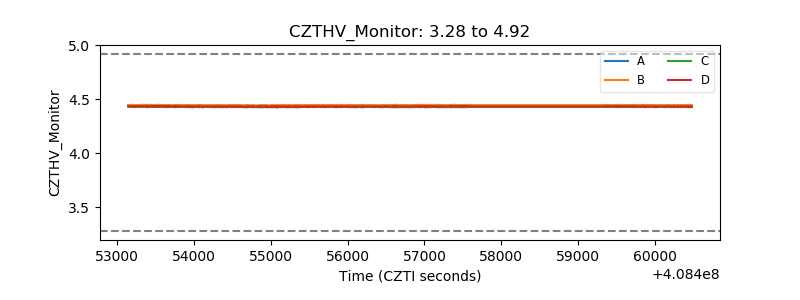 |
| D_VDD | 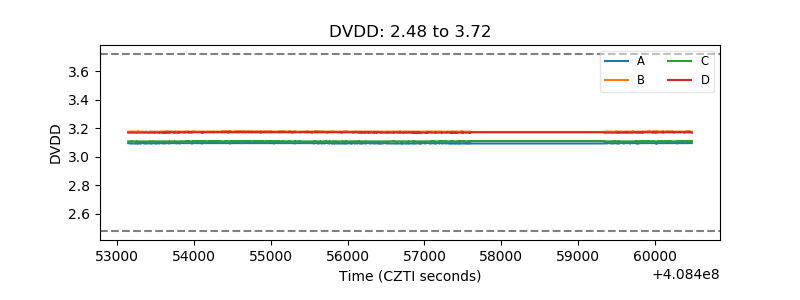 |
| Temperature 1 | 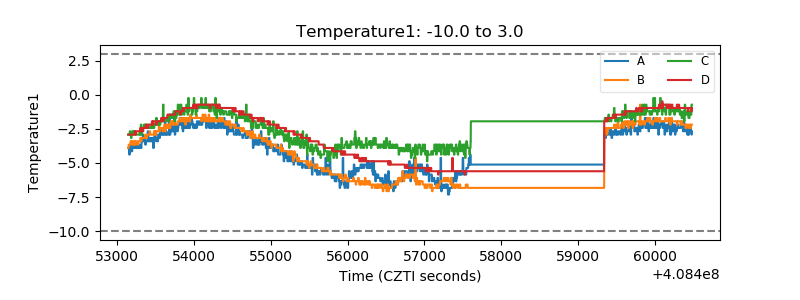 |
| Veto HV Monitor |  |
| Veto LLD | 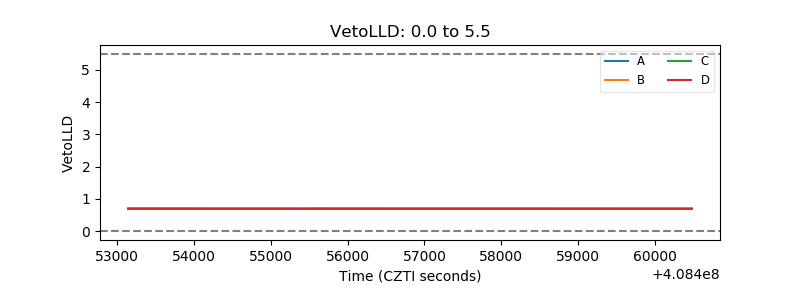 |
| Alpha Counter | 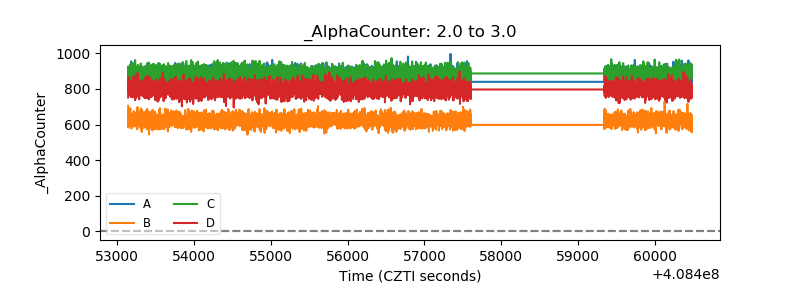 |
| _CPM_Rate | 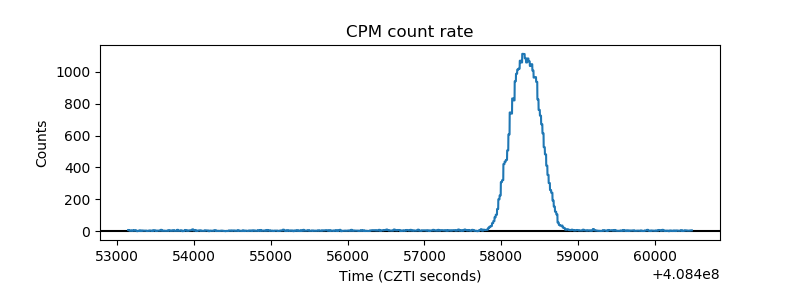 |
| CZT Counter | 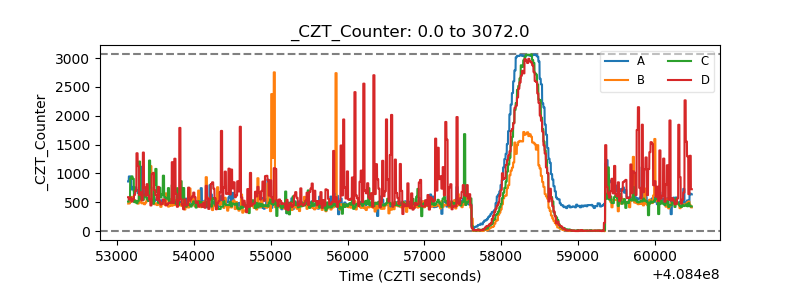 |
| +2.5 Volts monitor | 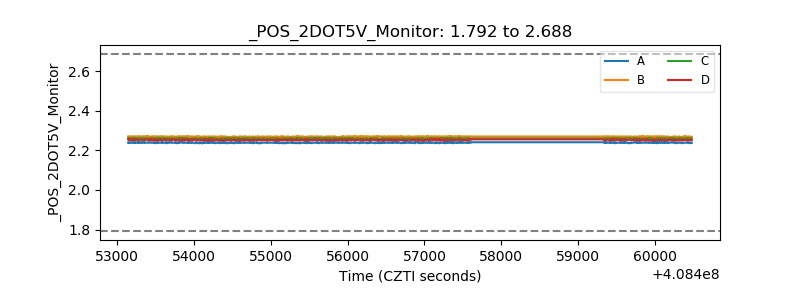 |
| +5 Volts monitor | 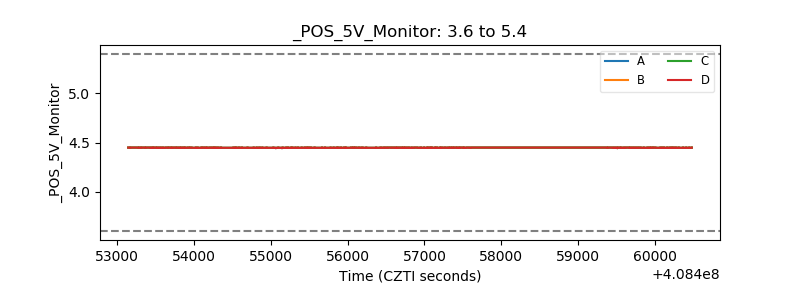 |
| _ROLL_ROT | 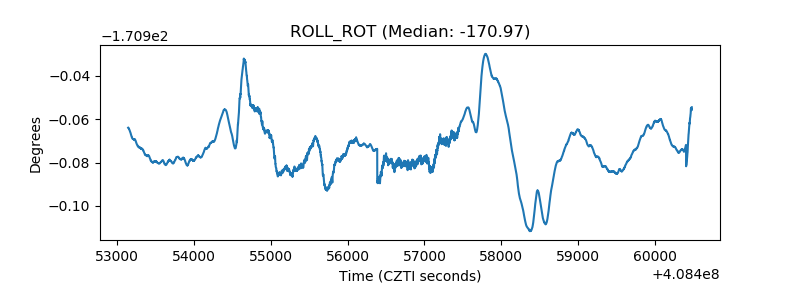 |
| _Roll_DEC | 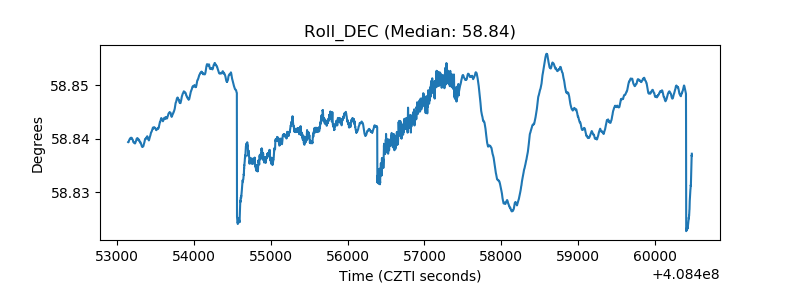 |
| _Roll_RA | 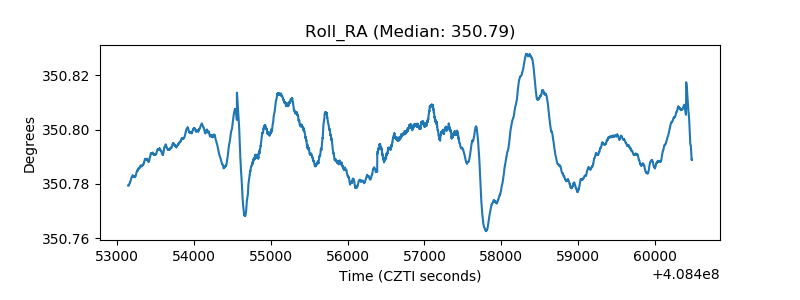 |
| Veto Counter | 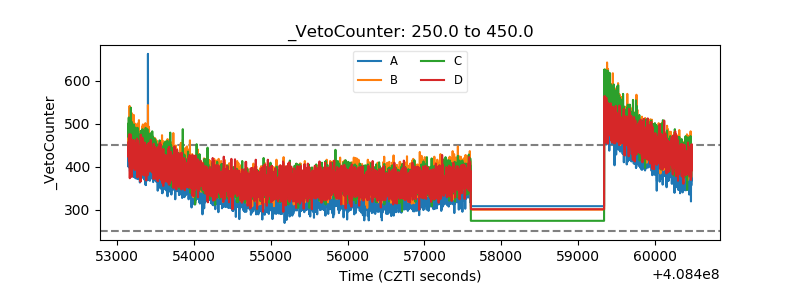 |