| Param | Original file | Final file |
|---|---|---|
| Filename | modeM0/AS1T05_064T01_9000005416_38952cztM0_level2.fits | modeM0/AS1T05_064T01_9000005416_38952cztM0_level2_quad_clean.evt |
| Size (bytes) | 340,104,960 | 91,169,280 |
| Size | 324.3 MB | 86.9 MB |
| Events in quadrant A | 2,746,743 | 625,579 |
| Events in quadrant B | 2,471,726 | 627,989 |
| Events in quadrant C | 2,924,949 | 597,403 |
| Events in quadrant D | 4,049,934 | 552,914 |
| Mode SS | |||
|---|---|---|---|
| Quadrant | BADHDUFLAG | Total packets | Discarded packets |
| A | 0 | 104 | 0 |
| B | 0 | 104 | 0 |
| C | 0 | 104 | 0 |
| D | 0 | 104 | 0 |
| Mode M9 | |||
|---|---|---|---|
| Quadrant | BADHDUFLAG | Total packets | Discarded packets |
| A | 0 | 18 | 0 |
| B | 0 | 18 | 0 |
| C | 0 | 18 | 0 |
| D | 0 | 18 | 0 |
| Mode M0 | |||
|---|---|---|---|
| Quadrant | BADHDUFLAG | Total packets | Discarded packets |
| A | 0 | 11334 | 2 |
| B | 0 | 10723 | 1 |
| C | 0 | 11854 | 1 |
| D | 0 | 15523 | 1 |
| Quadrant | Total seconds | Saturated seconds | Saturation percentage |
|---|---|---|---|
| A | 5090 | 27 | 0.530452% |
| B | 5090 | 43 | 0.844794% |
| C | 5090 | 76 | 1.493124% |
| D | 5090 | 168 | 3.300589% |
Noise dominated data is calculated using 1-second bins in cleaned event files. If a bin has >2000 counts, and if more than 50% of those come from <1% of pixels, then it is considered to be noise-dominated and hence unusable.
| Quadrant | # 1 sec bins | Bins with >0 counts | Bins with >2000 counts | High rate bins dominated by noise | Noise dominated (total time) | Noise dominated (detector-on time) | Marked lightcurve |
|---|---|---|---|---|---|---|---|
| A | 6943 | 5091 | 13 | 13 | 0.19% | 0.26% | 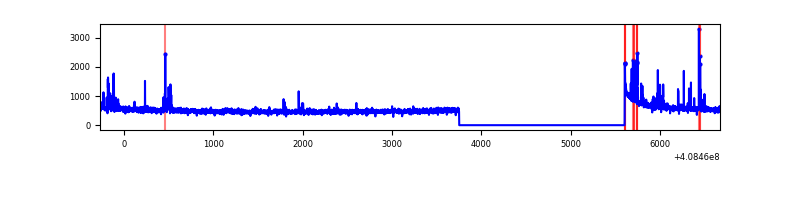 |
| B | 6943 | 5091 | 32 | 32 | 0.46% | 0.63% | 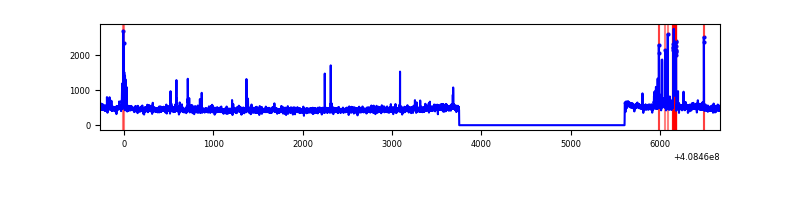 |
| C | 6943 | 5091 | 74 | 74 | 1.07% | 1.45% | 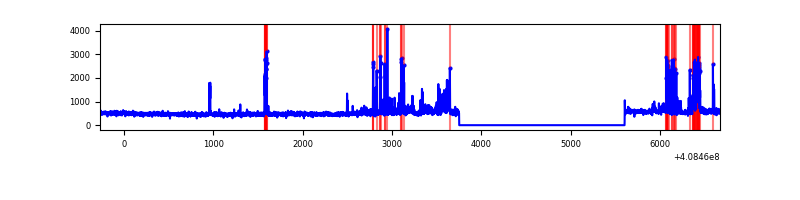 |
| D | 6943 | 5091 | 173 | 173 | 2.49% | 3.40% | 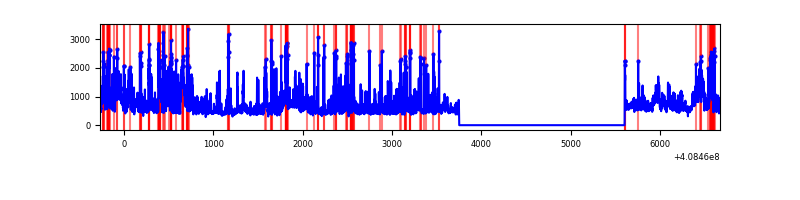 |
Top three noisy pixels from each quadrant. If the there are fewer than three noisy pixels in the level2.evt file, extra rows are filled as -1
| Pixel properties | Quadrant properties | ||||||
|---|---|---|---|---|---|---|---|
| Quadrant | DetID | PixID | Counts | Sigma | Mean | Median | Sigma |
| A | 10 | 83 | 359649 | 3103.8 | 580 | 571 | 115.7 |
| A | 13 | 248 | 82632 | 709.32 | 580 | 571 | 115.7 |
| A | 12 | 16 | 28877 | 244.67 | 580 | 571 | 115.7 |
| B | 5 | 172 | 139666 | 1278.52 | 573 | 557 | 108.8 |
| B | 0 | 230 | 36987 | 334.82 | 573 | 557 | 108.8 |
| B | 0 | 229 | 14780 | 130.72 | 573 | 557 | 108.8 |
| C | 14 | 254 | 481407 | 3688.92 | 566 | 569 | 130.3 |
| C | 15 | 214 | 219016 | 1675.89 | 566 | 569 | 130.3 |
| C | 3 | 233 | 5600 | 38.6 | 566 | 569 | 130.3 |
| D | 12 | 235 | 587780 | 4255.21 | 567 | 552 | 138.0 |
| D | 12 | 227 | 490766 | 3552.22 | 567 | 552 | 138.0 |
| D | 2 | 250 | 334835 | 2422.3 | 567 | 552 | 138.0 |
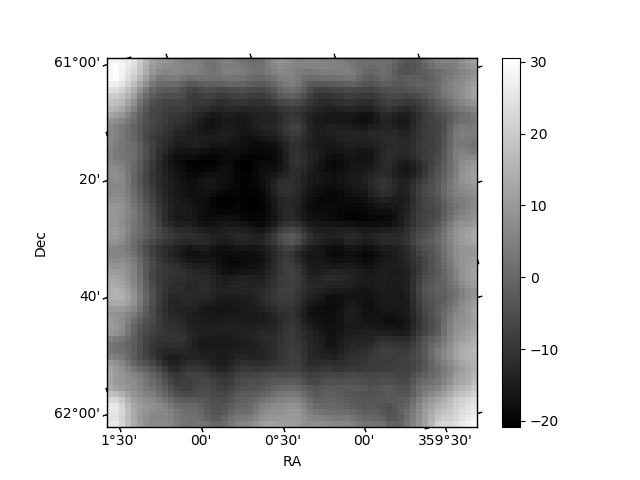
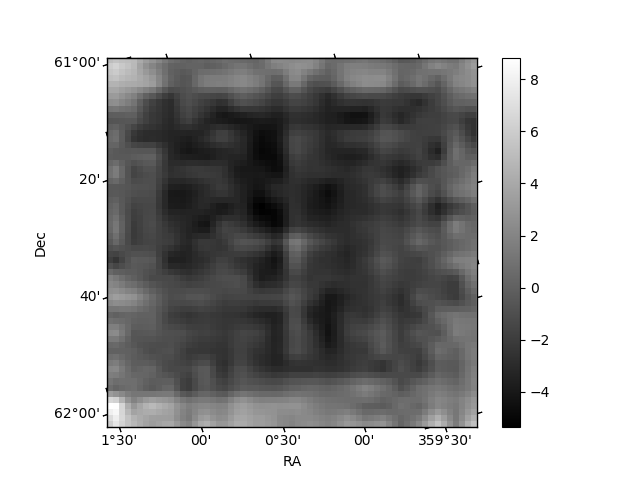
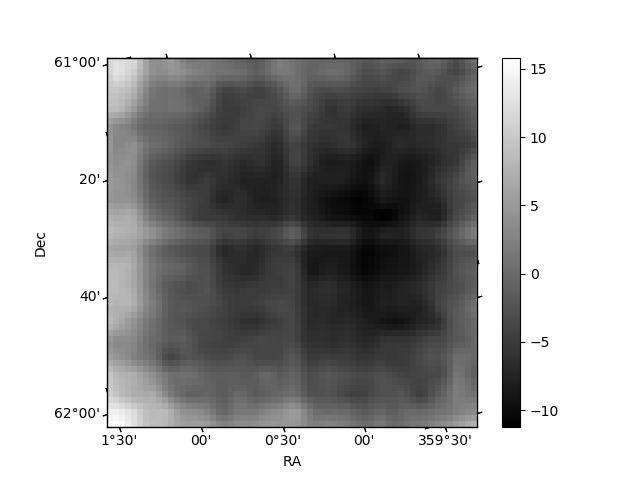
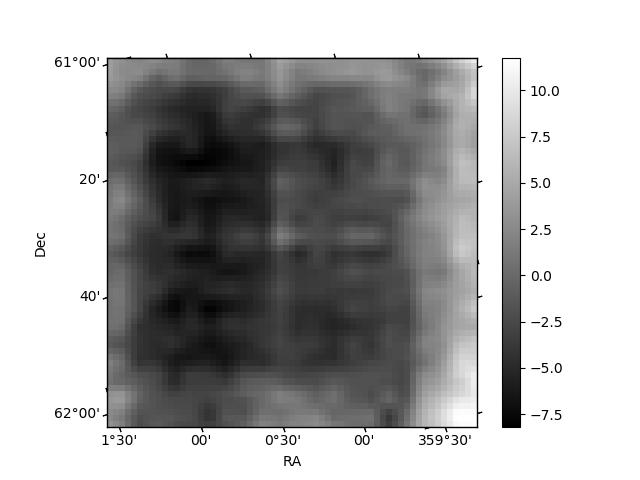
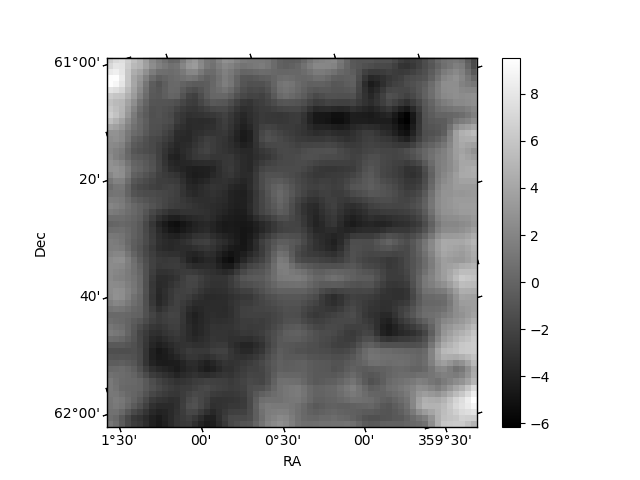
Histogram calculated using DETX and DETY for each event in the final _common_clean file
| Quadrant A | 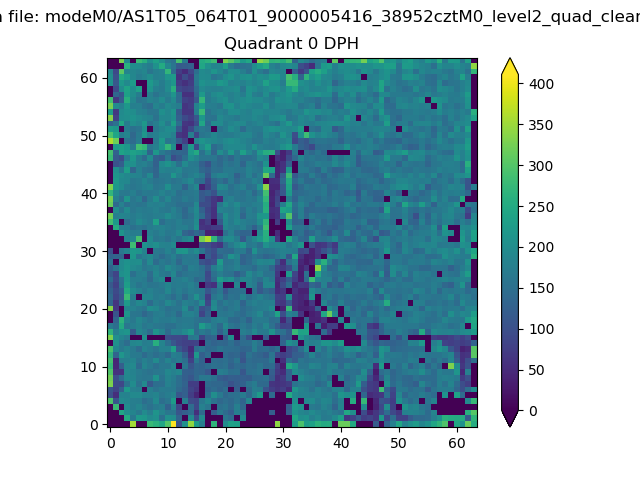 |
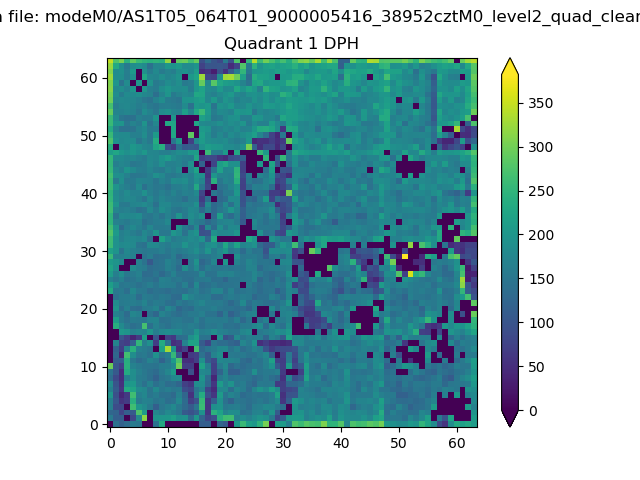 |
Quadrant B |
|---|---|---|---|
| Quadrant D | 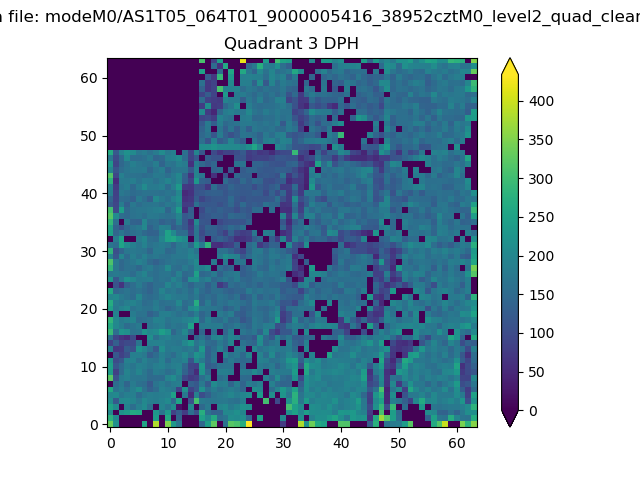 |
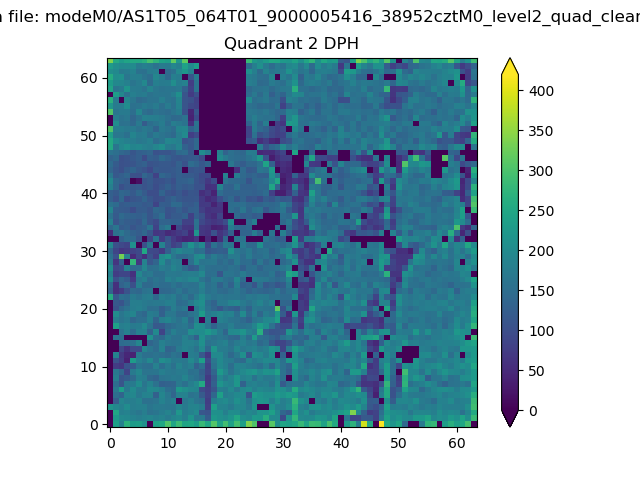 |
Quadrant C |
| Plot type | Count rate plots | Images |
|---|---|---|
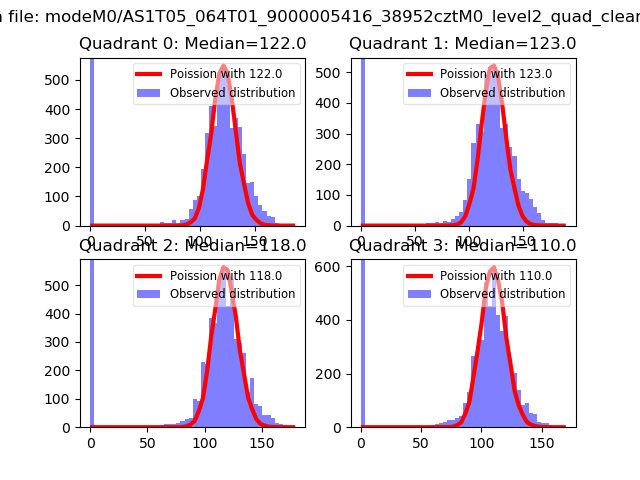
| Comparison with Poisson distribution Blue bars denote a histogram of data divided into 1 sec bins. Red curve is a Poisson curve with rate = median count rate of data. |
 |
 |
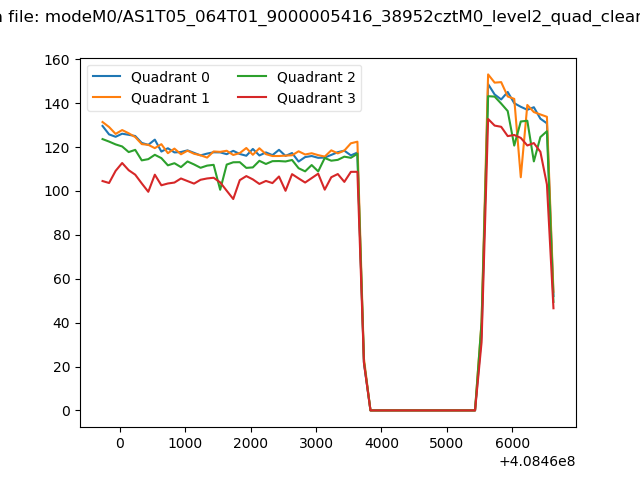
| Quadrant-wise count rates Data is divided into 100 sec bins |
 |
|
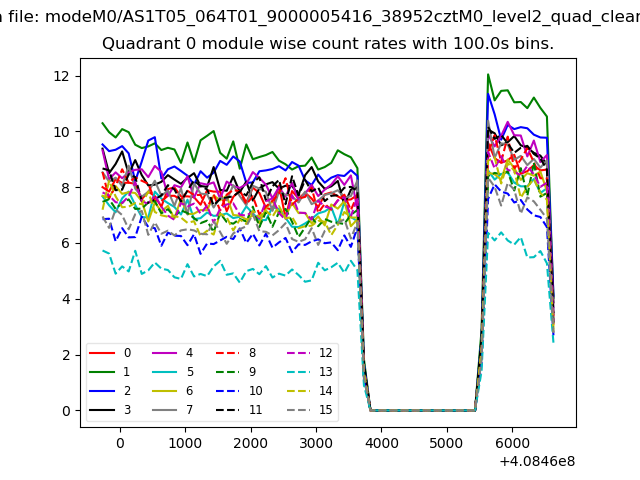
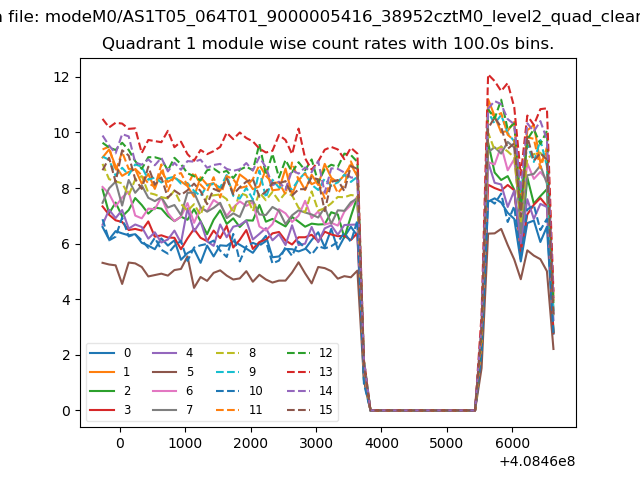
| Module-wise count rates for Quadrant A Data is divided into 100 sec bins |
 |
 |
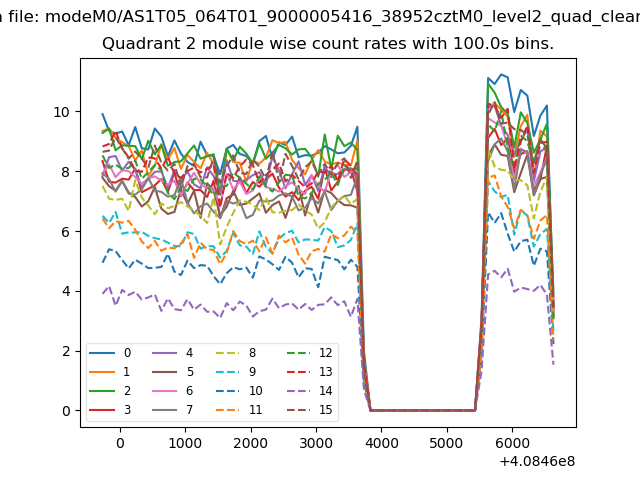
| Module-wise count rates for Quadrant B Data is divided into 100 sec bins |
 |
 |
| Module-wise count rates for Quadrant C Data is divided into 100 sec bins |
 |
 |
| Module-wise count rates for Quadrant D Data is divided into 100 sec bins |
 |
 |
| Parameter | Plot |
|---|---|
| CZT HV Monitor | 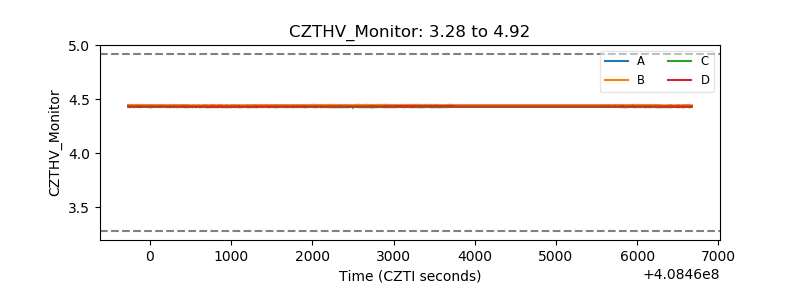 |
| D_VDD | 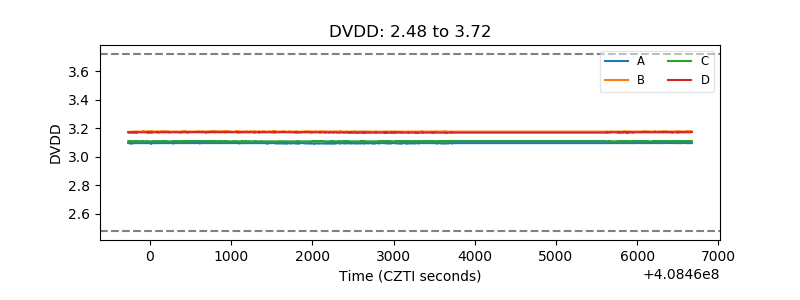 |
| Temperature 1 | 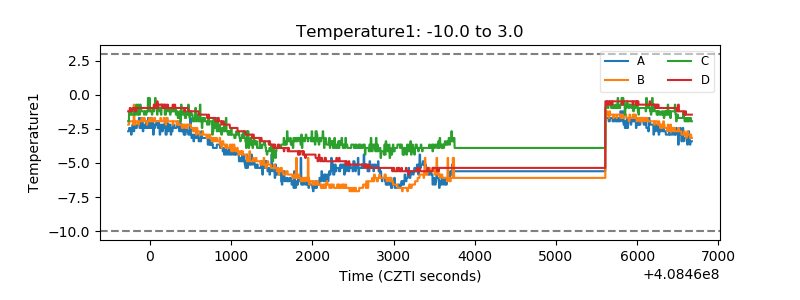 |
| Veto HV Monitor | 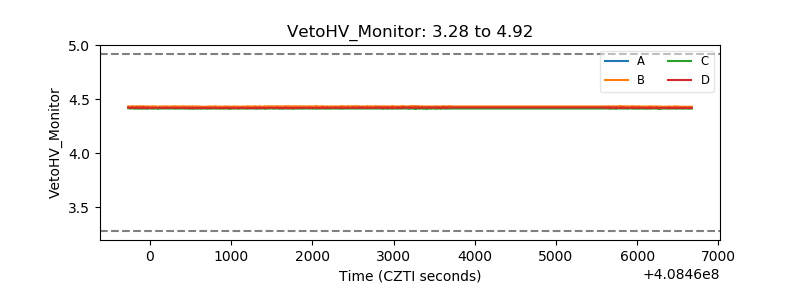 |
| Veto LLD | 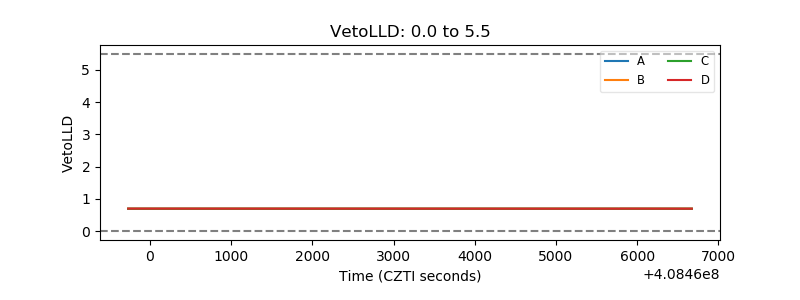 |
| Alpha Counter | 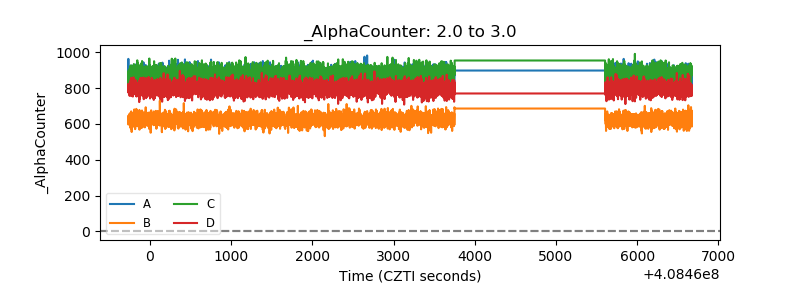 |
| _CPM_Rate | 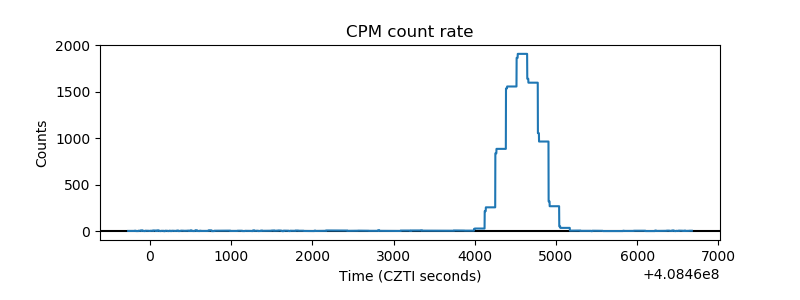 |
| CZT Counter | 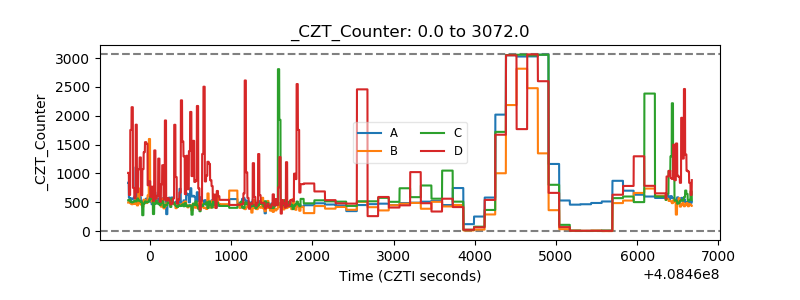 |
| +2.5 Volts monitor | 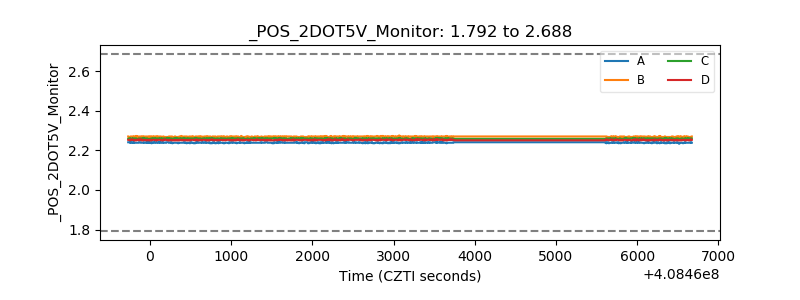 |
| +5 Volts monitor | 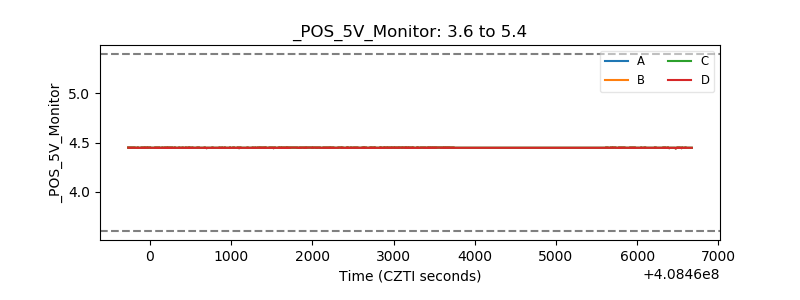 |
| _ROLL_ROT | 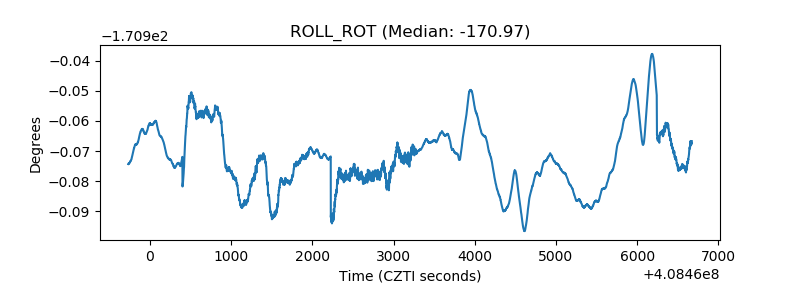 |
| _Roll_DEC | 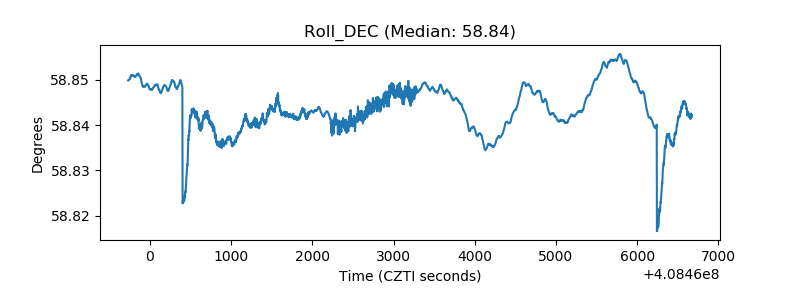 |
| _Roll_RA | 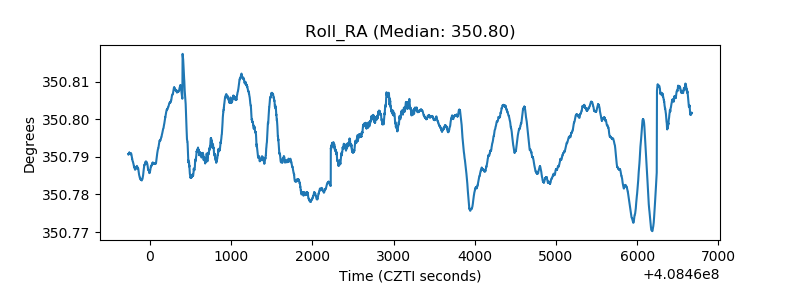 |
| Veto Counter | 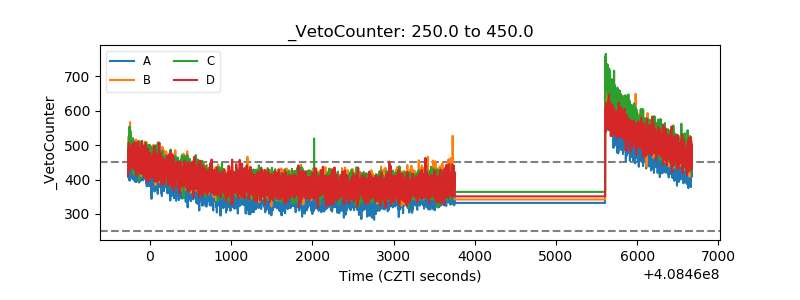 |