| Param | Original file | Final file |
|---|---|---|
| Filename | modeM0/AS1T05_064T01_9000005416_38953cztM0_level2.fits | modeM0/AS1T05_064T01_9000005416_38953cztM0_level2_quad_clean.evt |
| Size (bytes) | 355,708,800 | 97,899,840 |
| Size | 339.2 MB | 93.4 MB |
| Events in quadrant A | 2,948,550 | 674,072 |
| Events in quadrant B | 2,700,272 | 677,177 |
| Events in quadrant C | 3,059,841 | 650,741 |
| Events in quadrant D | 4,054,170 | 598,704 |
| Mode SS | |||
|---|---|---|---|
| Quadrant | BADHDUFLAG | Total packets | Discarded packets |
| A | 0 | 106 | 0 |
| B | 0 | 106 | 0 |
| C | 0 | 106 | 0 |
| D | 0 | 106 | 0 |
| Mode M9 | |||
|---|---|---|---|
| Quadrant | BADHDUFLAG | Total packets | Discarded packets |
| A | 0 | 20 | 0 |
| B | 0 | 20 | 0 |
| C | 0 | 20 | 0 |
| D | 0 | 20 | 0 |
| Mode M0 | |||
|---|---|---|---|
| Quadrant | BADHDUFLAG | Total packets | Discarded packets |
| A | 0 | 11982 | 3 |
| B | 0 | 11280 | 2 |
| C | 0 | 12229 | 2 |
| D | 0 | 15644 | 2 |
| Quadrant | Total seconds | Saturated seconds | Saturation percentage |
|---|---|---|---|
| A | 5196 | 33 | 0.635104% |
| B | 5196 | 62 | 1.193226% |
| C | 5196 | 65 | 1.250962% |
| D | 5197 | 178 | 3.425053% |
Noise dominated data is calculated using 1-second bins in cleaned event files. If a bin has >2000 counts, and if more than 50% of those come from <1% of pixels, then it is considered to be noise-dominated and hence unusable.
| Quadrant | # 1 sec bins | Bins with >0 counts | Bins with >2000 counts | High rate bins dominated by noise | Noise dominated (total time) | Noise dominated (detector-on time) | Marked lightcurve |
|---|---|---|---|---|---|---|---|
| A | 7169 | 5197 | 23 | 23 | 0.32% | 0.44% | 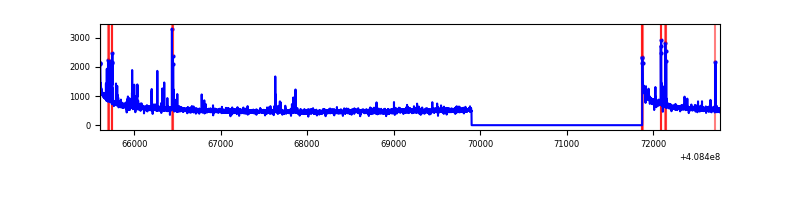 |
| B | 7169 | 5197 | 47 | 47 | 0.66% | 0.90% | 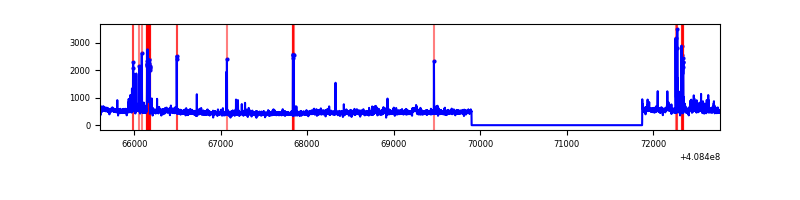 |
| C | 7169 | 5197 | 65 | 65 | 0.91% | 1.25% | 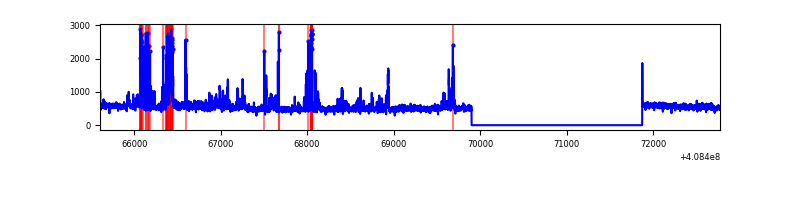 |
| D | 7170 | 5198 | 192 | 192 | 2.68% | 3.69% | 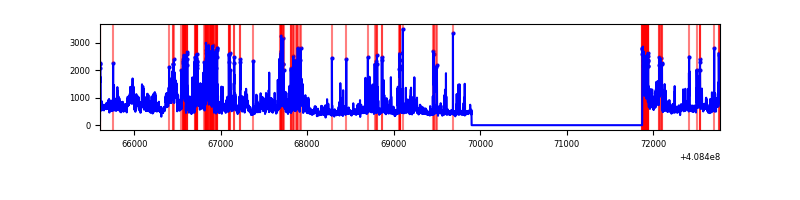 |
Top three noisy pixels from each quadrant. If the there are fewer than three noisy pixels in the level2.evt file, extra rows are filled as -1
| Pixel properties | Quadrant properties | ||||||
|---|---|---|---|---|---|---|---|
| Quadrant | DetID | PixID | Counts | Sigma | Mean | Median | Sigma |
| A | 10 | 83 | 441748 | 3594.22 | 614 | 602 | 122.7 |
| A | 13 | 248 | 110253 | 893.38 | 614 | 602 | 122.7 |
| A | 9 | 143 | 14570 | 113.8 | 614 | 602 | 122.7 |
| B | 5 | 172 | 125063 | 1095.13 | 607 | 592 | 113.7 |
| B | 0 | 230 | 69875 | 609.57 | 607 | 592 | 113.7 |
| B | 15 | 85 | 57088 | 497.07 | 607 | 592 | 113.7 |
| C | 14 | 254 | 461543 | 3359.21 | 601 | 606 | 137.2 |
| C | 15 | 214 | 230870 | 1678.11 | 601 | 606 | 137.2 |
| C | 4 | 0 | 7276 | 48.61 | 601 | 606 | 137.2 |
| D | 12 | 235 | 689616 | 4771.73 | 599 | 584 | 144.4 |
| D | 2 | 250 | 388564 | 2686.86 | 599 | 584 | 144.4 |
| D | 12 | 6 | 159932 | 1103.53 | 599 | 584 | 144.4 |
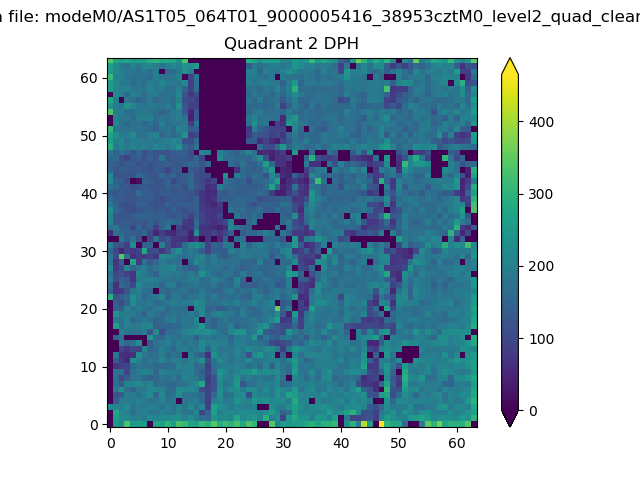
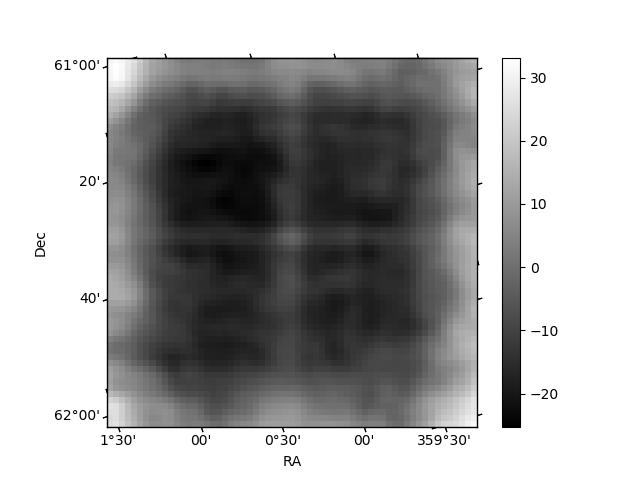
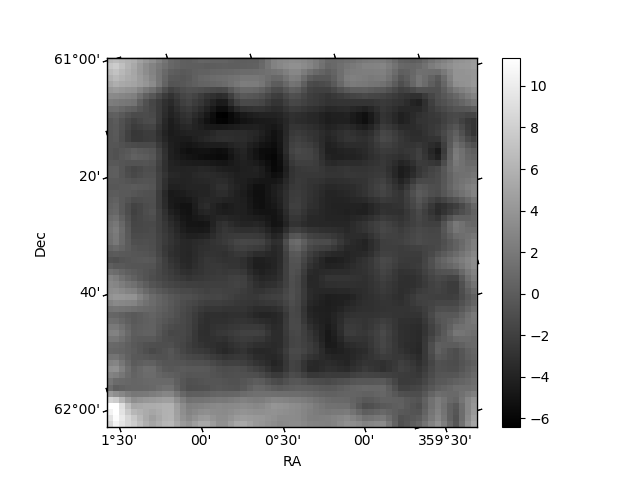
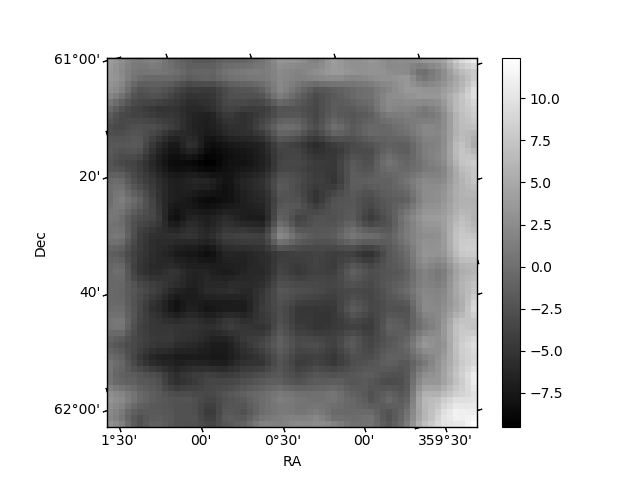
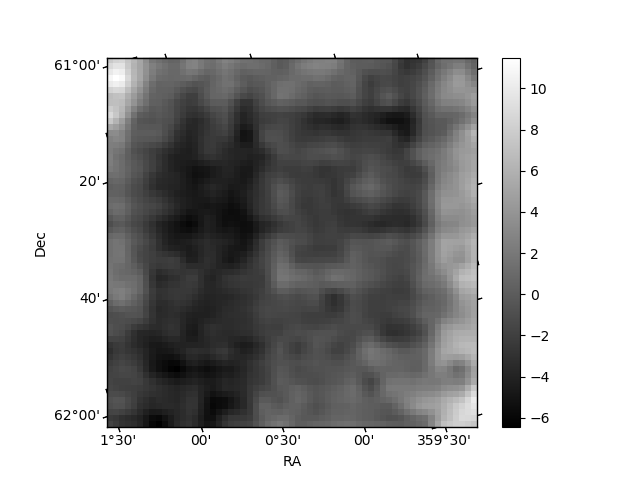
Histogram calculated using DETX and DETY for each event in the final _common_clean file
| Quadrant A | 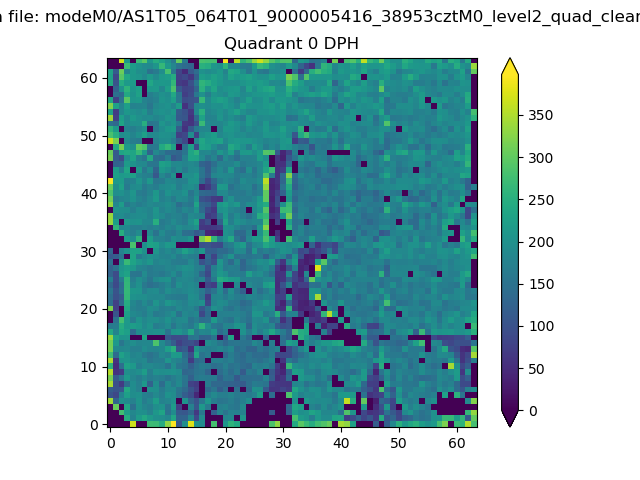 |
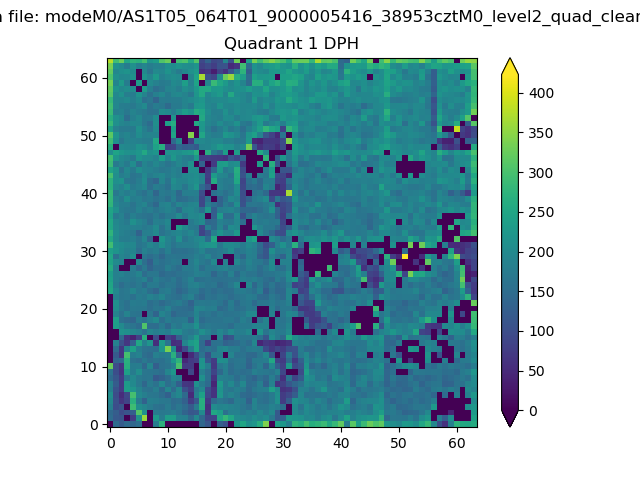 |
Quadrant B |
|---|---|---|---|
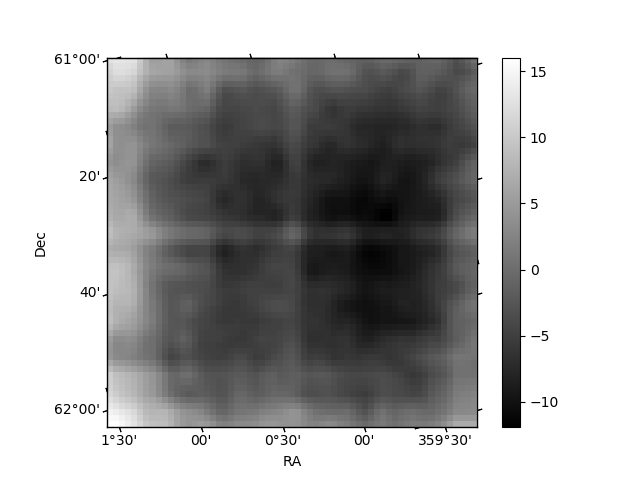
| Quadrant D | 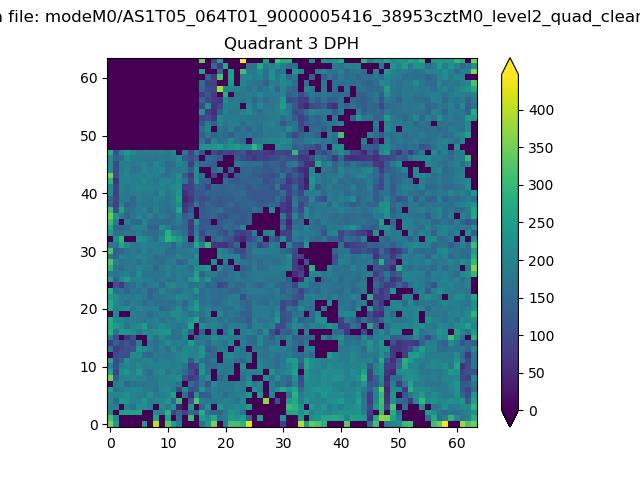 |
 |
Quadrant C |
| Plot type | Count rate plots | Images |
|---|---|---|
| Comparison with Poisson distribution Blue bars denote a histogram of data divided into 1 sec bins. Red curve is a Poisson curve with rate = median count rate of data. |
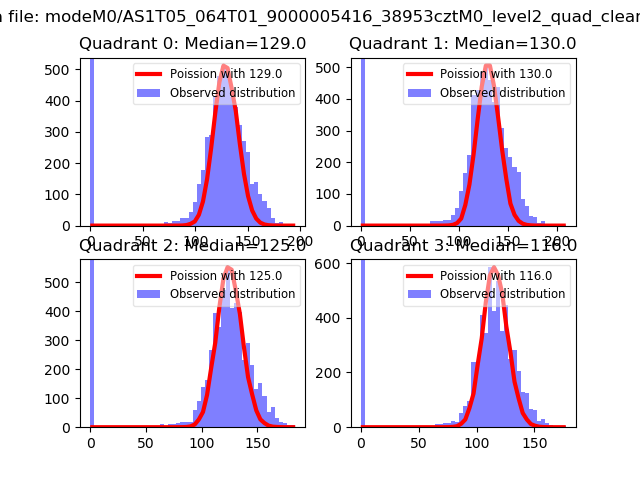 |
 |
| Quadrant-wise count rates Data is divided into 100 sec bins |
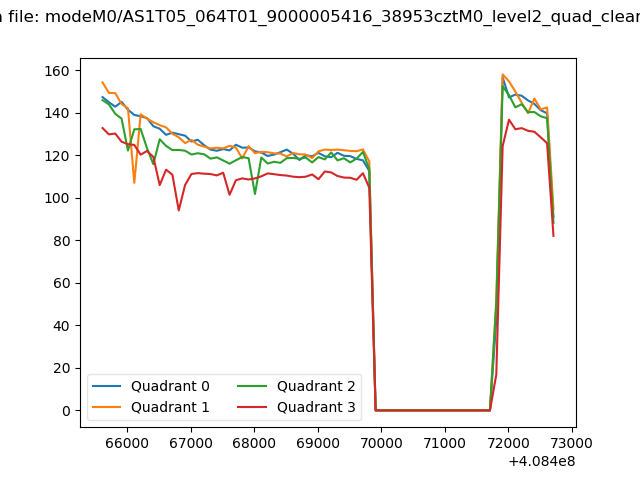 |
|
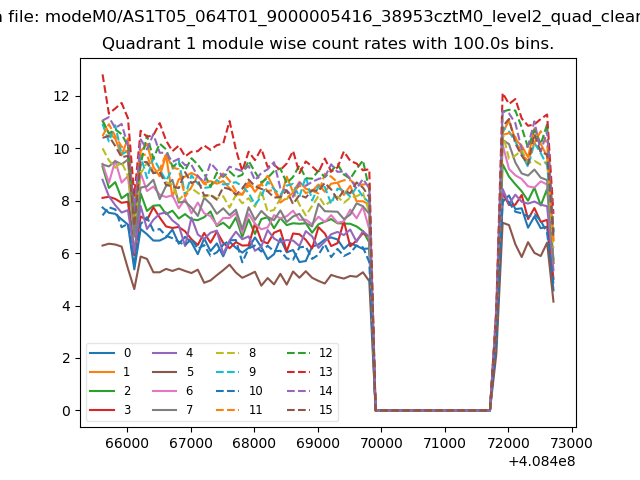
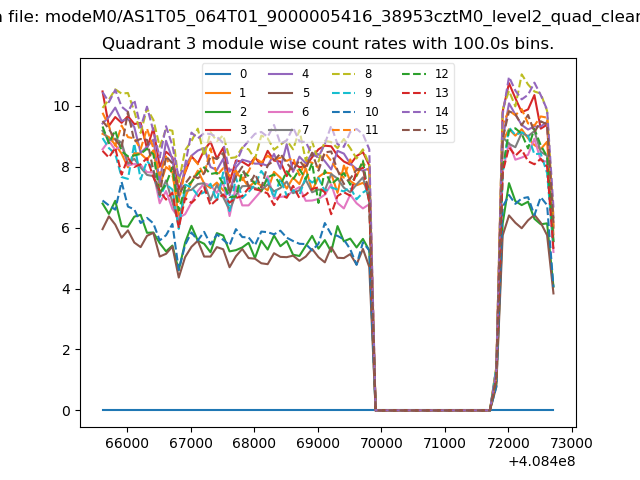
| Module-wise count rates for Quadrant A Data is divided into 100 sec bins |
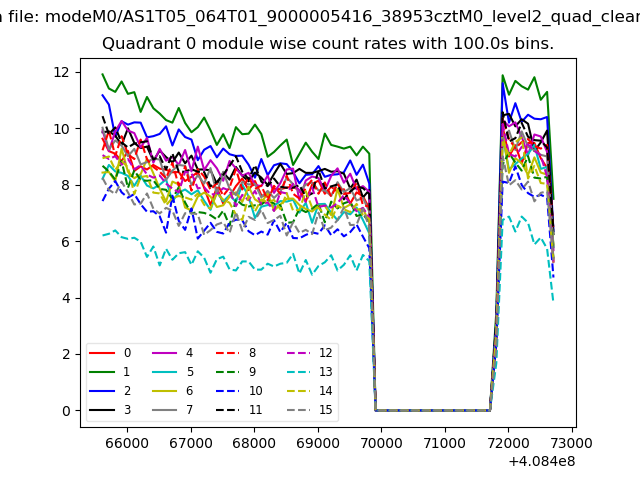 |
 |
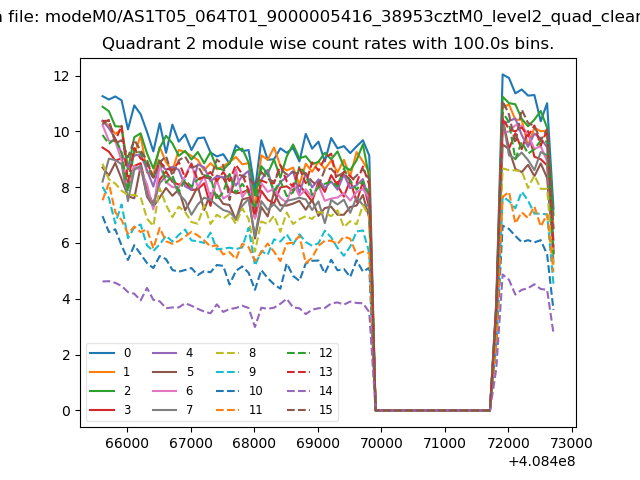
| Module-wise count rates for Quadrant B Data is divided into 100 sec bins |
 |
 |
| Module-wise count rates for Quadrant C Data is divided into 100 sec bins |
 |
 |
| Module-wise count rates for Quadrant D Data is divided into 100 sec bins |
 |
 |
| Parameter | Plot |
|---|---|
| CZT HV Monitor | 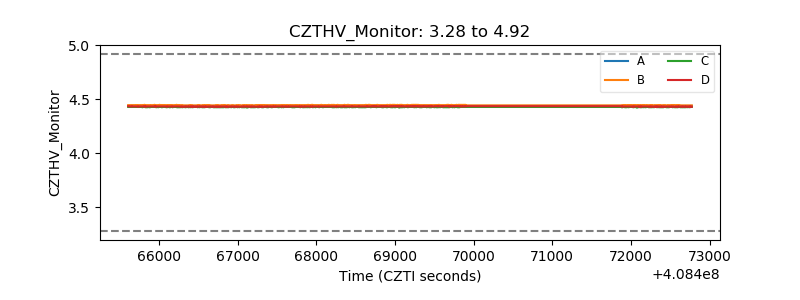 |
| D_VDD | 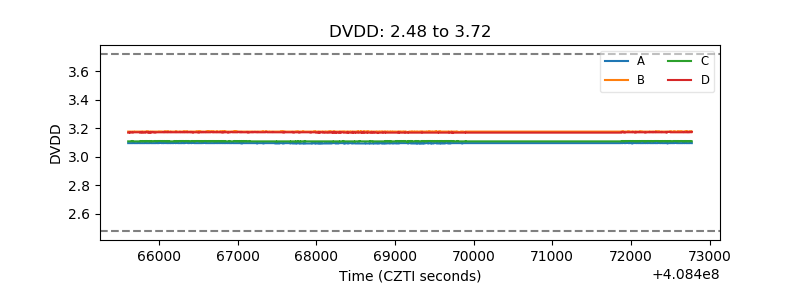 |
| Temperature 1 | 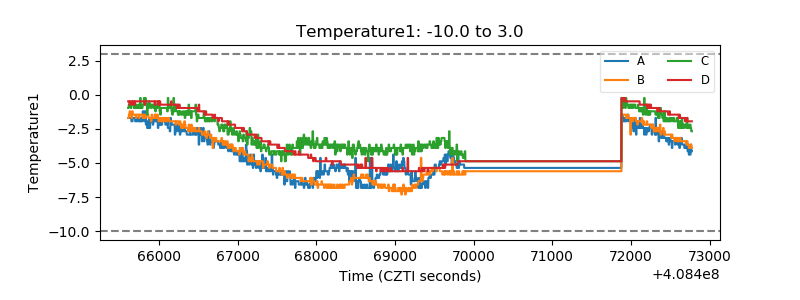 |
| Veto HV Monitor | 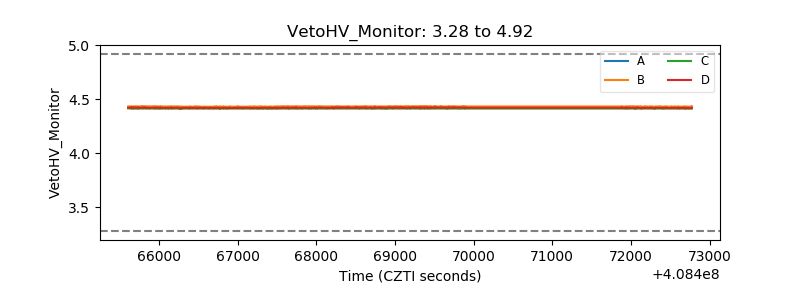 |
| Veto LLD | 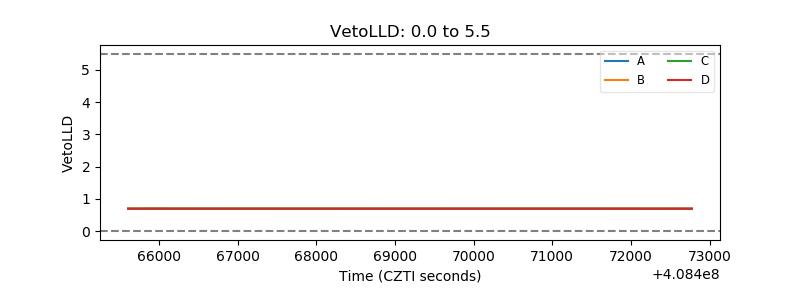 |
| Alpha Counter | 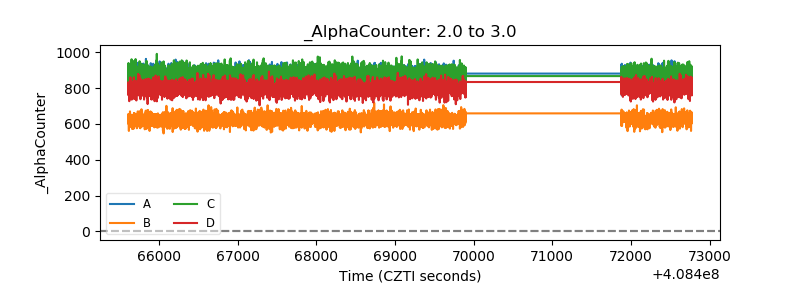 |
| _CPM_Rate | 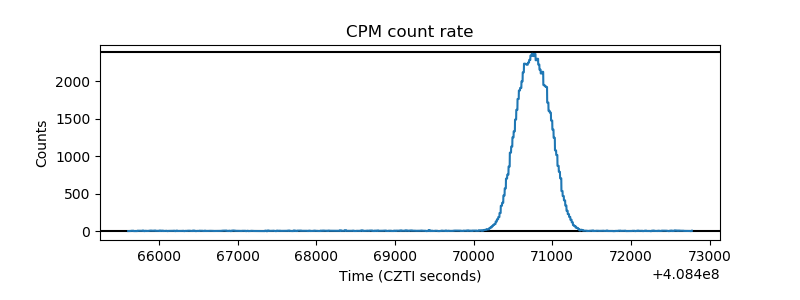 |
| CZT Counter | 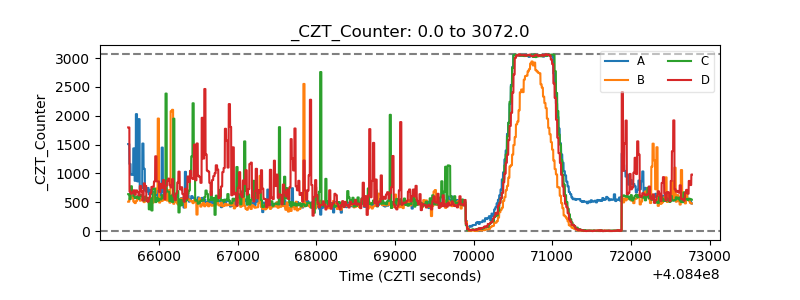 |
| +2.5 Volts monitor | 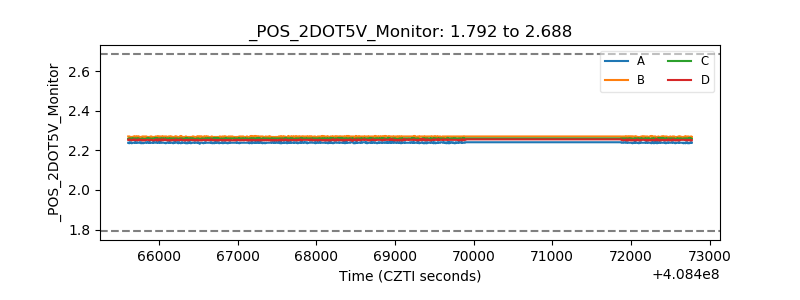 |
| +5 Volts monitor | 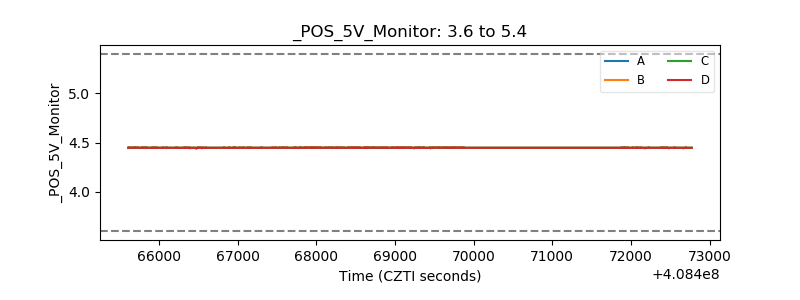 |
| _ROLL_ROT | 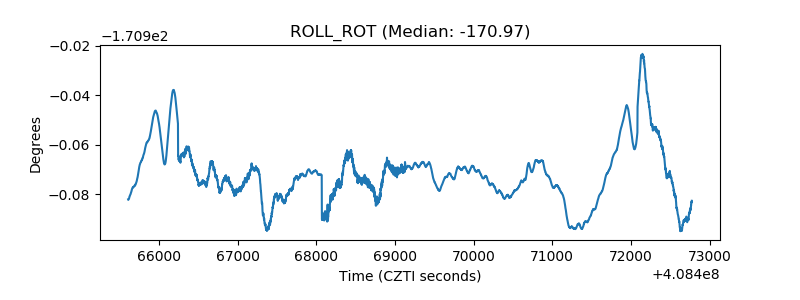 |
| _Roll_DEC | 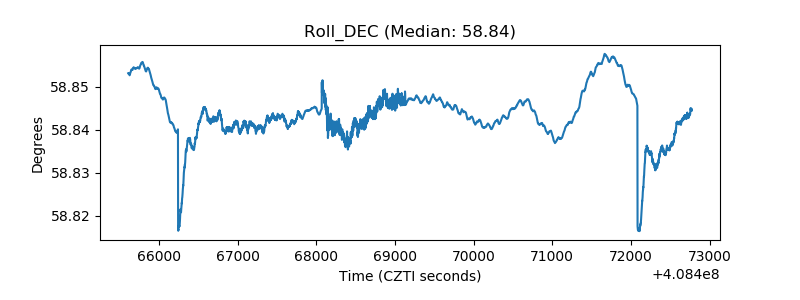 |
| _Roll_RA | 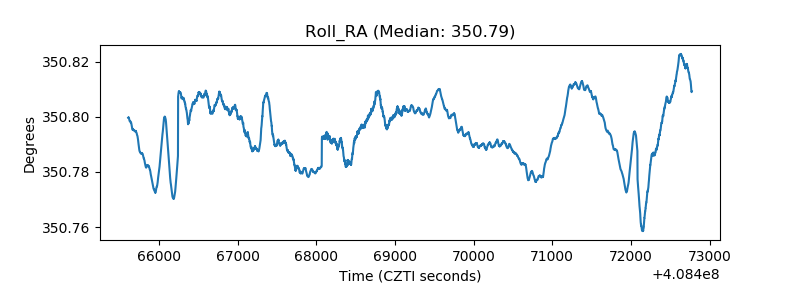 |
| Veto Counter | 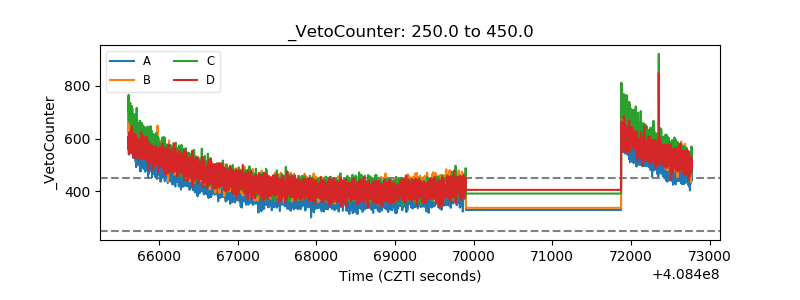 |