| Param | Original file | Final file |
|---|---|---|
| Filename | modeM0/AS1T05_064T01_9000005416_38954cztM0_level2.fits | modeM0/AS1T05_064T01_9000005416_38954cztM0_level2_quad_clean.evt |
| Size (bytes) | 321,891,840 | 94,429,440 |
| Size | 307.0 MB | 90.1 MB |
| Events in quadrant A | 2,874,757 | 642,955 |
| Events in quadrant B | 2,541,156 | 656,205 |
| Events in quadrant C | 2,651,321 | 633,107 |
| Events in quadrant D | 3,463,942 | 581,370 |
| Mode SS | |||
|---|---|---|---|
| Quadrant | BADHDUFLAG | Total packets | Discarded packets |
| A | 0 | 100 | 0 |
| B | 0 | 100 | 0 |
| C | 0 | 100 | 0 |
| D | 0 | 100 | 0 |
| Mode M9 | |||
|---|---|---|---|
| Quadrant | BADHDUFLAG | Total packets | Discarded packets |
| A | 0 | 25 | 0 |
| B | 0 | 25 | 0 |
| C | 0 | 25 | 0 |
| D | 0 | 26 | 0 |
| Mode M0 | |||
|---|---|---|---|
| Quadrant | BADHDUFLAG | Total packets | Discarded packets |
| A | 0 | 11559 | 3 |
| B | 0 | 10610 | 2 |
| C | 0 | 10703 | 2 |
| D | 0 | 13691 | 2 |
| Quadrant | Total seconds | Saturated seconds | Saturation percentage |
|---|---|---|---|
| A | 4933 | 49 | 0.993310% |
| B | 4933 | 26 | 0.527063% |
| C | 4933 | 36 | 0.729779% |
| D | 4933 | 104 | 2.108251% |
Noise dominated data is calculated using 1-second bins in cleaned event files. If a bin has >2000 counts, and if more than 50% of those come from <1% of pixels, then it is considered to be noise-dominated and hence unusable.
| Quadrant | # 1 sec bins | Bins with >0 counts | Bins with >2000 counts | High rate bins dominated by noise | Noise dominated (total time) | Noise dominated (detector-on time) | Marked lightcurve |
|---|---|---|---|---|---|---|---|
| A | 7026 | 4934 | 45 | 45 | 0.64% | 0.91% | 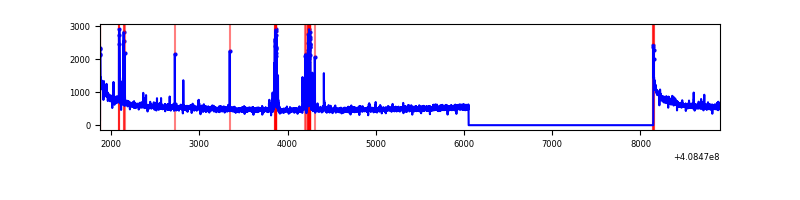 |
| B | 7026 | 4934 | 13 | 13 | 0.19% | 0.26% | 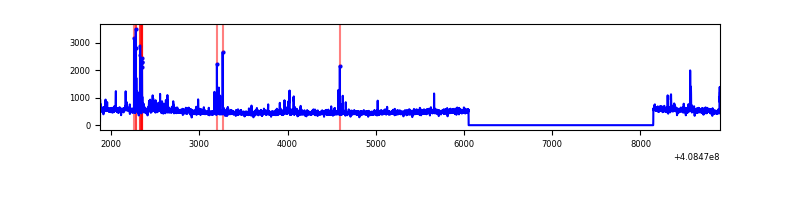 |
| C | 7026 | 4934 | 38 | 38 | 0.54% | 0.77% | 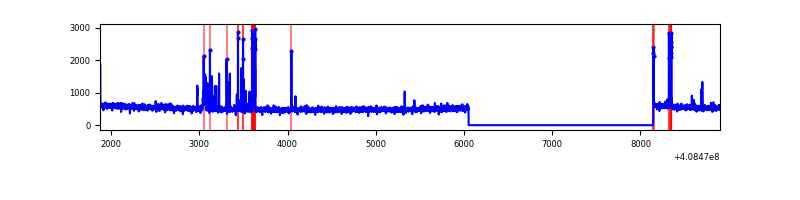 |
| D | 7026 | 4934 | 96 | 96 | 1.37% | 1.95% | 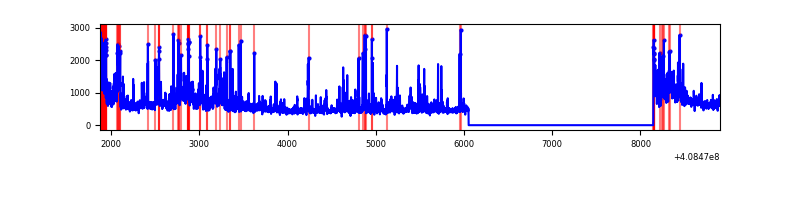 |
Top three noisy pixels from each quadrant. If the there are fewer than three noisy pixels in the level2.evt file, extra rows are filled as -1
| Pixel properties | Quadrant properties | ||||||
|---|---|---|---|---|---|---|---|
| Quadrant | DetID | PixID | Counts | Sigma | Mean | Median | Sigma |
| A | 10 | 83 | 423387 | 3631.69 | 581 | 571 | 116.4 |
| A | 13 | 248 | 180846 | 1548.43 | 581 | 571 | 116.4 |
| A | 9 | 143 | 13844 | 114.01 | 581 | 571 | 116.4 |
| B | 0 | 230 | 62744 | 572.31 | 581 | 567 | 108.6 |
| B | 5 | 172 | 59561 | 543.01 | 581 | 567 | 108.6 |
| B | 15 | 85 | 55308 | 503.86 | 581 | 567 | 108.6 |
| C | 15 | 214 | 214323 | 1615.8 | 580 | 584 | 132.3 |
| C | 14 | 254 | 126452 | 951.52 | 580 | 584 | 132.3 |
| C | 15 | 159 | 27635 | 204.5 | 580 | 584 | 132.3 |
| D | 12 | 227 | 476971 | 3463.96 | 572 | 559 | 137.5 |
| D | 12 | 235 | 245170 | 1778.55 | 572 | 559 | 137.5 |
| D | 2 | 249 | 131550 | 952.43 | 572 | 559 | 137.5 |
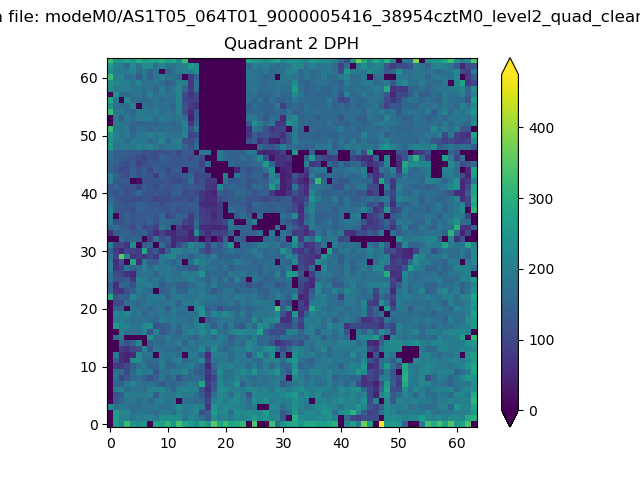
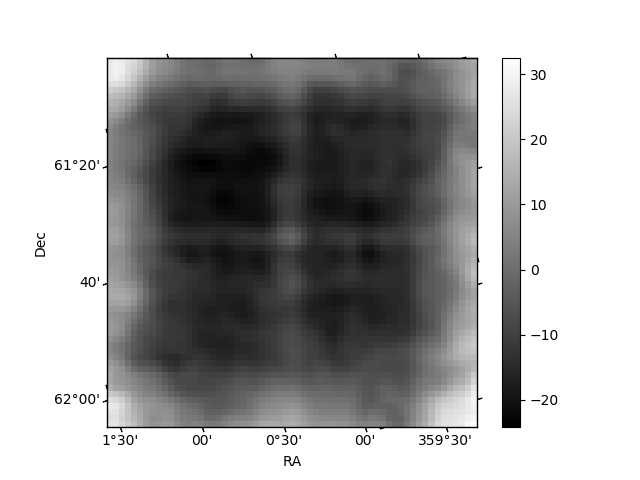
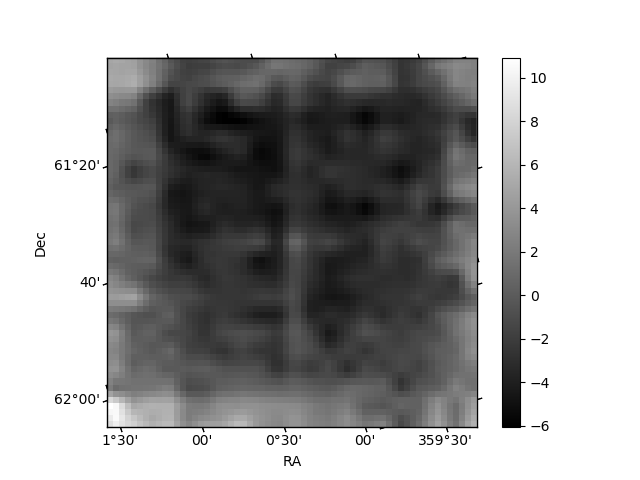
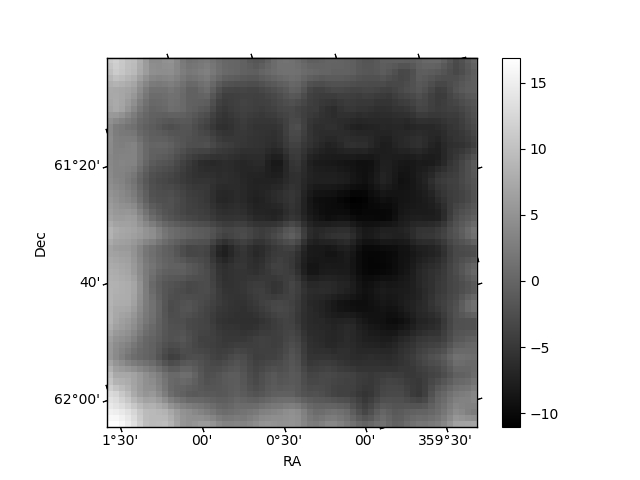
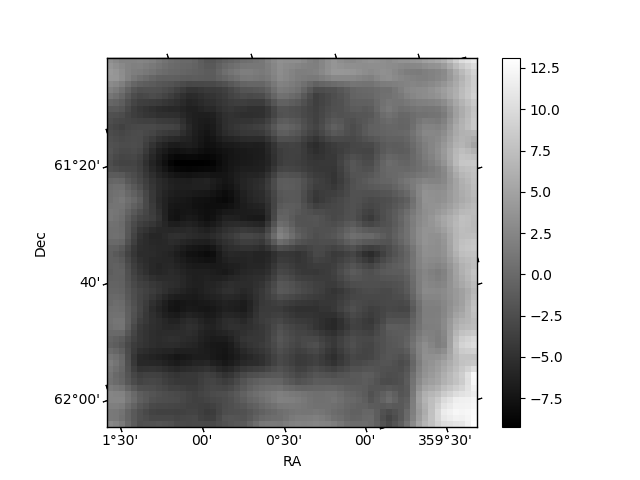
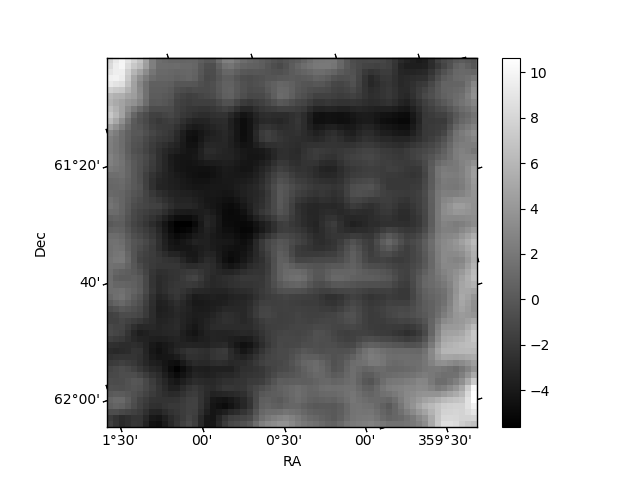
Histogram calculated using DETX and DETY for each event in the final _common_clean file
| Quadrant A | 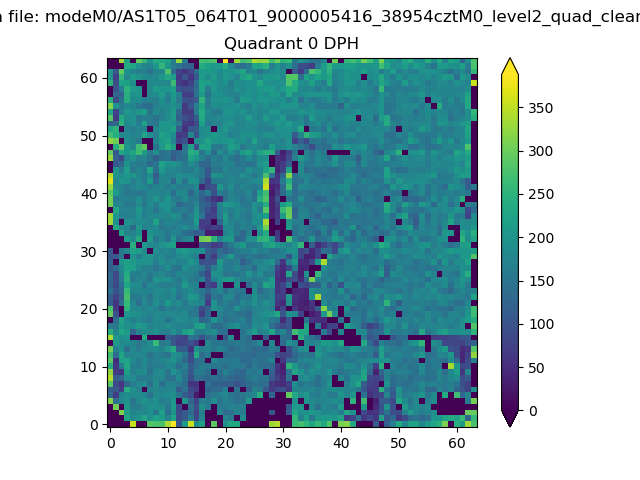 |
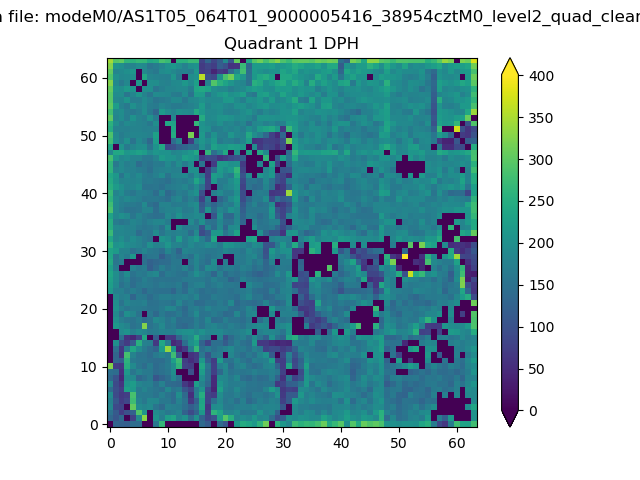 |
Quadrant B |
|---|---|---|---|
| Quadrant D | 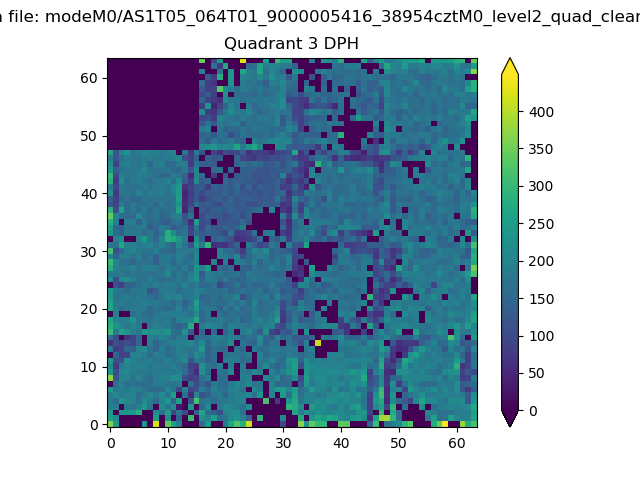 |
 |
Quadrant C |
| Plot type | Count rate plots | Images |
|---|---|---|
| Comparison with Poisson distribution Blue bars denote a histogram of data divided into 1 sec bins. Red curve is a Poisson curve with rate = median count rate of data. |
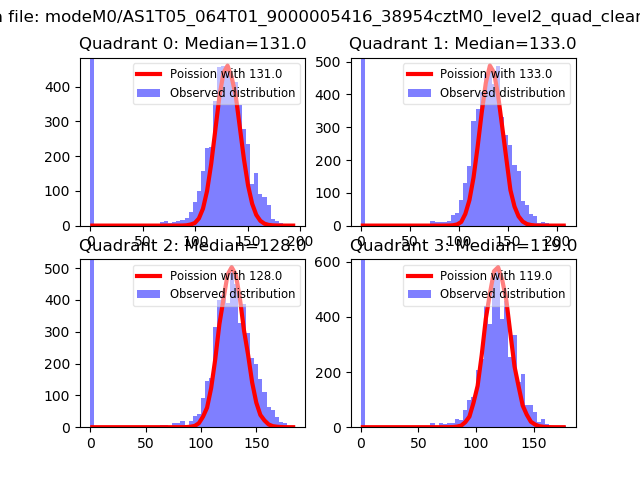 |
 |
| Quadrant-wise count rates Data is divided into 100 sec bins |
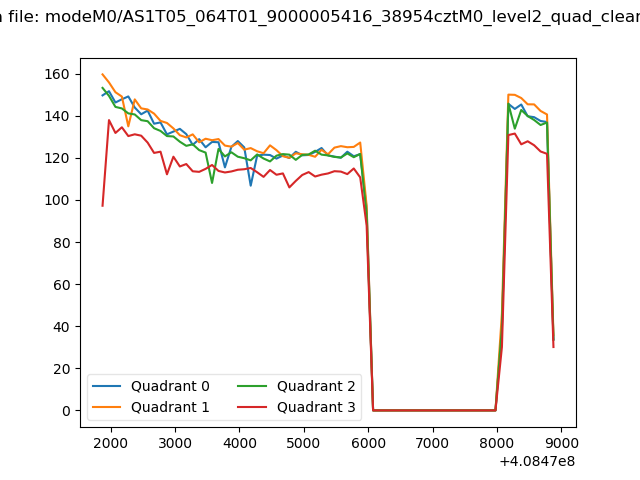 |
|
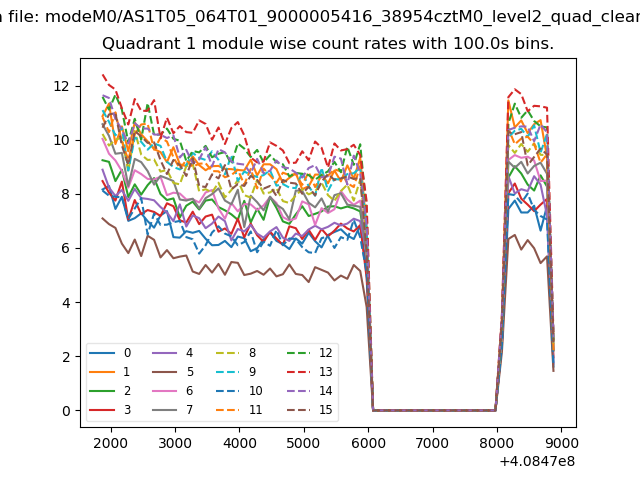
| Module-wise count rates for Quadrant A Data is divided into 100 sec bins |
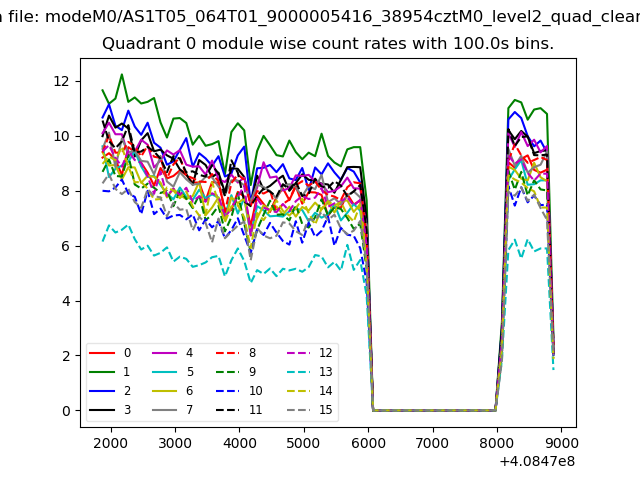 |
 |
| Module-wise count rates for Quadrant B Data is divided into 100 sec bins |
 |
 |
| Module-wise count rates for Quadrant C Data is divided into 100 sec bins |
 |
 |
| Module-wise count rates for Quadrant D Data is divided into 100 sec bins |
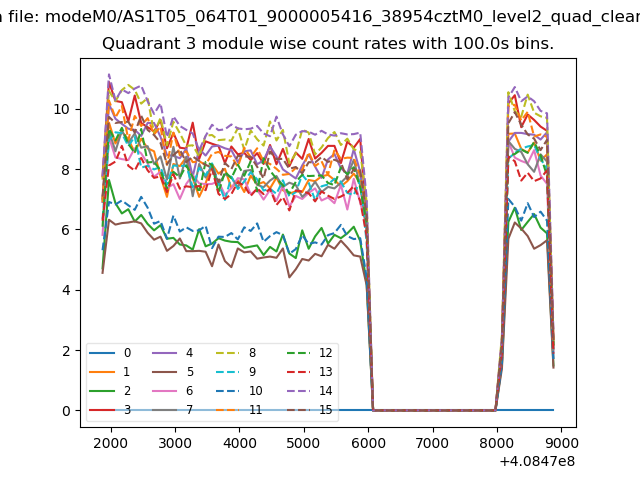 |
 |
| Parameter | Plot |
|---|---|
| CZT HV Monitor | 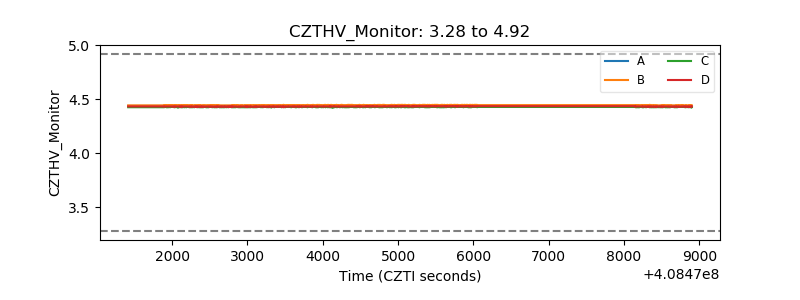 |
| D_VDD | 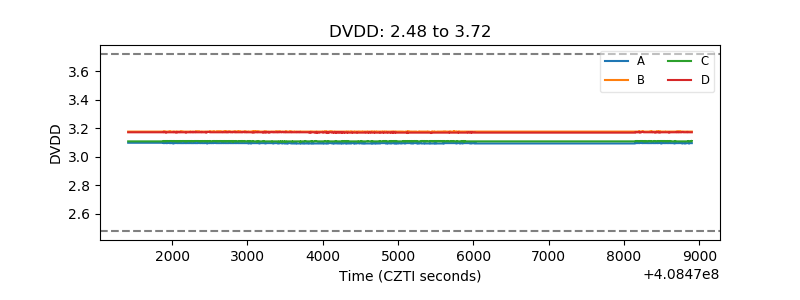 |
| Temperature 1 | 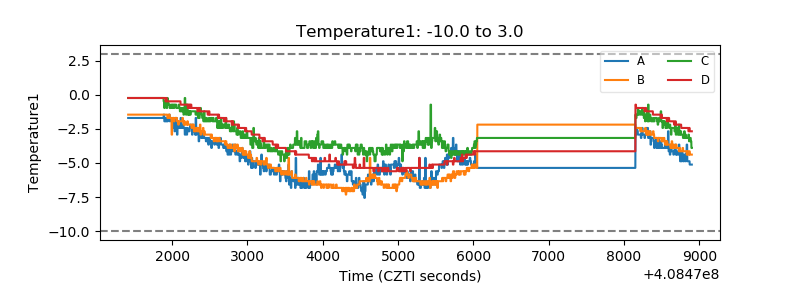 |
| Veto HV Monitor | 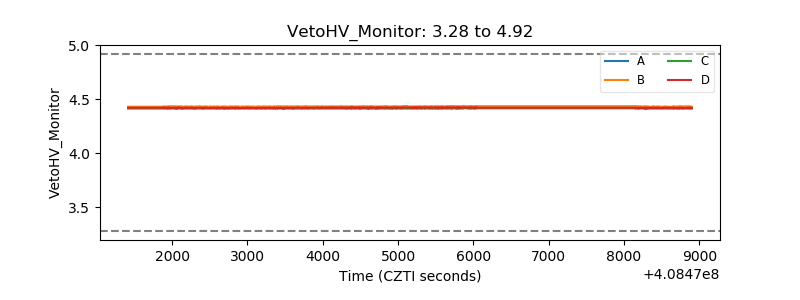 |
| Veto LLD | 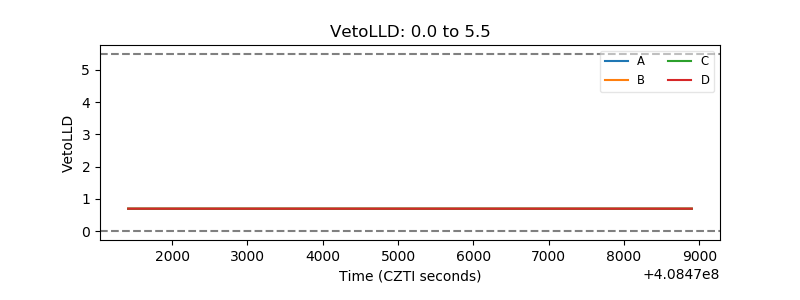 |
| Alpha Counter | 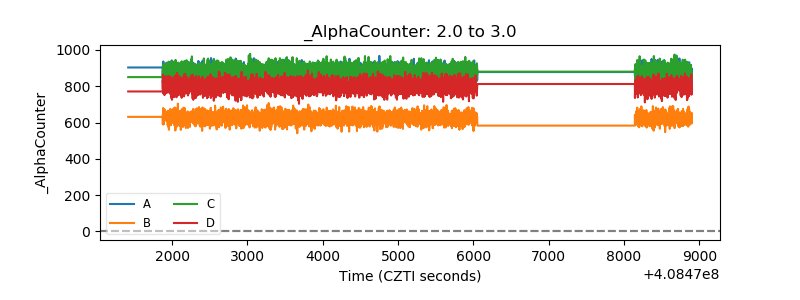 |
| _CPM_Rate | 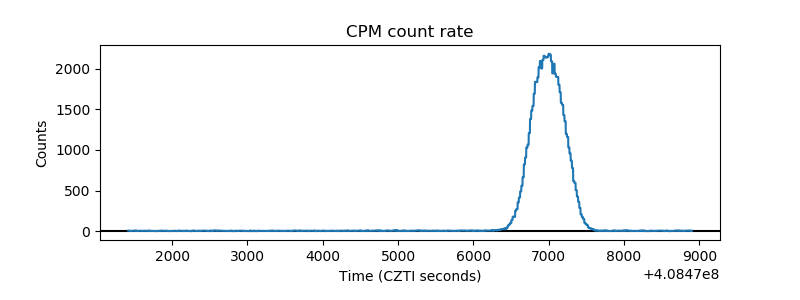 |
| CZT Counter | 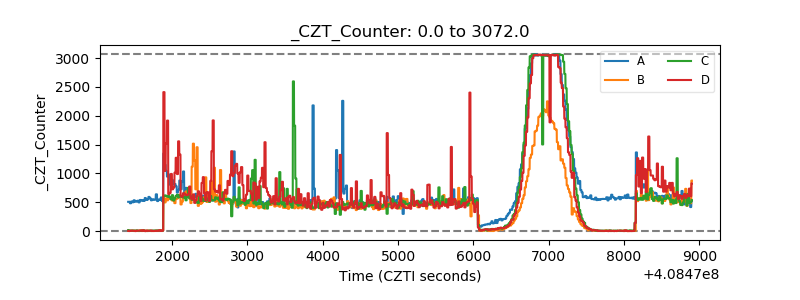 |
| +2.5 Volts monitor | 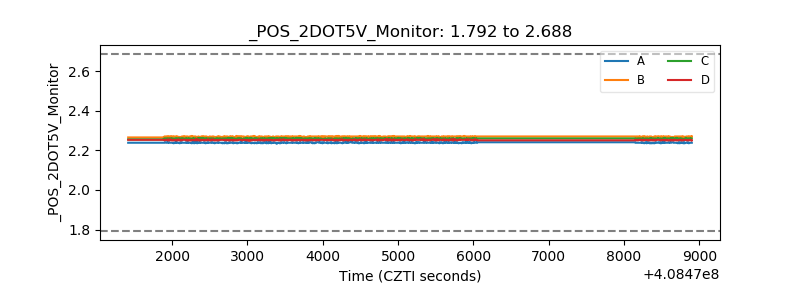 |
| +5 Volts monitor | 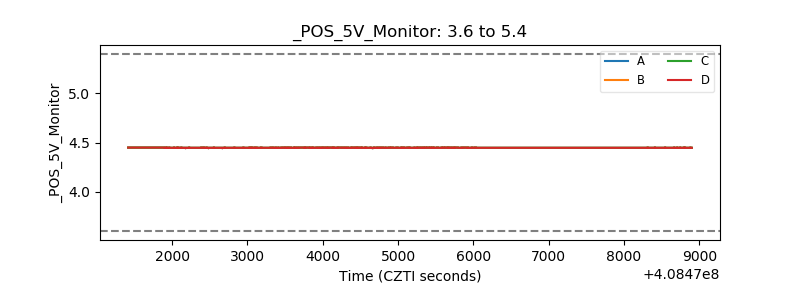 |
| _ROLL_ROT | 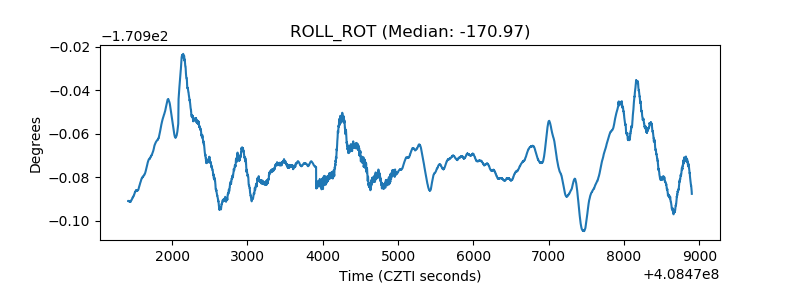 |
| _Roll_DEC | 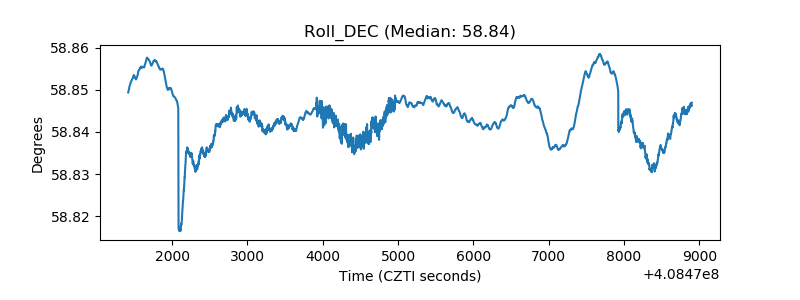 |
| _Roll_RA | 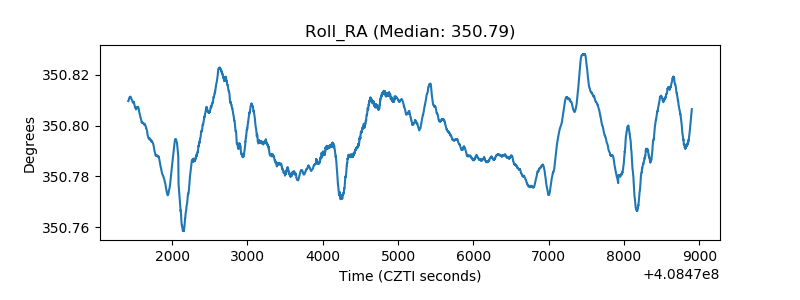 |
| Veto Counter | 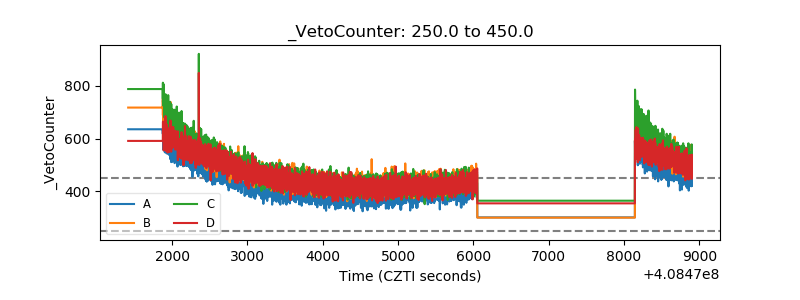 |