| Param | Original file | Final file |
|---|---|---|
| Filename | modeM0/AS1T05_064T01_9000005416_38955cztM0_level2.fits | modeM0/AS1T05_064T01_9000005416_38955cztM0_level2_quad_clean.evt |
| Size (bytes) | 355,386,240 | 91,056,960 |
| Size | 338.9 MB | 86.8 MB |
| Events in quadrant A | 3,603,768 | 606,431 |
| Events in quadrant B | 2,497,648 | 633,839 |
| Events in quadrant C | 2,504,082 | 619,642 |
| Events in quadrant D | 4,165,766 | 551,605 |
| Mode SS | |||
|---|---|---|---|
| Quadrant | BADHDUFLAG | Total packets | Discarded packets |
| A | 0 | 100 | 0 |
| B | 0 | 100 | 0 |
| C | 0 | 100 | 0 |
| D | 0 | 100 | 0 |
| Mode M9 | |||
|---|---|---|---|
| Quadrant | BADHDUFLAG | Total packets | Discarded packets |
| A | 0 | 30 | 0 |
| B | 0 | 30 | 0 |
| C | 0 | 30 | 0 |
| D | 0 | 31 | 0 |
| Mode M0 | |||
|---|---|---|---|
| Quadrant | BADHDUFLAG | Total packets | Discarded packets |
| A | 0 | 13790 | 3 |
| B | 0 | 10561 | 2 |
| C | 0 | 10300 | 2 |
| D | 0 | 15823 | 2 |
| Quadrant | Total seconds | Saturated seconds | Saturation percentage |
|---|---|---|---|
| A | 4933 | 224 | 4.540847% |
| B | 4933 | 66 | 1.337928% |
| C | 4933 | 19 | 0.385161% |
| D | 4933 | 249 | 5.047638% |
Noise dominated data is calculated using 1-second bins in cleaned event files. If a bin has >2000 counts, and if more than 50% of those come from <1% of pixels, then it is considered to be noise-dominated and hence unusable.
| Quadrant | # 1 sec bins | Bins with >0 counts | Bins with >2000 counts | High rate bins dominated by noise | Noise dominated (total time) | Noise dominated (detector-on time) | Marked lightcurve |
|---|---|---|---|---|---|---|---|
| A | 7055 | 4934 | 222 | 222 | 3.15% | 4.50% | 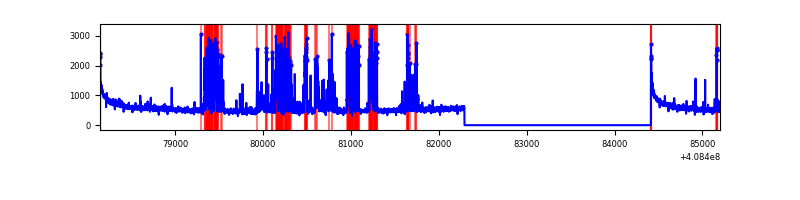 |
| B | 7055 | 4934 | 45 | 45 | 0.64% | 0.91% | 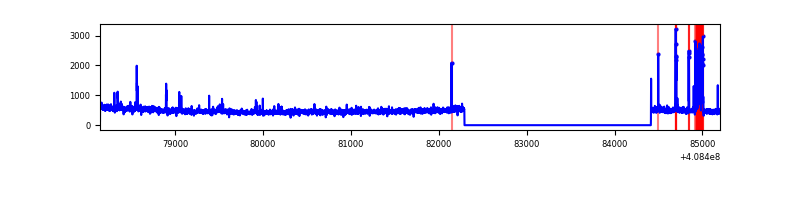 |
| C | 7055 | 4934 | 16 | 16 | 0.23% | 0.32% | 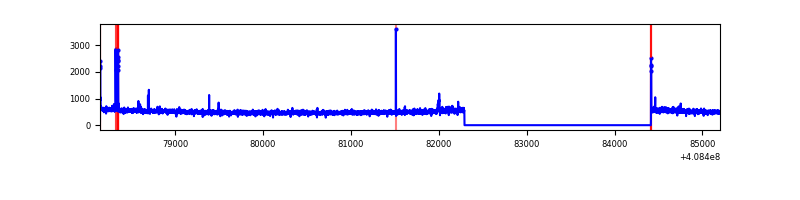 |
| D | 7055 | 4934 | 261 | 261 | 3.70% | 5.29% | 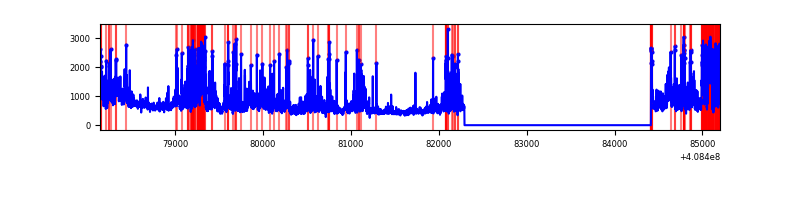 |
Top three noisy pixels from each quadrant. If the there are fewer than three noisy pixels in the level2.evt file, extra rows are filled as -1
| Pixel properties | Quadrant properties | ||||||
|---|---|---|---|---|---|---|---|
| Quadrant | DetID | PixID | Counts | Sigma | Mean | Median | Sigma |
| A | 13 | 248 | 984213 | 8691.46 | 559 | 548 | 113.2 |
| A | 10 | 83 | 416642 | 3676.52 | 559 | 548 | 113.2 |
| A | 6 | 10 | 19915 | 171.12 | 559 | 548 | 113.2 |
| B | 5 | 172 | 178938 | 1652.69 | 569 | 554 | 107.9 |
| B | 10 | 246 | 40942 | 374.19 | 569 | 554 | 107.9 |
| B | 0 | 230 | 23501 | 212.6 | 569 | 554 | 107.9 |
| C | 15 | 214 | 204803 | 1562.68 | 570 | 574 | 130.7 |
| C | 15 | 159 | 24959 | 186.58 | 570 | 574 | 130.7 |
| C | 14 | 254 | 23208 | 173.19 | 570 | 574 | 130.7 |
| D | 12 | 235 | 629049 | 4737.24 | 553 | 540 | 132.7 |
| D | 2 | 250 | 609908 | 4592.97 | 553 | 540 | 132.7 |
| D | 12 | 227 | 272129 | 2047.04 | 553 | 540 | 132.7 |
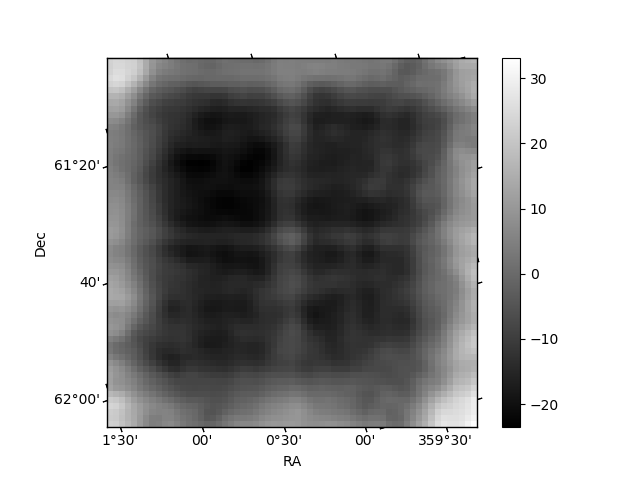
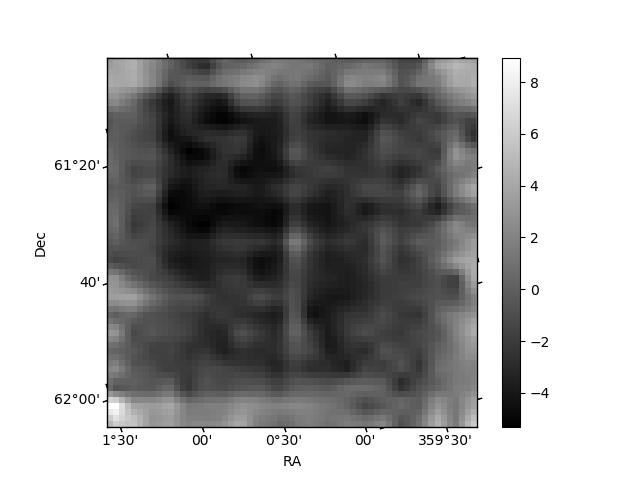
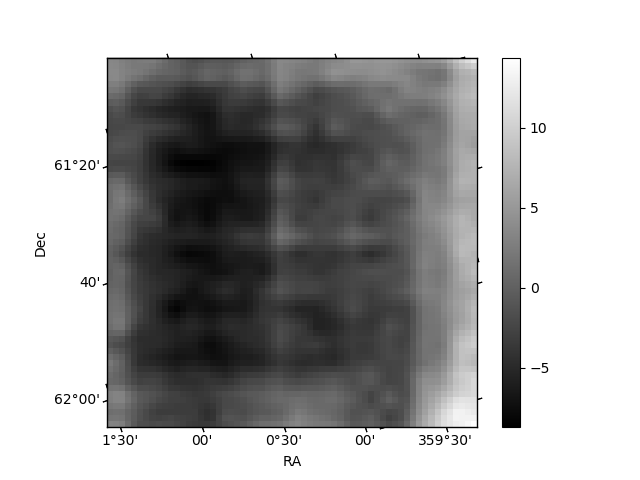
Histogram calculated using DETX and DETY for each event in the final _common_clean file
| Quadrant A | 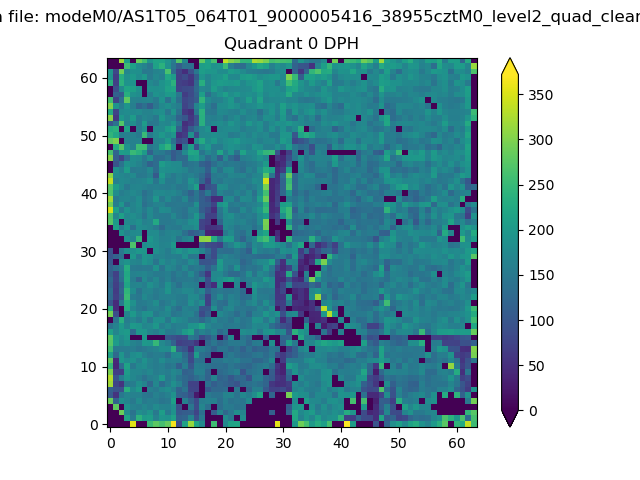 |
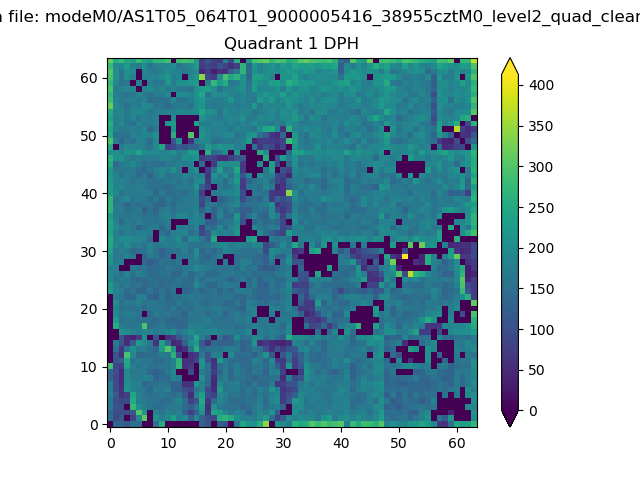 |
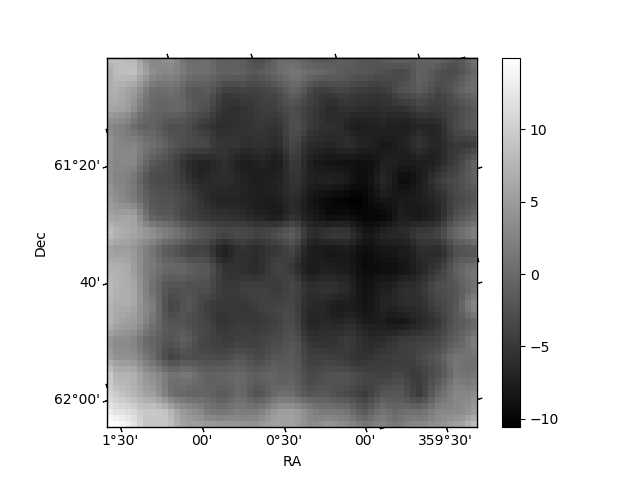
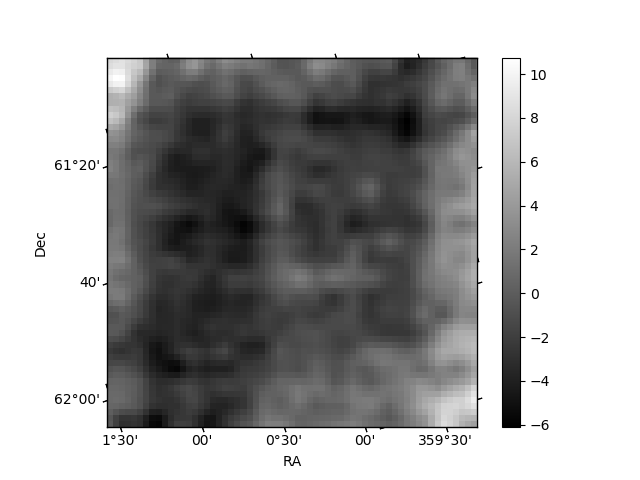
Quadrant B |
|---|---|---|---|
| Quadrant D | 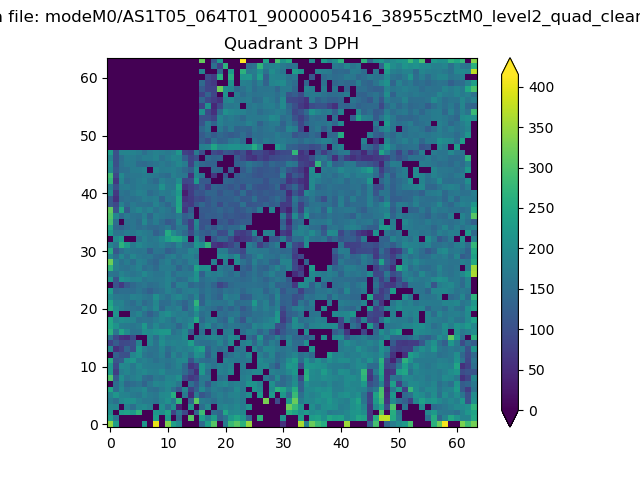 |
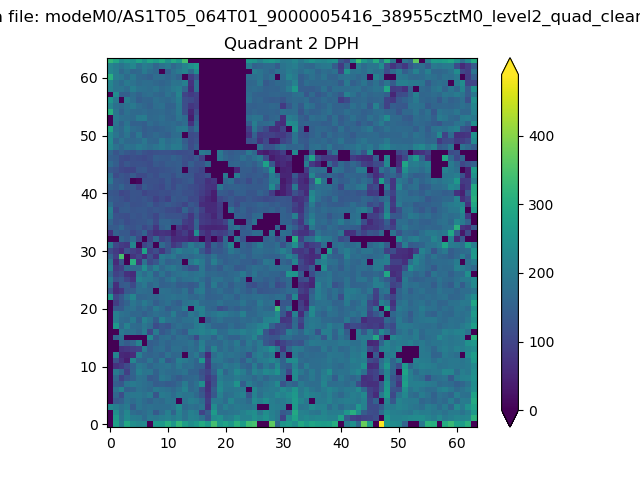 |
Quadrant C |
| Plot type | Count rate plots | Images |
|---|---|---|
| Comparison with Poisson distribution Blue bars denote a histogram of data divided into 1 sec bins. Red curve is a Poisson curve with rate = median count rate of data. |
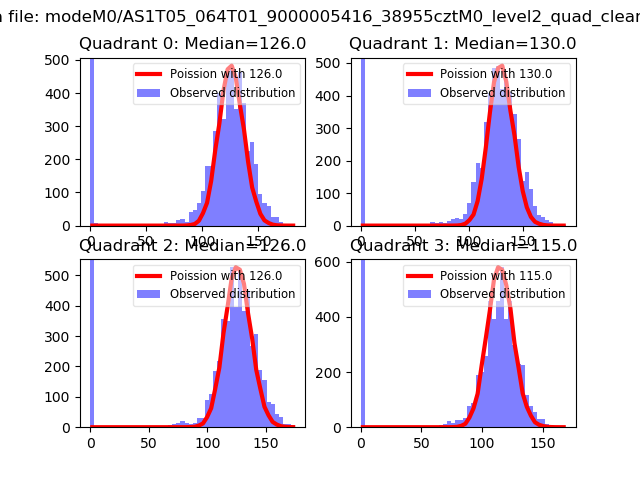 |
 |
| Quadrant-wise count rates Data is divided into 100 sec bins |
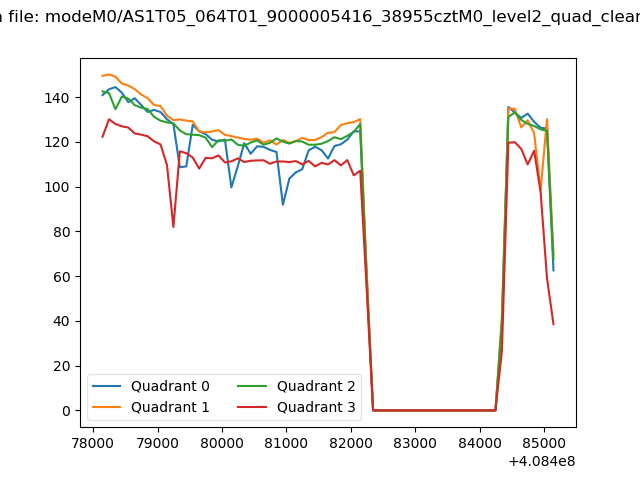 |
|
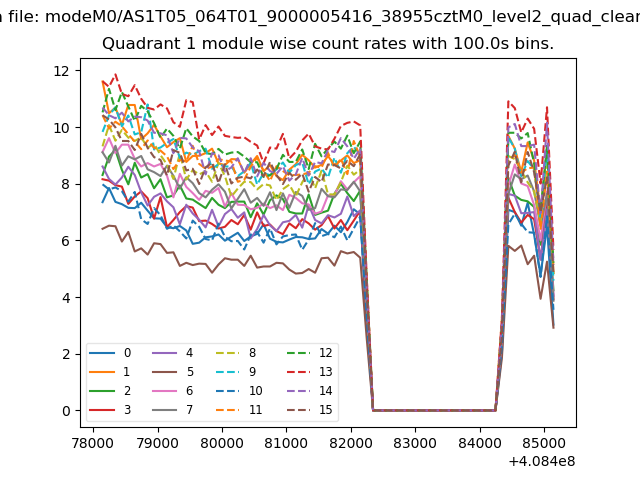
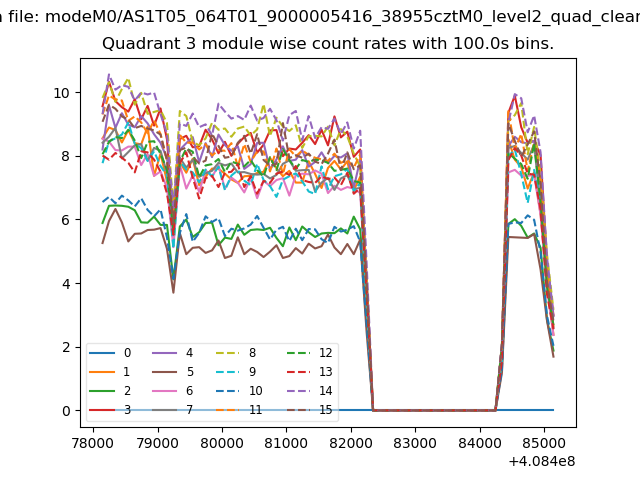
| Module-wise count rates for Quadrant A Data is divided into 100 sec bins |
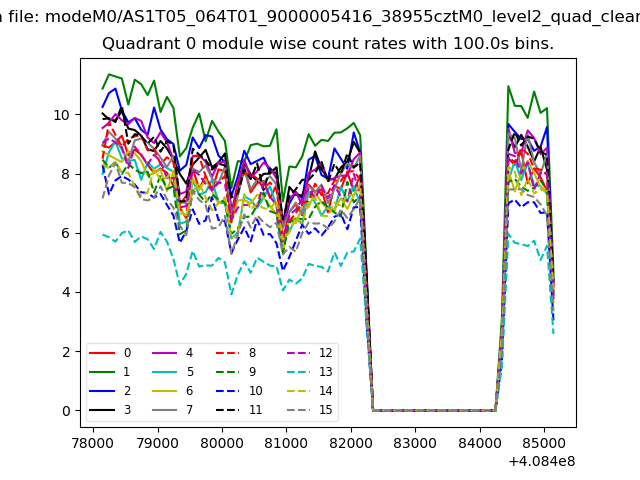 |
 |
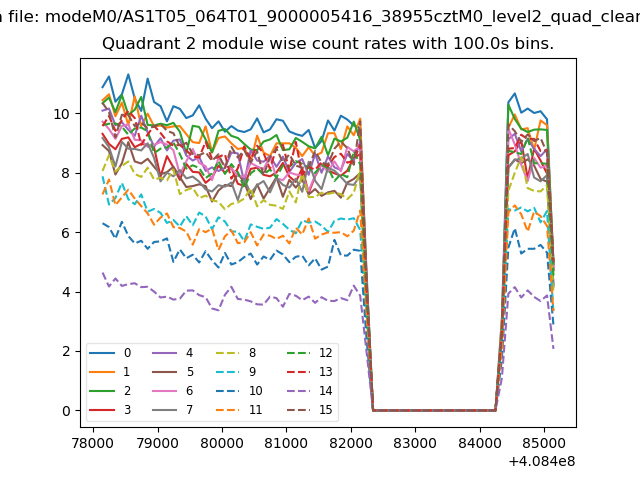
| Module-wise count rates for Quadrant B Data is divided into 100 sec bins |
 |
 |
| Module-wise count rates for Quadrant C Data is divided into 100 sec bins |
 |
 |
| Module-wise count rates for Quadrant D Data is divided into 100 sec bins |
 |
 |
| Parameter | Plot |
|---|---|
| CZT HV Monitor | 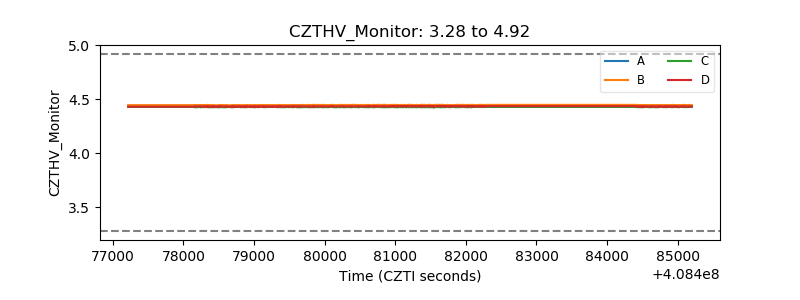 |
| D_VDD | 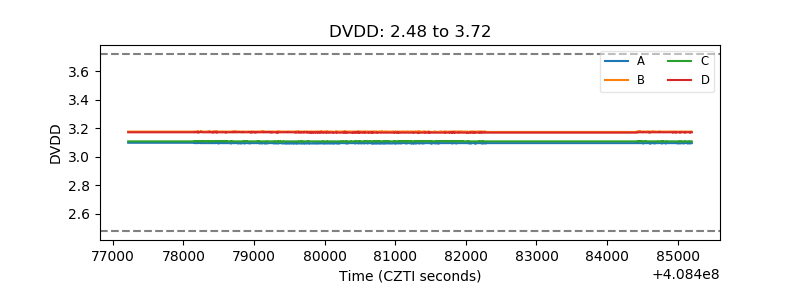 |
| Temperature 1 | 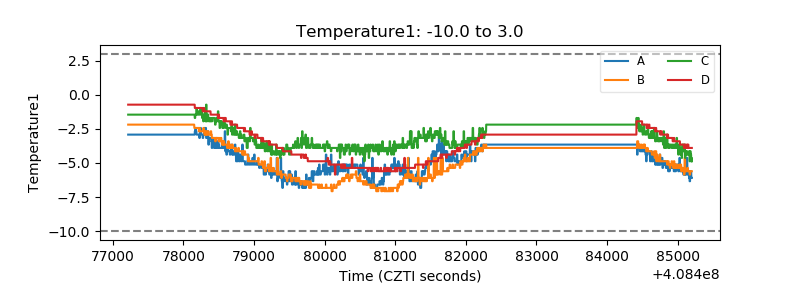 |
| Veto HV Monitor | 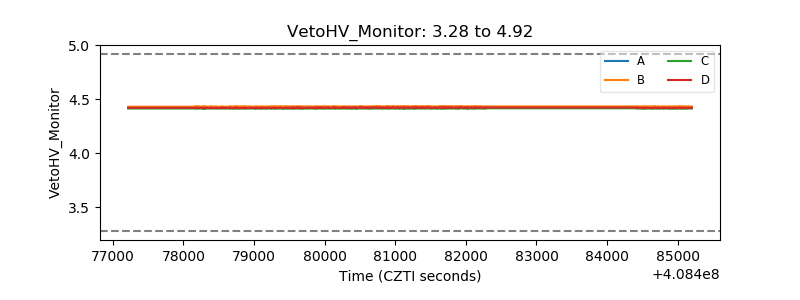 |
| Veto LLD | 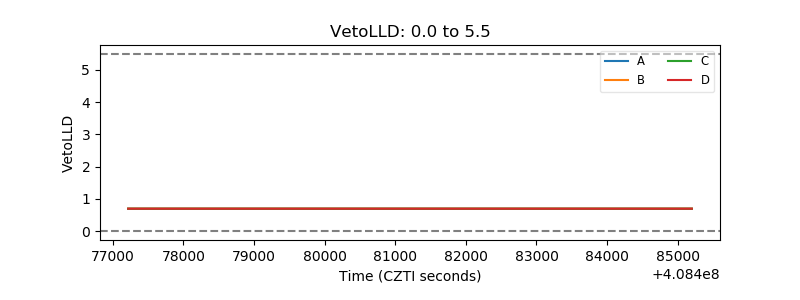 |
| Alpha Counter | 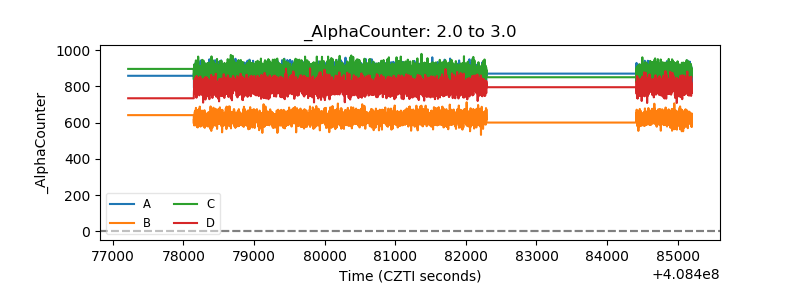 |
| _CPM_Rate | 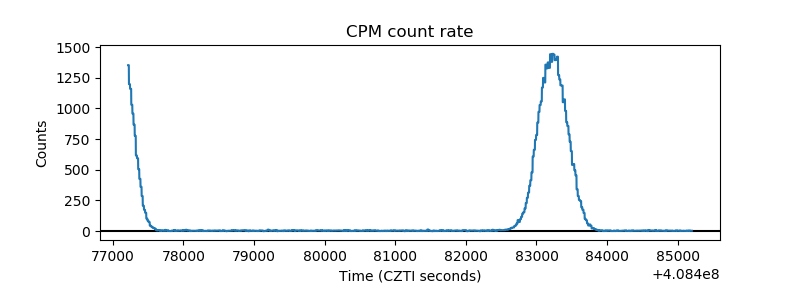 |
| CZT Counter | 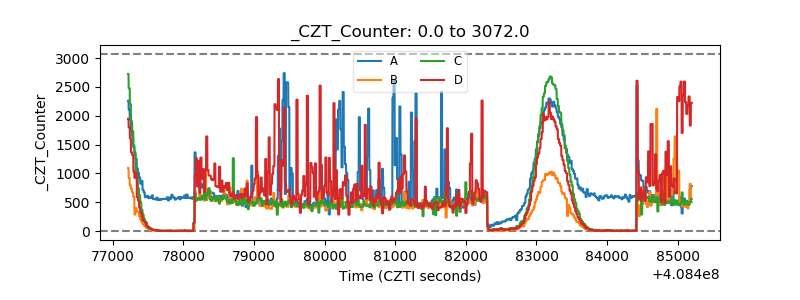 |
| +2.5 Volts monitor | 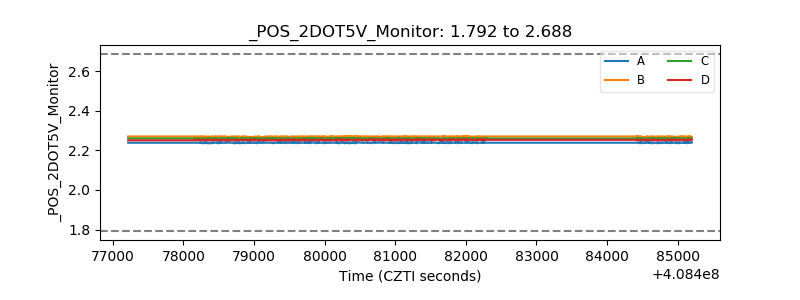 |
| +5 Volts monitor | 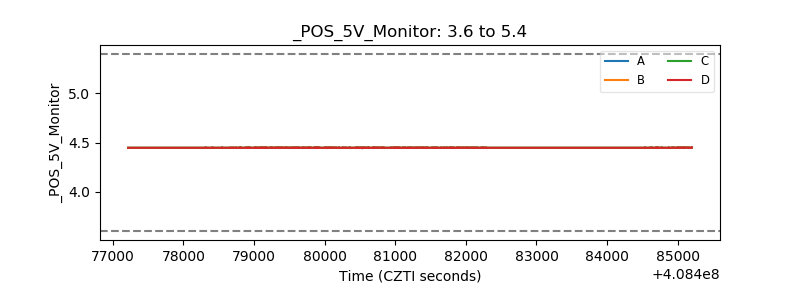 |
| _ROLL_ROT | 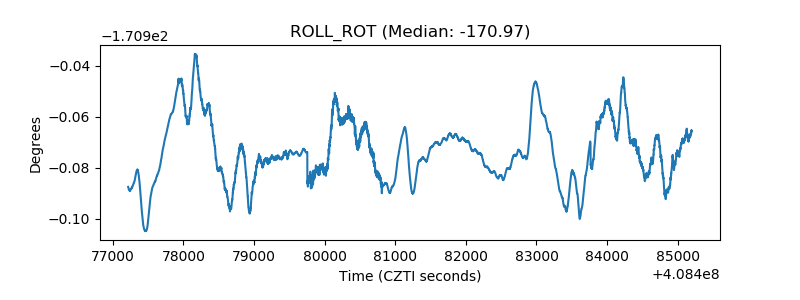 |
| _Roll_DEC | 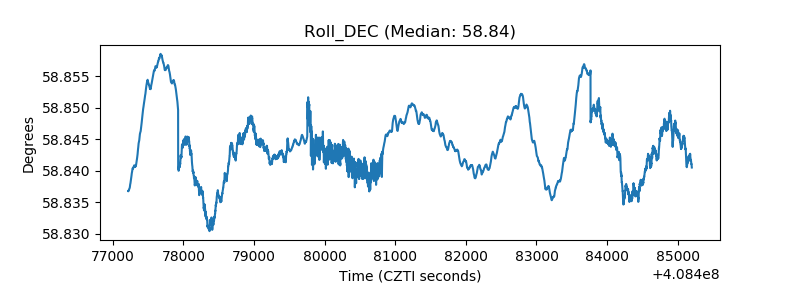 |
| _Roll_RA | 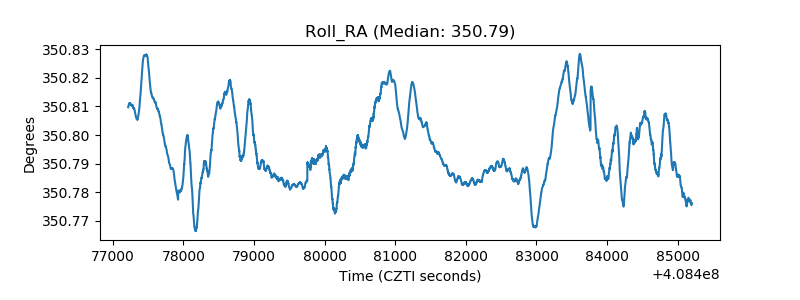 |
| Veto Counter | 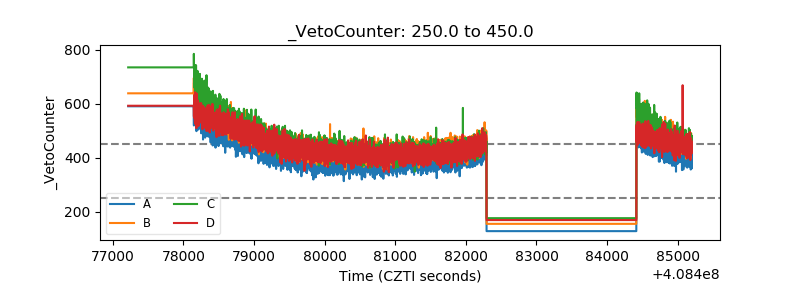 |