| Param | Original file | Final file |
|---|---|---|
| Filename | modeM0/AS1T05_064T01_9000005416_38956cztM0_level2.fits | modeM0/AS1T05_064T01_9000005416_38956cztM0_level2_quad_clean.evt |
| Size (bytes) | 343,552,320 | 86,728,320 |
| Size | 327.6 MB | 82.7 MB |
| Events in quadrant A | 3,573,865 | 565,049 |
| Events in quadrant B | 2,536,931 | 600,922 |
| Events in quadrant C | 2,521,490 | 589,316 |
| Events in quadrant D | 3,699,250 | 523,320 |
| Mode SS | |||
|---|---|---|---|
| Quadrant | BADHDUFLAG | Total packets | Discarded packets |
| A | 0 | 102 | 0 |
| B | 0 | 102 | 0 |
| C | 0 | 102 | 0 |
| D | 0 | 102 | 0 |
| Mode M9 | |||
|---|---|---|---|
| Quadrant | BADHDUFLAG | Total packets | Discarded packets |
| A | 0 | 34 | 0 |
| B | 0 | 34 | 0 |
| C | 0 | 34 | 0 |
| D | 0 | 35 | 0 |
| Mode M0 | |||
|---|---|---|---|
| Quadrant | BADHDUFLAG | Total packets | Discarded packets |
| A | 0 | 13693 | 3 |
| B | 0 | 10886 | 2 |
| C | 0 | 10471 | 2 |
| D | 0 | 14344 | 2 |
| Quadrant | Total seconds | Saturated seconds | Saturation percentage |
|---|---|---|---|
| A | 4953 | 284 | 5.733899% |
| B | 4953 | 82 | 1.655562% |
| C | 4953 | 11 | 0.222088% |
| D | 4953 | 221 | 4.461942% |
Noise dominated data is calculated using 1-second bins in cleaned event files. If a bin has >2000 counts, and if more than 50% of those come from <1% of pixels, then it is considered to be noise-dominated and hence unusable.
| Quadrant | # 1 sec bins | Bins with >0 counts | Bins with >2000 counts | High rate bins dominated by noise | Noise dominated (total time) | Noise dominated (detector-on time) | Marked lightcurve |
|---|---|---|---|---|---|---|---|
| A | 7047 | 4954 | 299 | 299 | 4.24% | 6.04% | 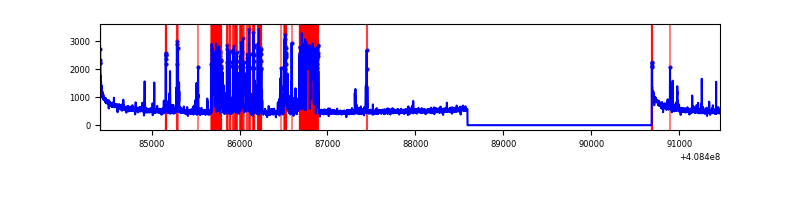 |
| B | 7047 | 4954 | 68 | 68 | 0.96% | 1.37% | 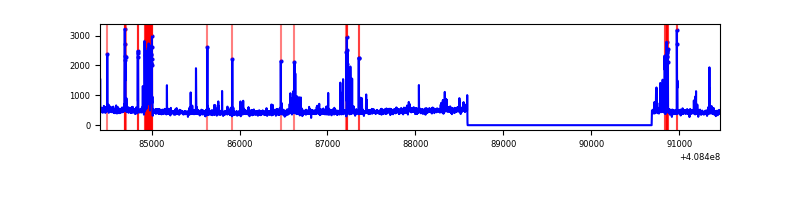 |
| C | 7047 | 4954 | 7 | 7 | 0.10% | 0.14% | 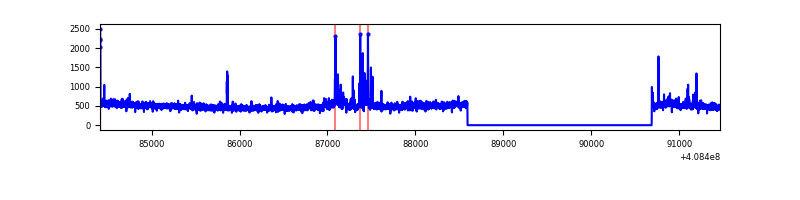 |
| D | 7047 | 4954 | 227 | 227 | 3.22% | 4.58% | 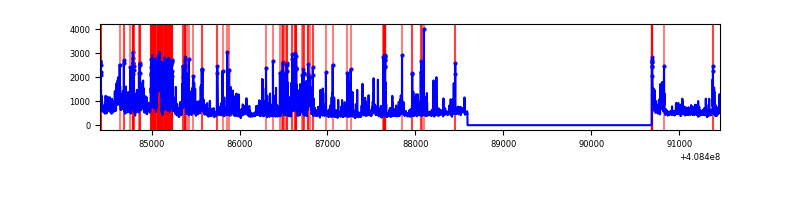 |
Top three noisy pixels from each quadrant. If the there are fewer than three noisy pixels in the level2.evt file, extra rows are filled as -1
| Pixel properties | Quadrant properties | ||||||
|---|---|---|---|---|---|---|---|
| Quadrant | DetID | PixID | Counts | Sigma | Mean | Median | Sigma |
| A | 13 | 248 | 1051678 | 9674.78 | 538 | 527 | 108.6 |
| A | 10 | 83 | 397023 | 3649.34 | 538 | 527 | 108.6 |
| A | 6 | 10 | 27132 | 244.87 | 538 | 527 | 108.6 |
| B | 5 | 172 | 257942 | 2440.44 | 548 | 532 | 105.5 |
| B | 5 | 184 | 92426 | 871.23 | 548 | 532 | 105.5 |
| B | 0 | 230 | 13209 | 120.19 | 548 | 532 | 105.5 |
| C | 15 | 214 | 205023 | 1616.55 | 549 | 554 | 126.5 |
| C | 14 | 254 | 145579 | 1146.58 | 549 | 554 | 126.5 |
| C | 15 | 159 | 12165 | 91.8 | 549 | 554 | 126.5 |
| D | 2 | 250 | 668475 | 5187.78 | 533 | 520 | 128.8 |
| D | 12 | 235 | 432446 | 3354.62 | 533 | 520 | 128.8 |
| D | 13 | 249 | 154359 | 1194.82 | 533 | 520 | 128.8 |
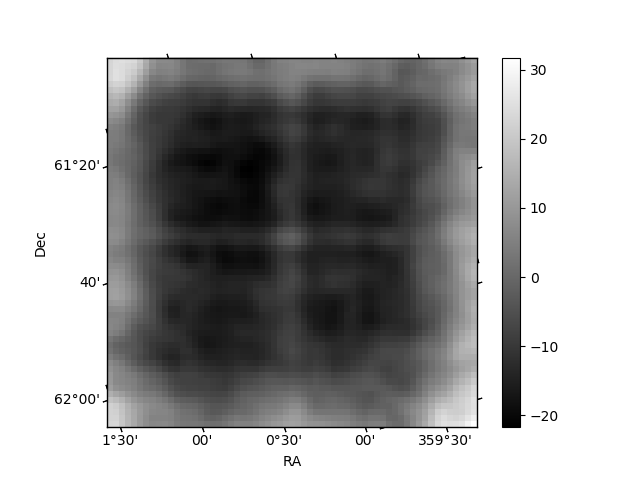
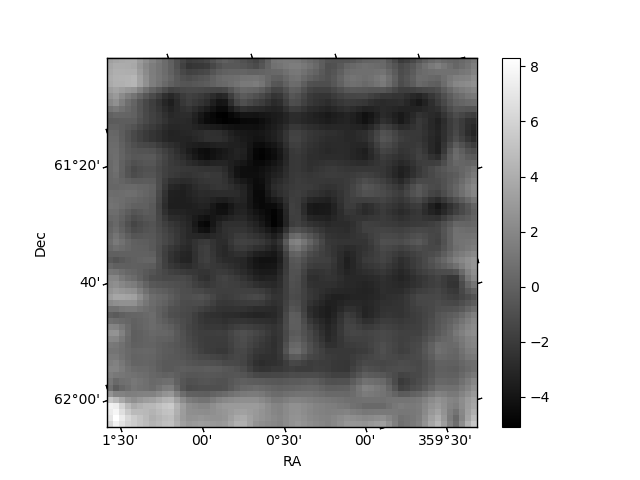
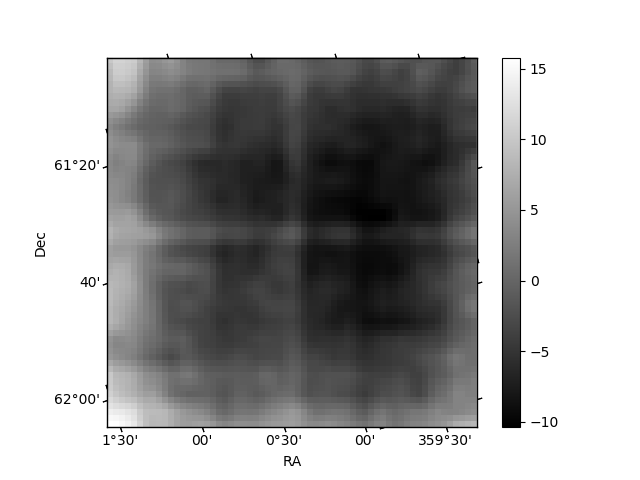
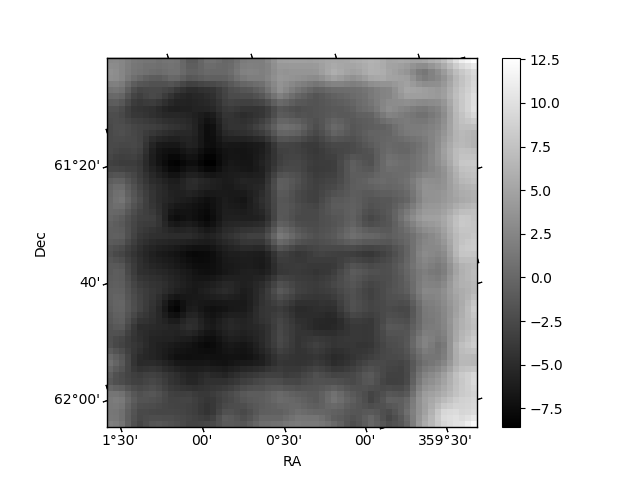
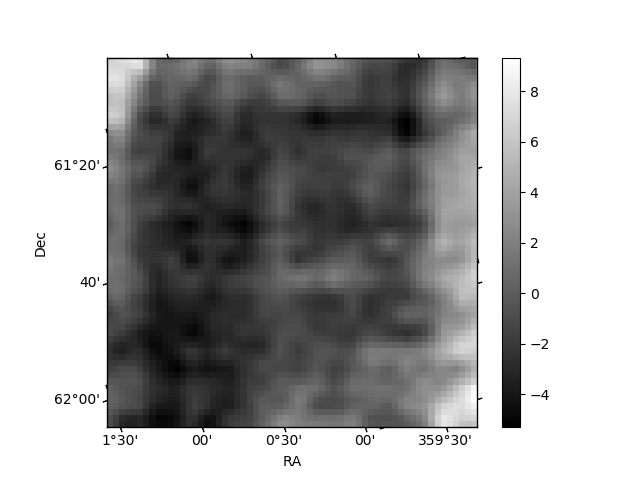
Histogram calculated using DETX and DETY for each event in the final _common_clean file
| Quadrant A | 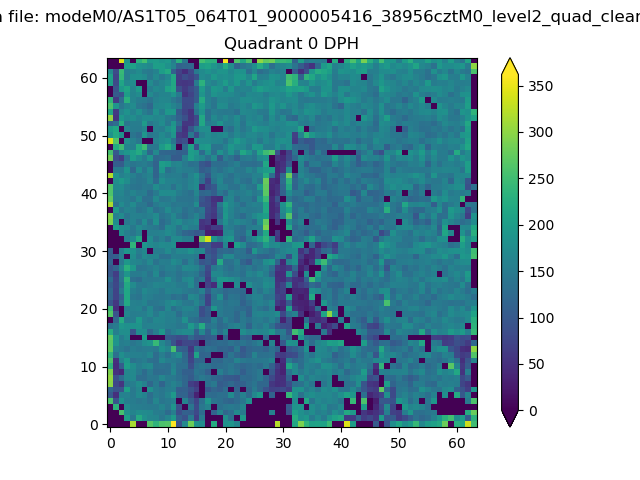 |
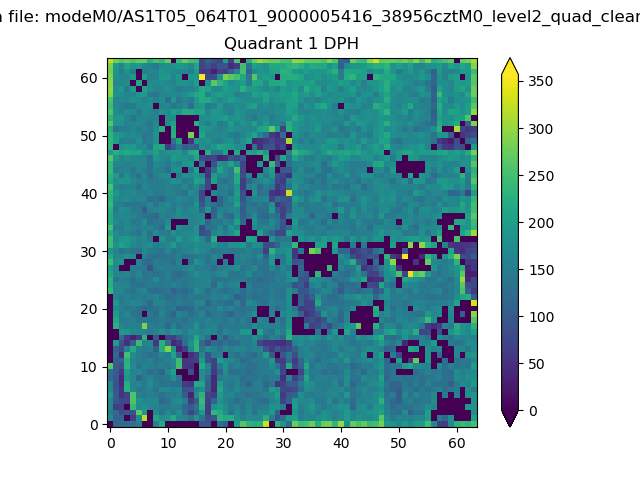 |
Quadrant B |
|---|---|---|---|
| Quadrant D | 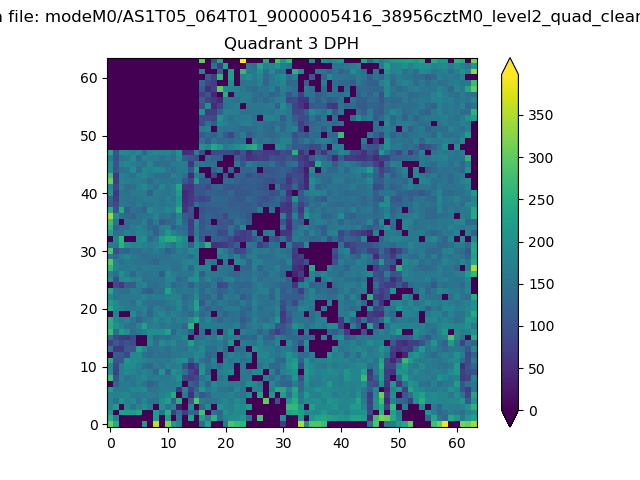 |
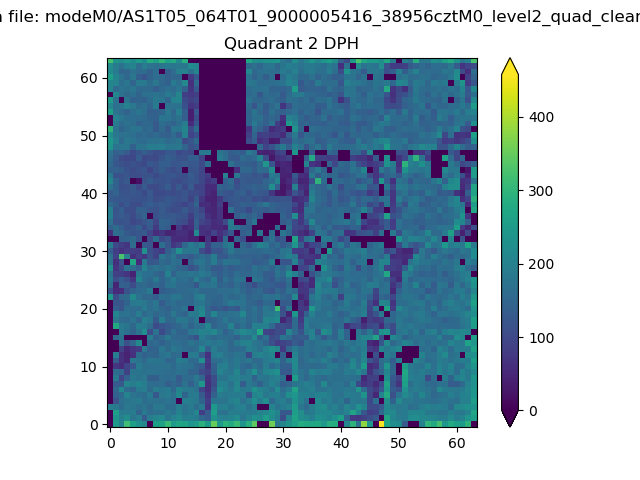 |
Quadrant C |
| Plot type | Count rate plots | Images |
|---|---|---|
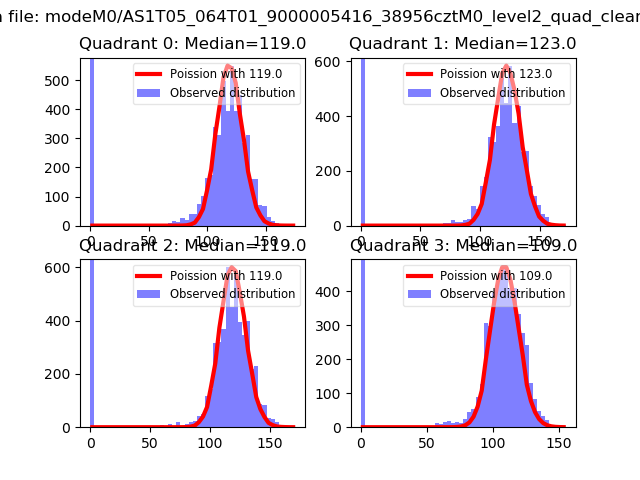
| Comparison with Poisson distribution Blue bars denote a histogram of data divided into 1 sec bins. Red curve is a Poisson curve with rate = median count rate of data. |
 |
 |
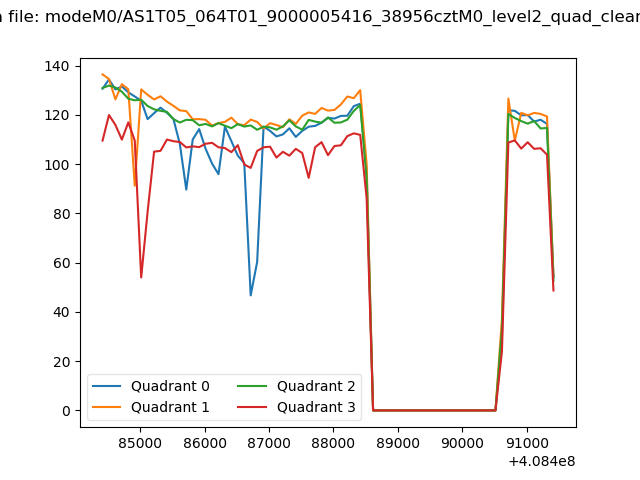
| Quadrant-wise count rates Data is divided into 100 sec bins |
 |
|
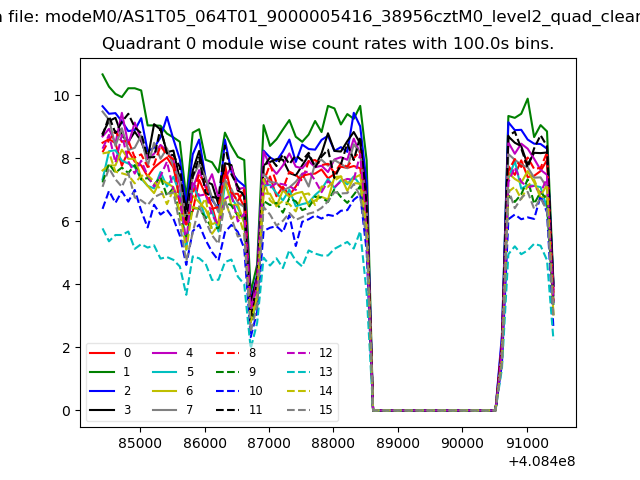
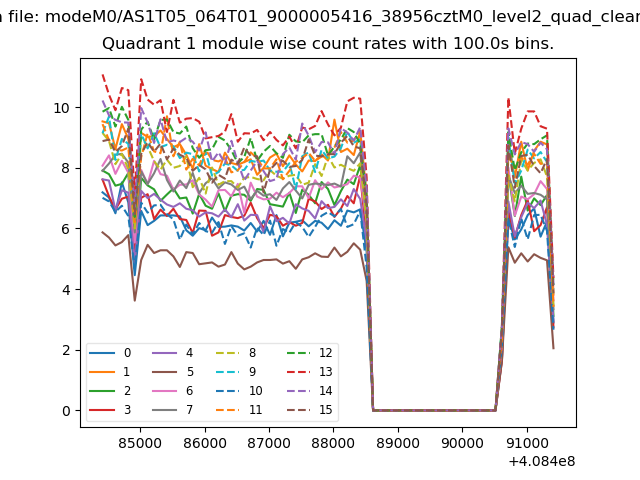
| Module-wise count rates for Quadrant A Data is divided into 100 sec bins |
 |
 |
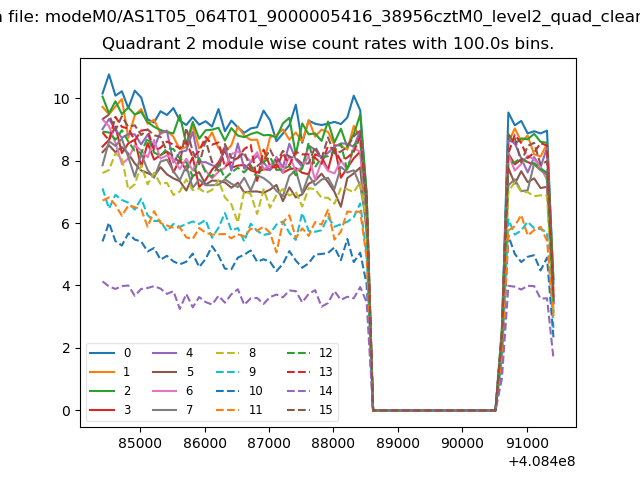
| Module-wise count rates for Quadrant B Data is divided into 100 sec bins |
 |
 |
| Module-wise count rates for Quadrant C Data is divided into 100 sec bins |
 |
 |
| Module-wise count rates for Quadrant D Data is divided into 100 sec bins |
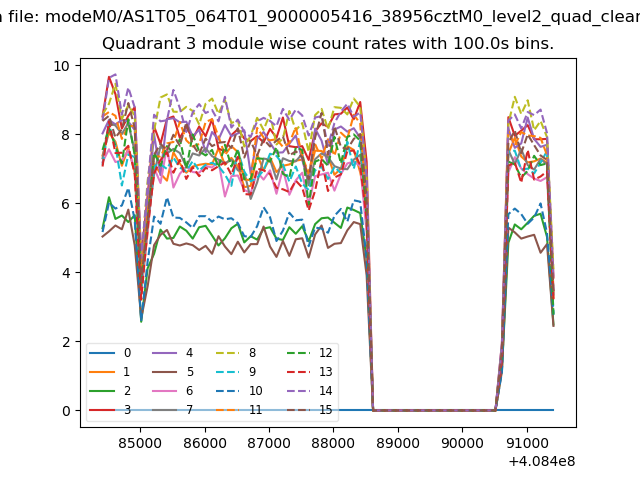 |
 |
| Parameter | Plot |
|---|---|
| CZT HV Monitor | 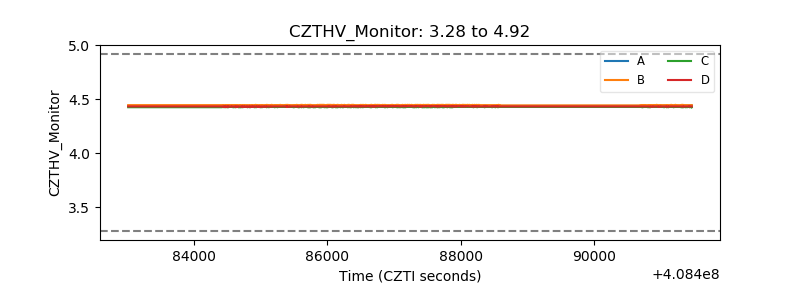 |
| D_VDD | 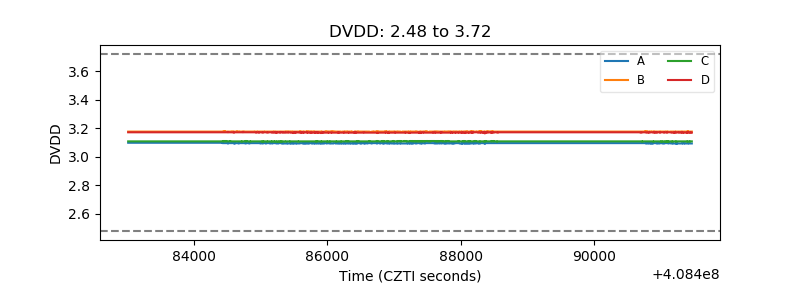 |
| Temperature 1 | 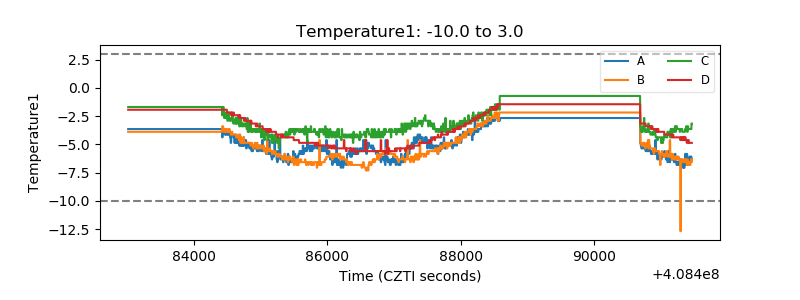 |
| Veto HV Monitor | 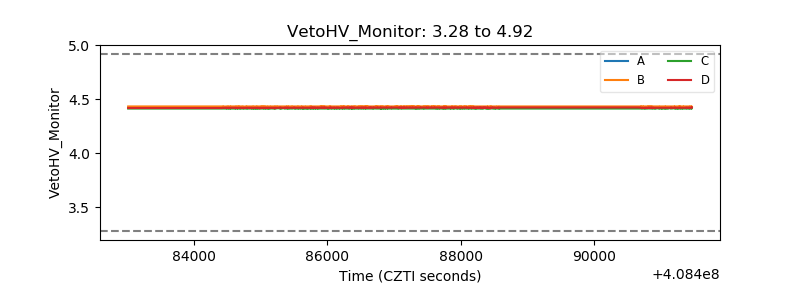 |
| Veto LLD | 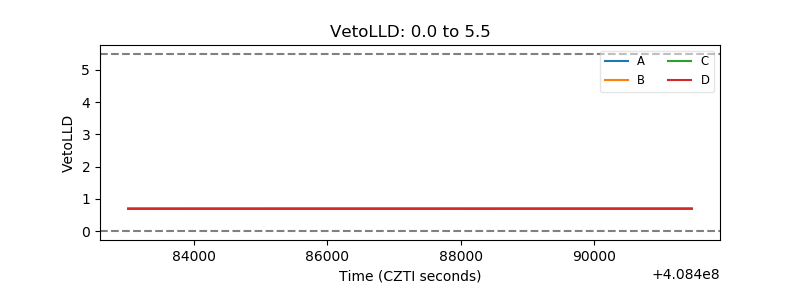 |
| Alpha Counter | 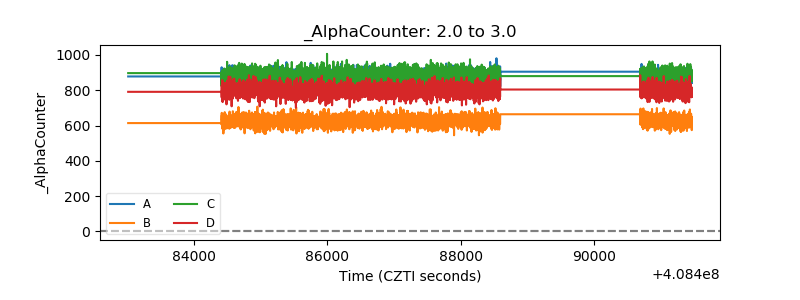 |
| _CPM_Rate | 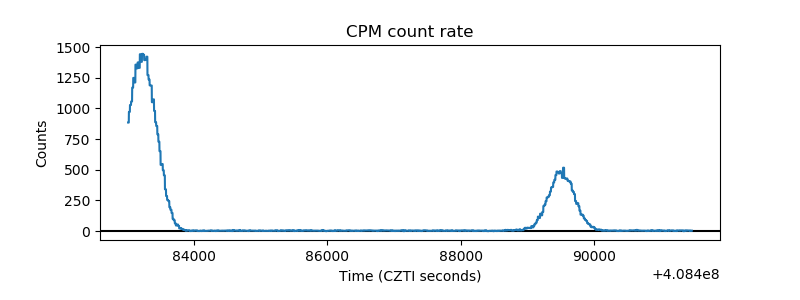 |
| CZT Counter | 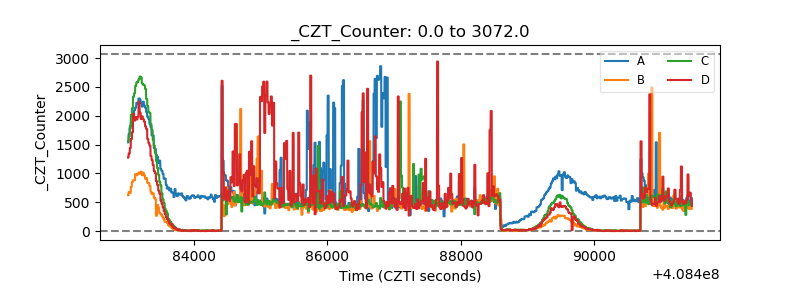 |
| +2.5 Volts monitor | 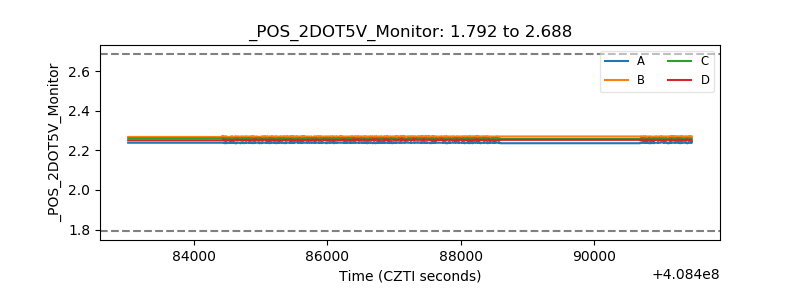 |
| +5 Volts monitor | 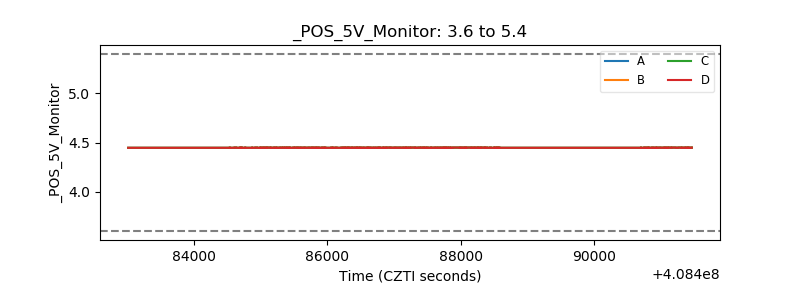 |
| _ROLL_ROT | 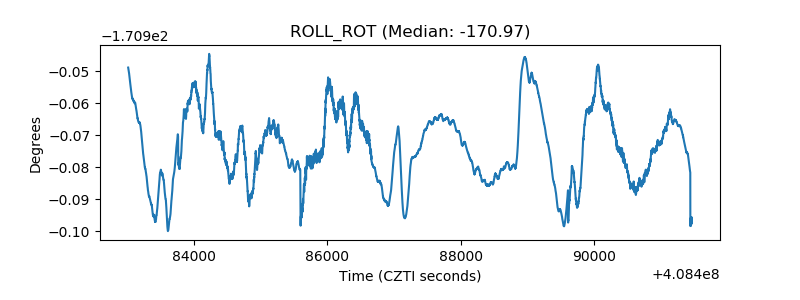 |
| _Roll_DEC | 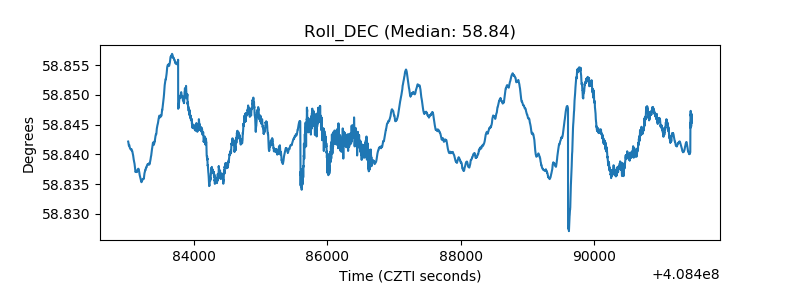 |
| _Roll_RA | 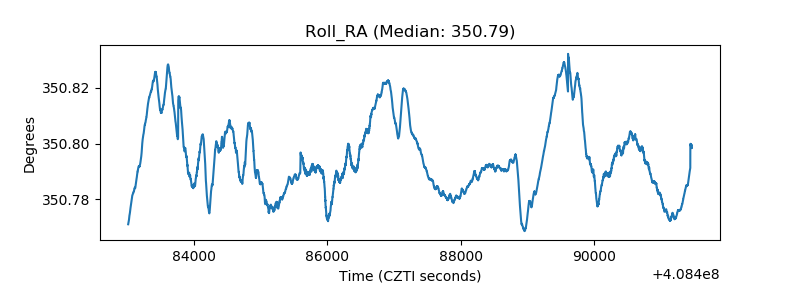 |
| Veto Counter | 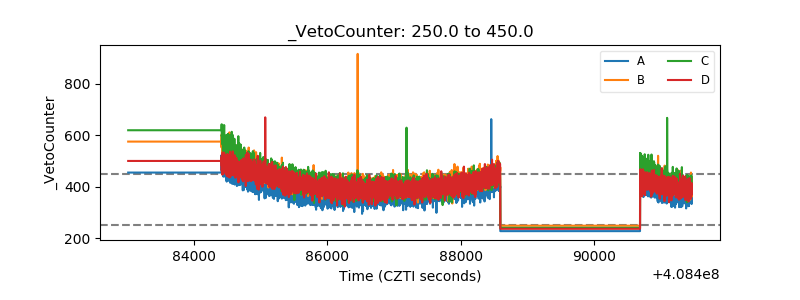 |