| Param | Original file | Final file |
|---|---|---|
| Filename | modeM0/AS1T05_064T01_9000005416_38958cztM0_level2.fits | modeM0/AS1T05_064T01_9000005416_38958cztM0_level2_quad_clean.evt |
| Size (bytes) | 366,085,440 | 90,941,760 |
| Size | 349.1 MB | 86.7 MB |
| Events in quadrant A | 3,338,552 | 609,161 |
| Events in quadrant B | 2,627,298 | 620,499 |
| Events in quadrant C | 3,115,599 | 598,871 |
| Events in quadrant D | 4,042,656 | 540,777 |
| Mode SS | |||
|---|---|---|---|
| Quadrant | BADHDUFLAG | Total packets | Discarded packets |
| A | 0 | 112 | 0 |
| B | 0 | 112 | 0 |
| C | 0 | 112 | 0 |
| D | 0 | 112 | 0 |
| Mode M9 | |||
|---|---|---|---|
| Quadrant | BADHDUFLAG | Total packets | Discarded packets |
| A | 0 | 30 | 0 |
| B | 0 | 30 | 0 |
| C | 0 | 30 | 0 |
| D | 0 | 31 | 0 |
| Mode M0 | |||
|---|---|---|---|
| Quadrant | BADHDUFLAG | Total packets | Discarded packets |
| A | 0 | 13488 | 3 |
| B | 0 | 11715 | 2 |
| C | 0 | 12721 | 2 |
| D | 0 | 15780 | 2 |
| Quadrant | Total seconds | Saturated seconds | Saturation percentage |
|---|---|---|---|
| A | 5491 | 65 | 1.183755% |
| B | 5491 | 61 | 1.110909% |
| C | 5491 | 100 | 1.821162% |
| D | 5491 | 296 | 5.390639% |
Noise dominated data is calculated using 1-second bins in cleaned event files. If a bin has >2000 counts, and if more than 50% of those come from <1% of pixels, then it is considered to be noise-dominated and hence unusable.
| Quadrant | # 1 sec bins | Bins with >0 counts | Bins with >2000 counts | High rate bins dominated by noise | Noise dominated (total time) | Noise dominated (detector-on time) | Marked lightcurve |
|---|---|---|---|---|---|---|---|
| A | 7073 | 5492 | 57 | 57 | 0.81% | 1.04% | 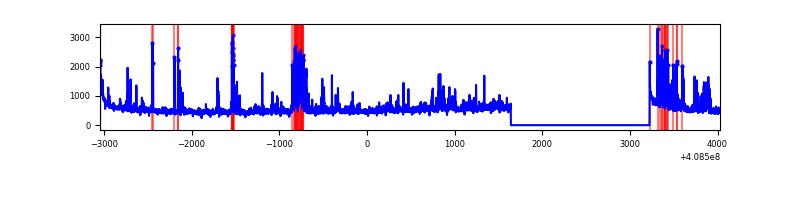 |
| B | 7073 | 5492 | 42 | 42 | 0.59% | 0.76% | 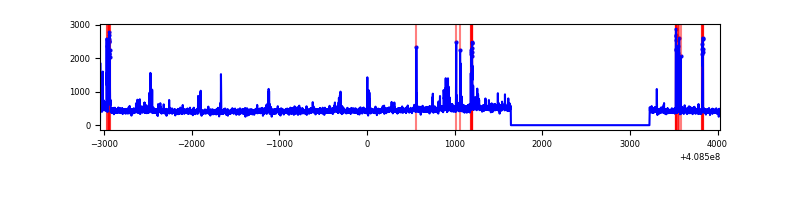 |
| C | 7073 | 5492 | 100 | 100 | 1.41% | 1.82% | 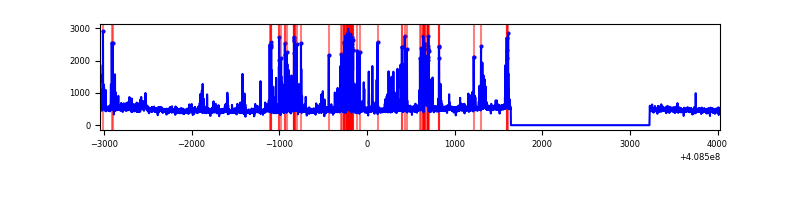 |
| D | 7073 | 5491 | 254 | 254 | 3.59% | 4.63% | 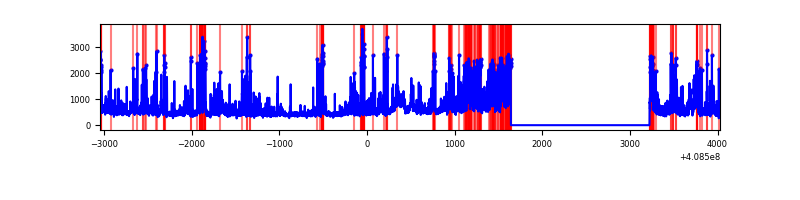 |
Top three noisy pixels from each quadrant. If the there are fewer than three noisy pixels in the level2.evt file, extra rows are filled as -1
| Pixel properties | Quadrant properties | ||||||
|---|---|---|---|---|---|---|---|
| Quadrant | DetID | PixID | Counts | Sigma | Mean | Median | Sigma |
| A | 6 | 10 | 434726 | 3559.23 | 598 | 584 | 122.0 |
| A | 10 | 83 | 424153 | 3472.55 | 598 | 584 | 122.0 |
| A | 13 | 248 | 128287 | 1046.95 | 598 | 584 | 122.0 |
| B | 5 | 172 | 252375 | 2180.76 | 596 | 580 | 115.5 |
| B | 0 | 230 | 23625 | 199.59 | 596 | 580 | 115.5 |
| B | 12 | 111 | 14479 | 120.38 | 596 | 580 | 115.5 |
| C | 14 | 254 | 590297 | 4315.28 | 584 | 587 | 136.7 |
| C | 15 | 214 | 226883 | 1655.95 | 584 | 587 | 136.7 |
| C | 10 | 20 | 8842 | 60.41 | 584 | 587 | 136.7 |
| D | 12 | 227 | 765307 | 5442.19 | 575 | 558 | 140.5 |
| D | 6 | 3 | 210499 | 1494.0 | 575 | 558 | 140.5 |
| D | 12 | 235 | 209515 | 1487.0 | 575 | 558 | 140.5 |
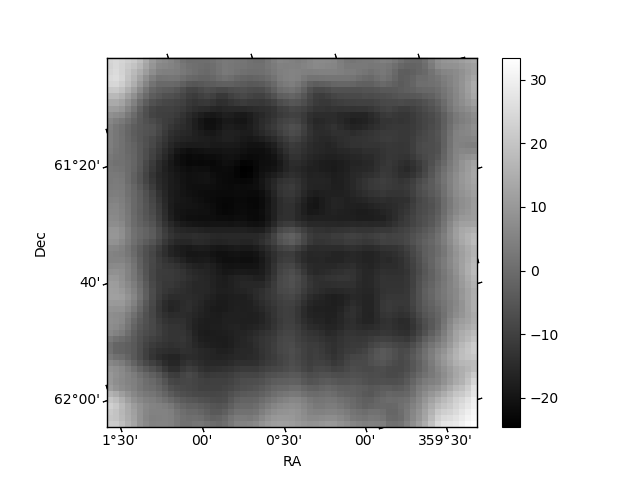
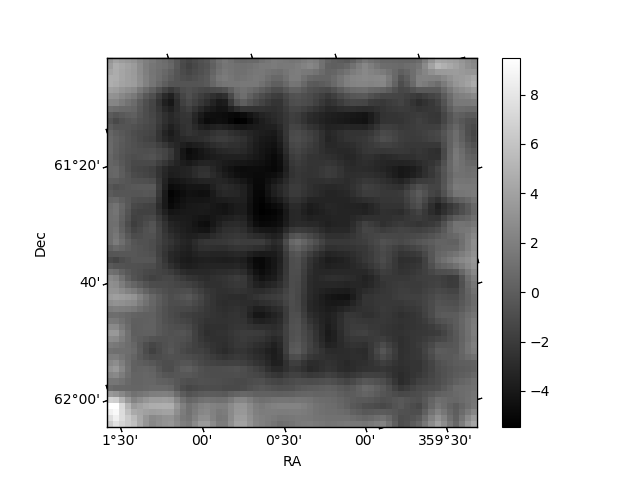
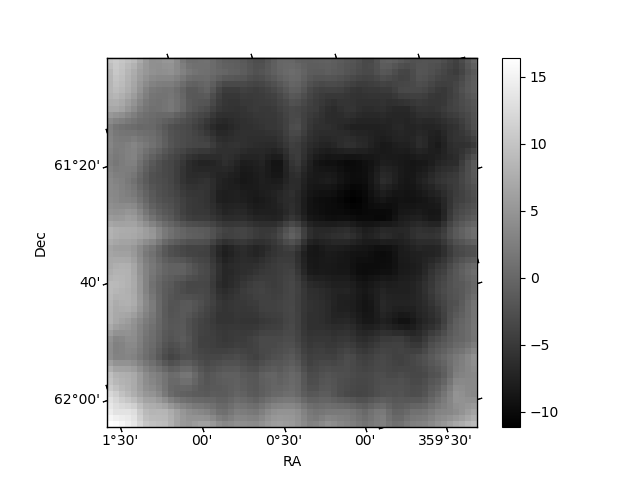
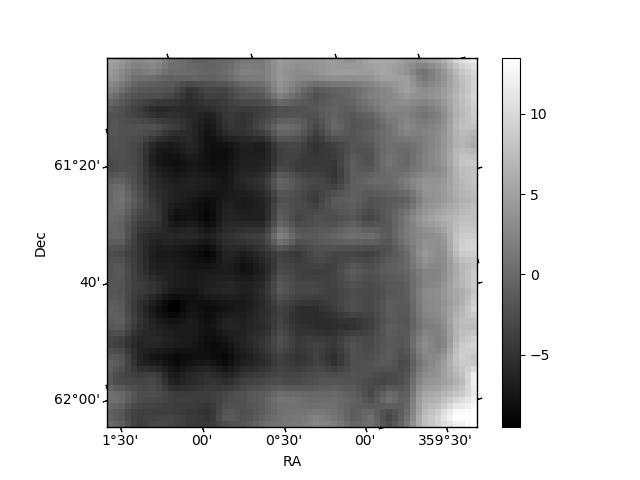
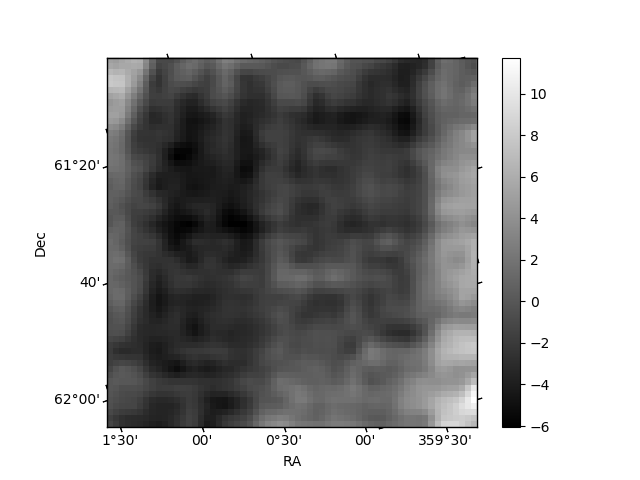
Histogram calculated using DETX and DETY for each event in the final _common_clean file
| Quadrant A | 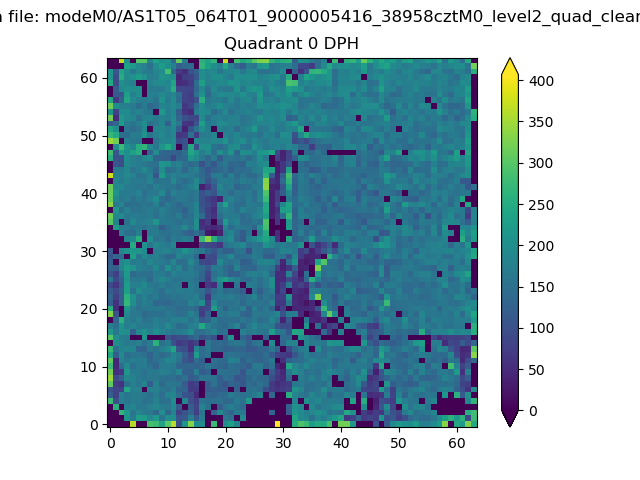 |
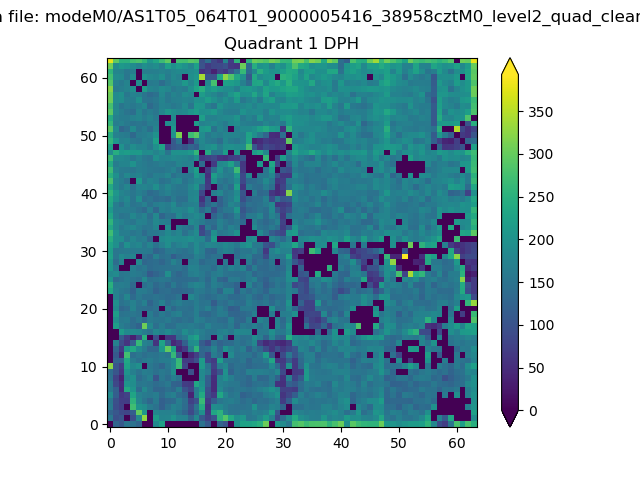 |
Quadrant B |
|---|---|---|---|
| Quadrant D | 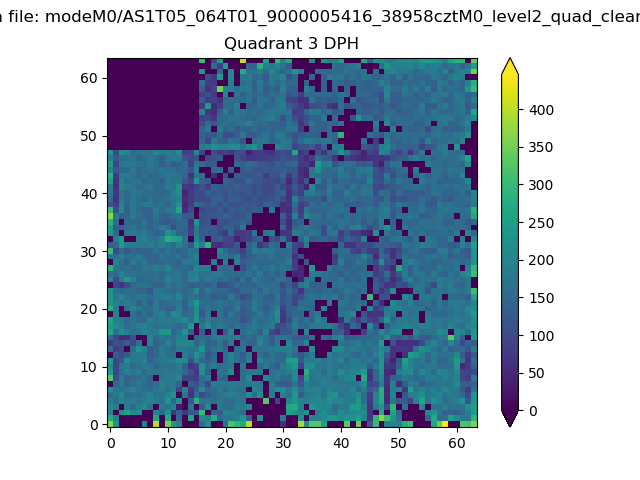 |
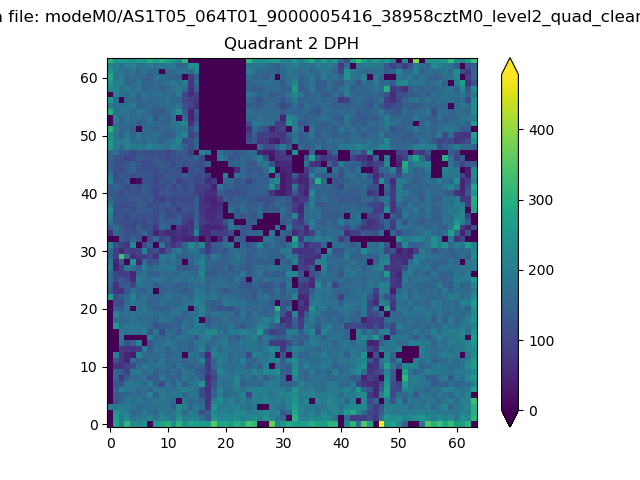 |
Quadrant C |
| Plot type | Count rate plots | Images |
|---|---|---|
| Comparison with Poisson distribution Blue bars denote a histogram of data divided into 1 sec bins. Red curve is a Poisson curve with rate = median count rate of data. |
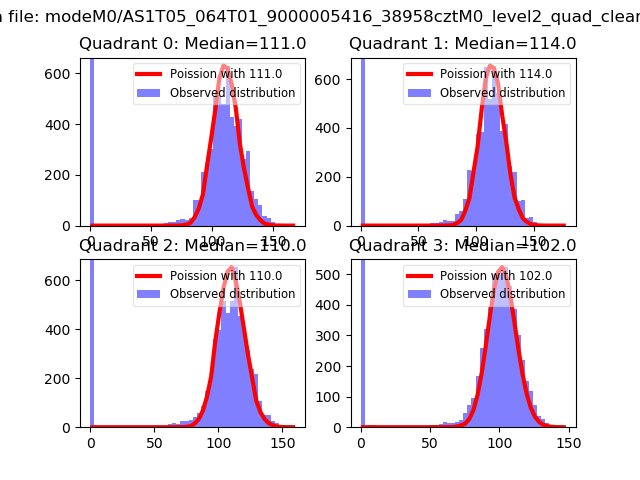 |
 |
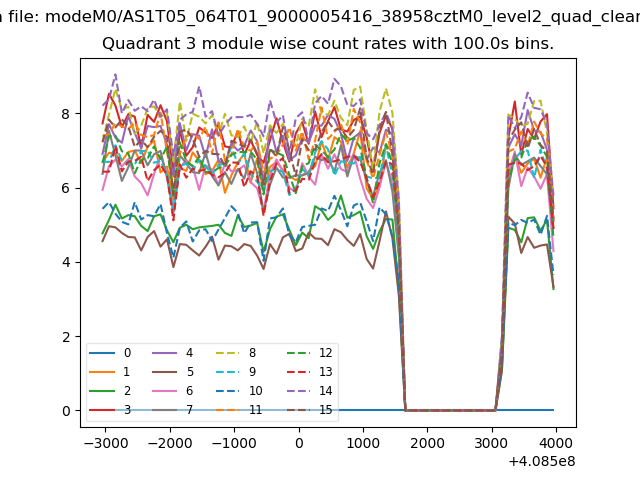
| Quadrant-wise count rates Data is divided into 100 sec bins |
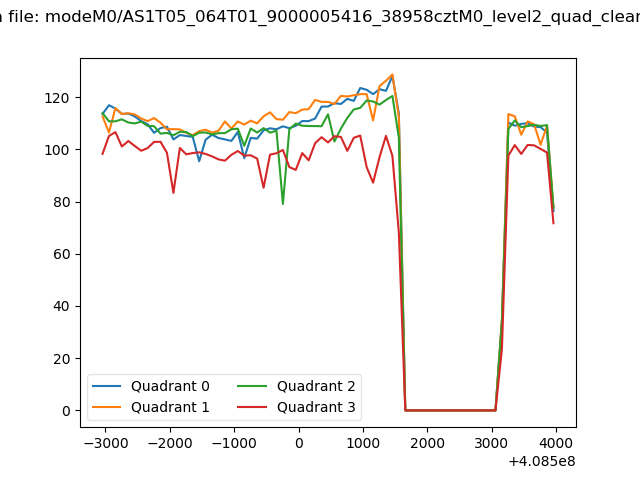 |
|
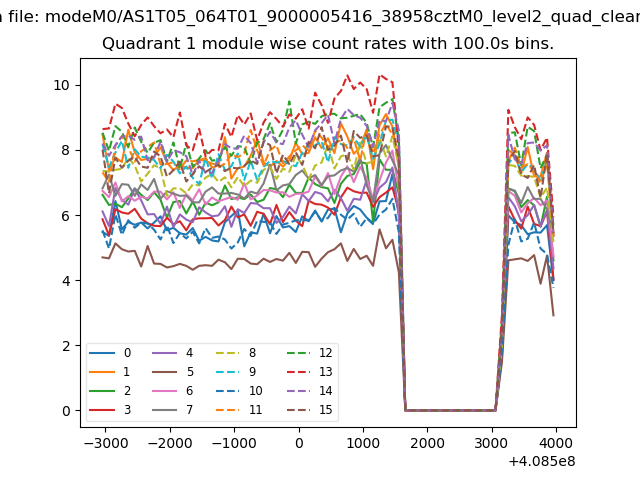
| Module-wise count rates for Quadrant A Data is divided into 100 sec bins |
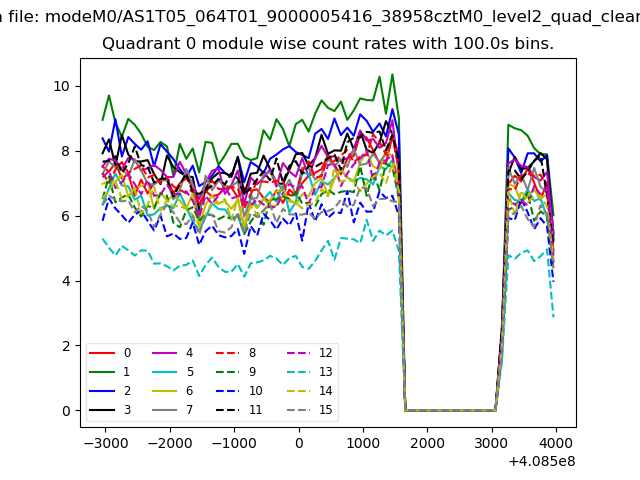 |
 |
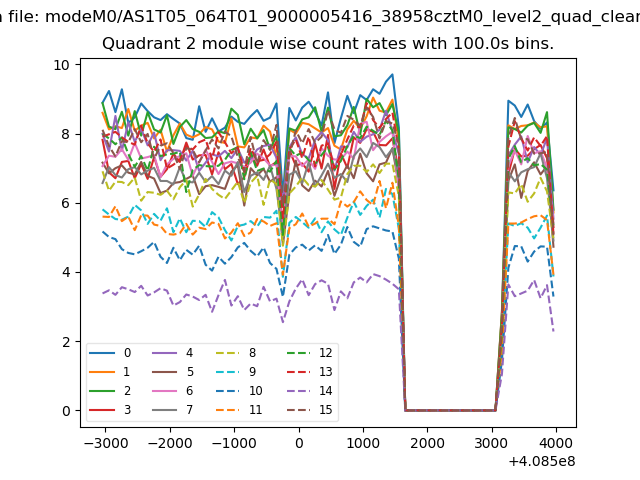
| Module-wise count rates for Quadrant B Data is divided into 100 sec bins |
 |
 |
| Module-wise count rates for Quadrant C Data is divided into 100 sec bins |
 |
 |
| Module-wise count rates for Quadrant D Data is divided into 100 sec bins |
 |
 |
| Parameter | Plot |
|---|---|
| CZT HV Monitor | 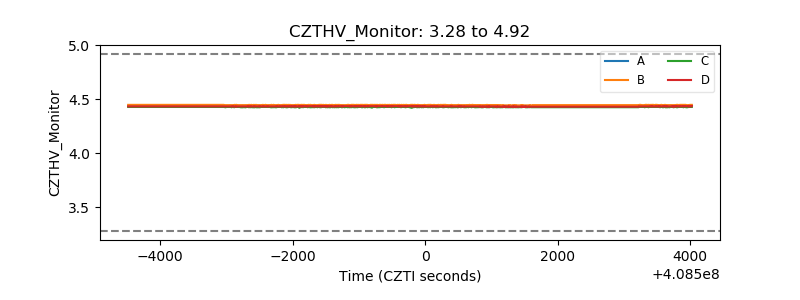 |
| D_VDD | 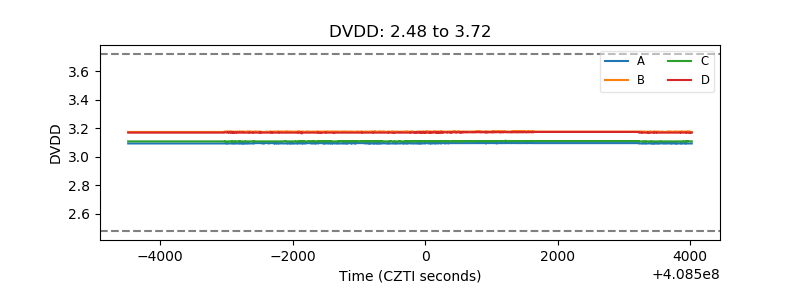 |
| Temperature 1 | 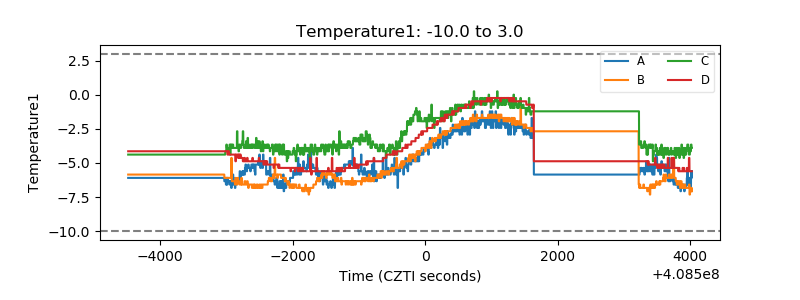 |
| Veto HV Monitor | 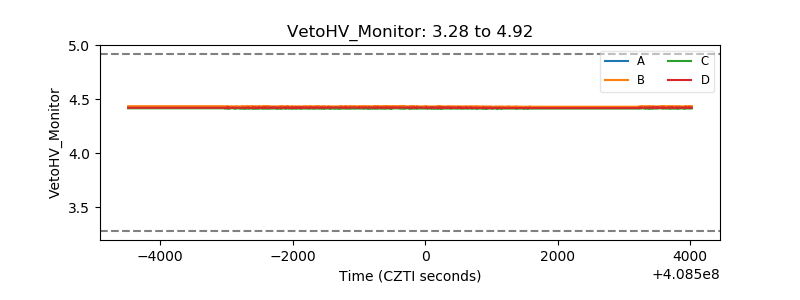 |
| Veto LLD | 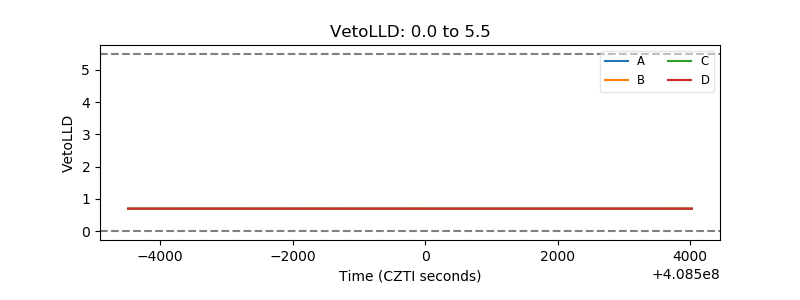 |
| Alpha Counter | 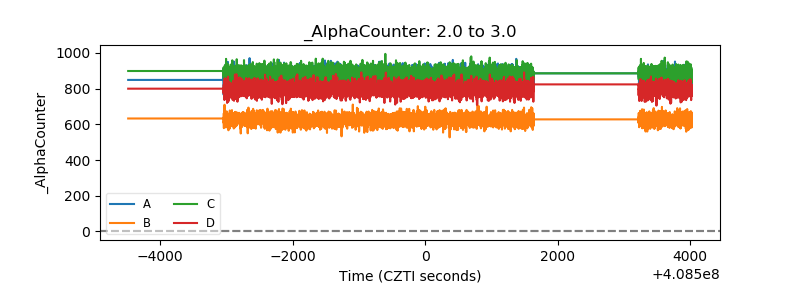 |
| _CPM_Rate | 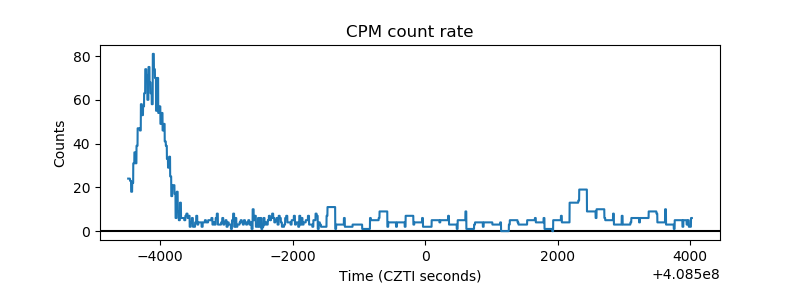 |
| CZT Counter | 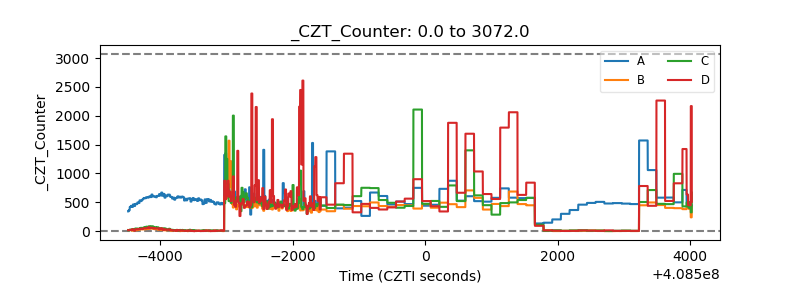 |
| +2.5 Volts monitor | 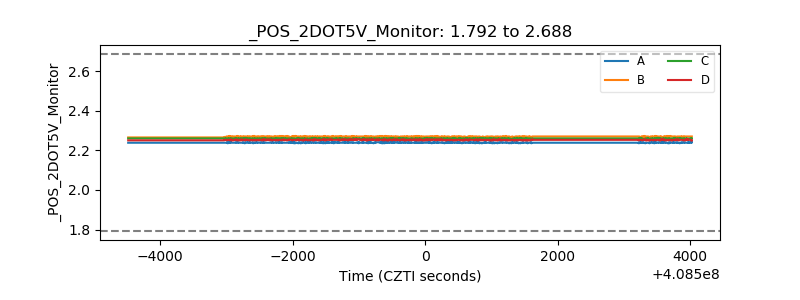 |
| +5 Volts monitor | 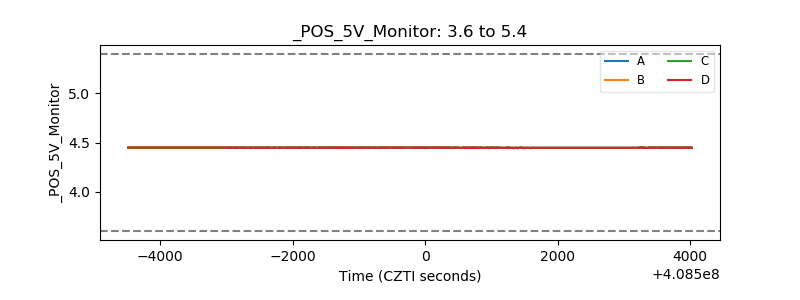 |
| _ROLL_ROT | 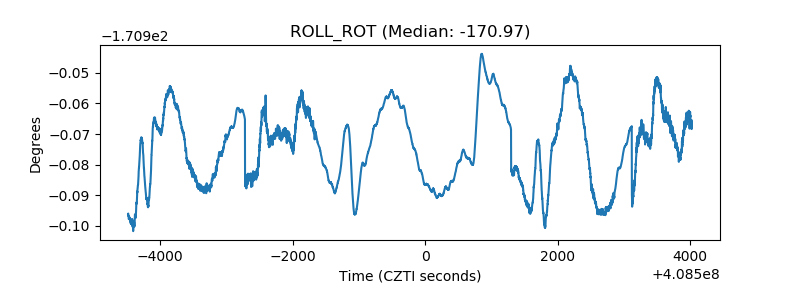 |
| _Roll_DEC | 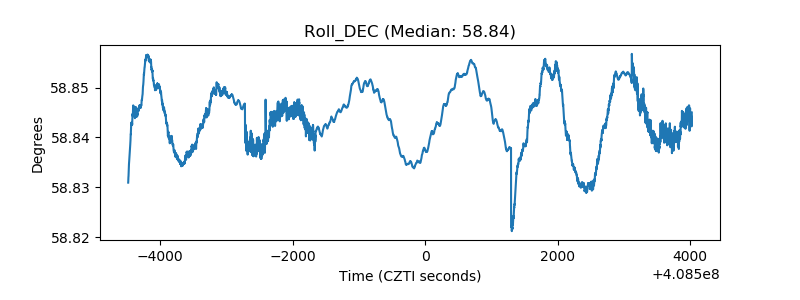 |
| _Roll_RA | 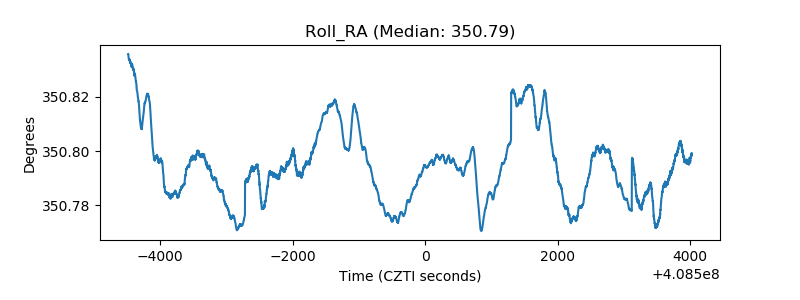 |
| Veto Counter | 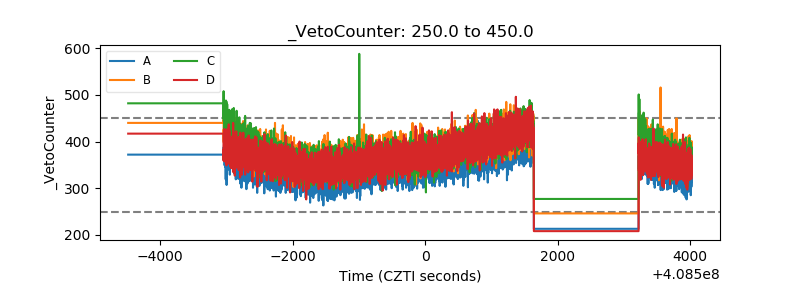 |