| Param | Original file | Final file |
|---|---|---|
| Filename | modeM0/AS1T05_064T01_9000005416_38959cztM0_level2.fits | modeM0/AS1T05_064T01_9000005416_38959cztM0_level2_quad_clean.evt |
| Size (bytes) | 466,793,280 | 103,841,280 |
| Size | 445.2 MB | 99.0 MB |
| Events in quadrant A | 3,688,235 | 701,677 |
| Events in quadrant B | 3,094,889 | 718,197 |
| Events in quadrant C | 4,298,190 | 670,553 |
| Events in quadrant D | 5,703,172 | 609,021 |
| Mode SS | |||
|---|---|---|---|
| Quadrant | BADHDUFLAG | Total packets | Discarded packets |
| A | 0 | 132 | 0 |
| B | 0 | 132 | 0 |
| C | 0 | 132 | 0 |
| D | 0 | 132 | 0 |
| Mode M9 | |||
|---|---|---|---|
| Quadrant | BADHDUFLAG | Total packets | Discarded packets |
| A | 0 | 29 | 0 |
| B | 0 | 29 | 0 |
| C | 0 | 29 | 0 |
| D | 0 | 29 | 0 |
| Mode M0 | |||
|---|---|---|---|
| Quadrant | BADHDUFLAG | Total packets | Discarded packets |
| A | 0 | 14920 | 3 |
| B | 0 | 13507 | 2 |
| C | 0 | 16819 | 2 |
| D | 0 | 21428 | 2 |
| Quadrant | Total seconds | Saturated seconds | Saturation percentage |
|---|---|---|---|
| A | 6368 | 70 | 1.099246% |
| B | 6368 | 51 | 0.800879% |
| C | 6368 | 347 | 5.449121% |
| D | 6368 | 546 | 8.574121% |
Noise dominated data is calculated using 1-second bins in cleaned event files. If a bin has >2000 counts, and if more than 50% of those come from <1% of pixels, then it is considered to be noise-dominated and hence unusable.
| Quadrant | # 1 sec bins | Bins with >0 counts | Bins with >2000 counts | High rate bins dominated by noise | Noise dominated (total time) | Noise dominated (detector-on time) | Marked lightcurve |
|---|---|---|---|---|---|---|---|
| A | 9293 | 6370 | 60 | 60 | 0.65% | 0.94% | 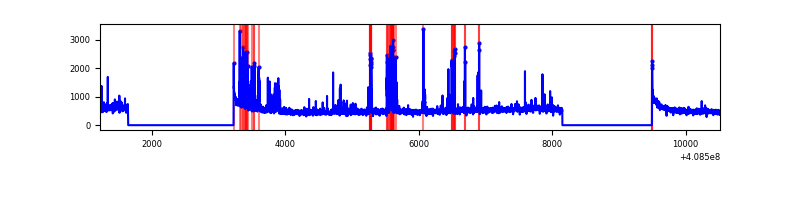 |
| B | 9293 | 6370 | 35 | 35 | 0.38% | 0.55% | 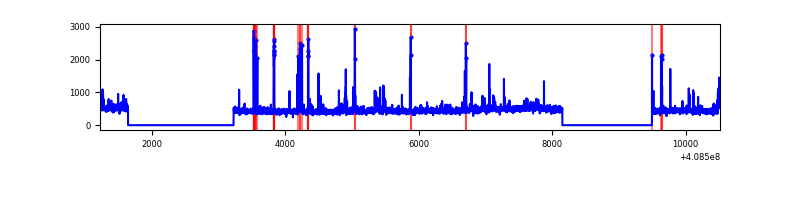 |
| C | 9293 | 6370 | 305 | 305 | 3.28% | 4.79% | 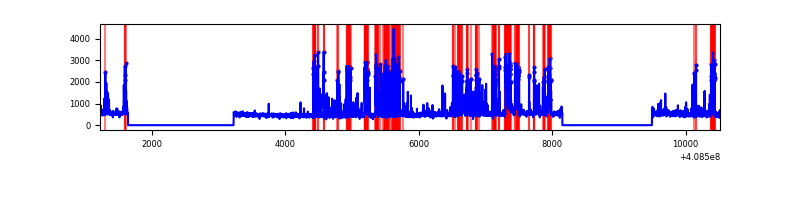 |
| D | 9293 | 6369 | 525 | 525 | 5.65% | 8.24% | 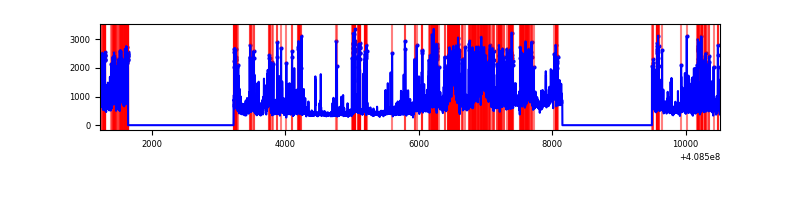 |
Top three noisy pixels from each quadrant. If the there are fewer than three noisy pixels in the level2.evt file, extra rows are filled as -1
| Pixel properties | Quadrant properties | ||||||
|---|---|---|---|---|---|---|---|
| Quadrant | DetID | PixID | Counts | Sigma | Mean | Median | Sigma |
| A | 10 | 83 | 478817 | 3351.84 | 705 | 691 | 142.6 |
| A | 6 | 10 | 195795 | 1367.75 | 705 | 691 | 142.6 |
| A | 13 | 248 | 191624 | 1338.51 | 705 | 691 | 142.6 |
| B | 5 | 172 | 254830 | 1881.55 | 703 | 684 | 135.1 |
| B | 0 | 230 | 46010 | 335.57 | 703 | 684 | 135.1 |
| B | 5 | 184 | 19254 | 137.48 | 703 | 684 | 135.1 |
| C | 14 | 254 | 1371260 | 8675.4 | 676 | 680 | 158.0 |
| C | 15 | 214 | 260627 | 1645.39 | 676 | 680 | 158.0 |
| C | 0 | 207 | 8832 | 51.6 | 676 | 680 | 158.0 |
| D | 12 | 227 | 1632757 | 10034.98 | 670 | 651 | 162.6 |
| D | 12 | 235 | 763044 | 4687.56 | 670 | 651 | 162.6 |
| D | 2 | 249 | 282955 | 1735.74 | 670 | 651 | 162.6 |
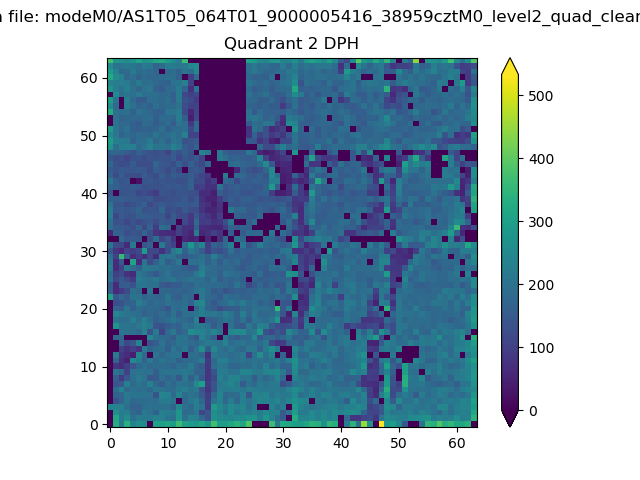
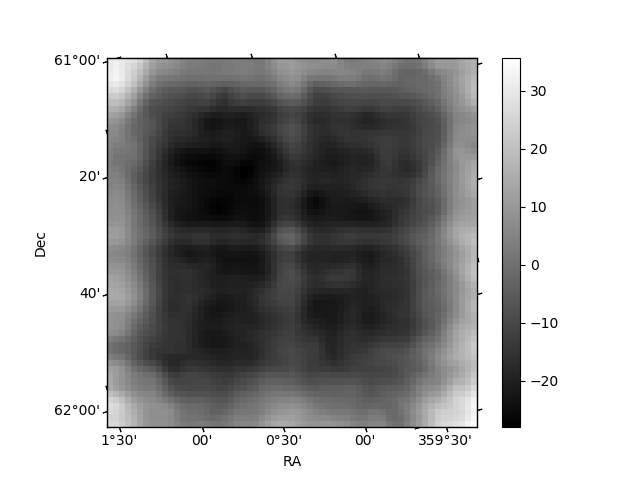
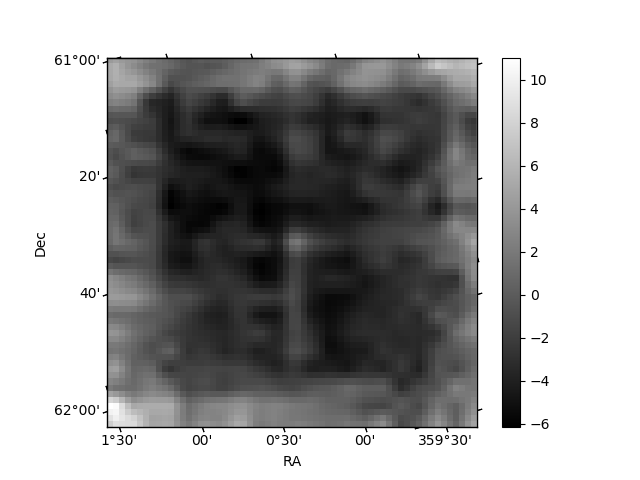
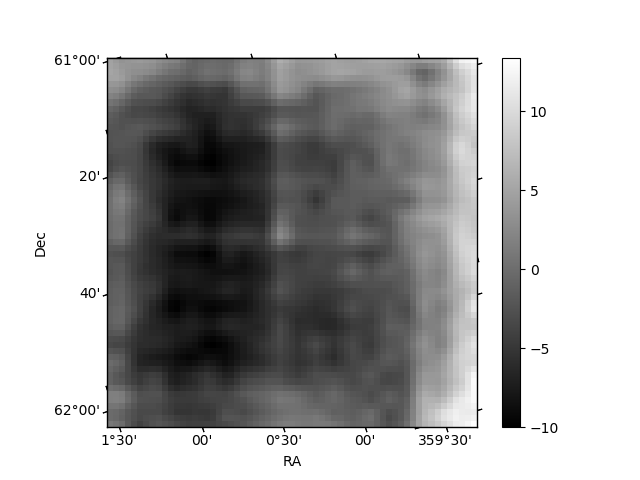
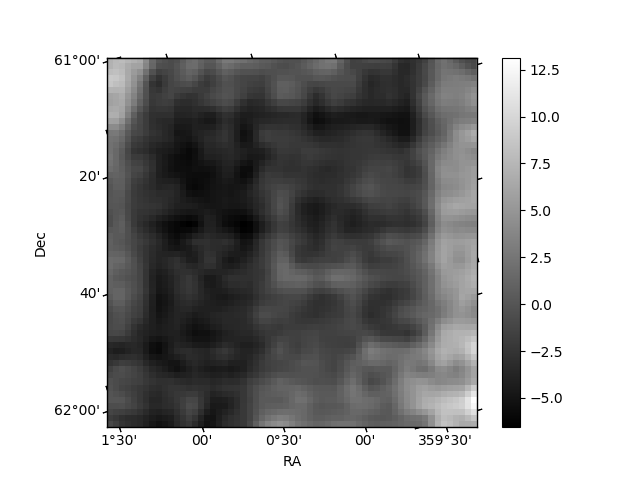
Histogram calculated using DETX and DETY for each event in the final _common_clean file
| Quadrant A | 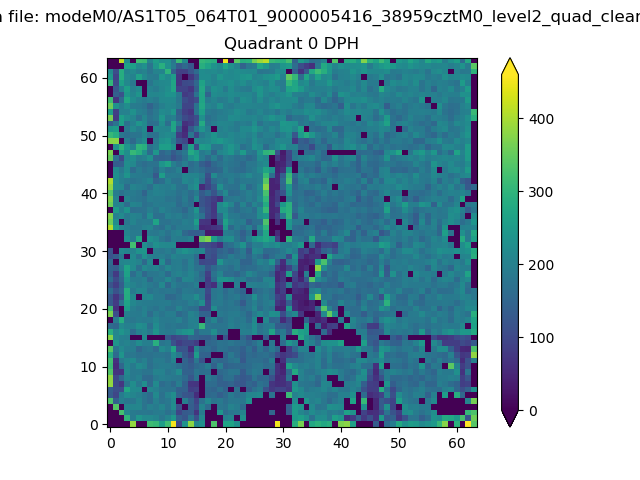 |
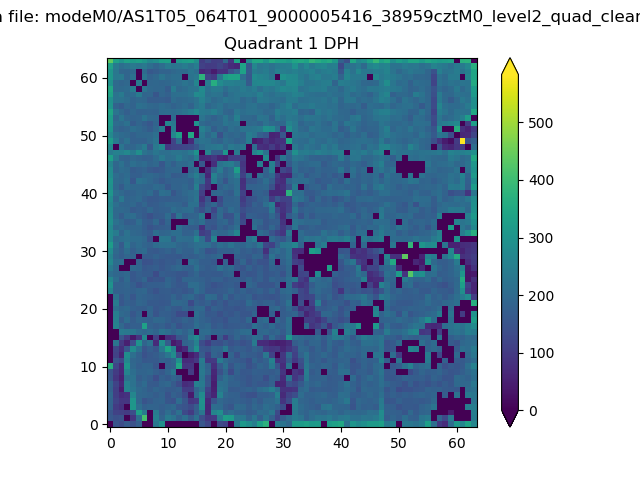 |
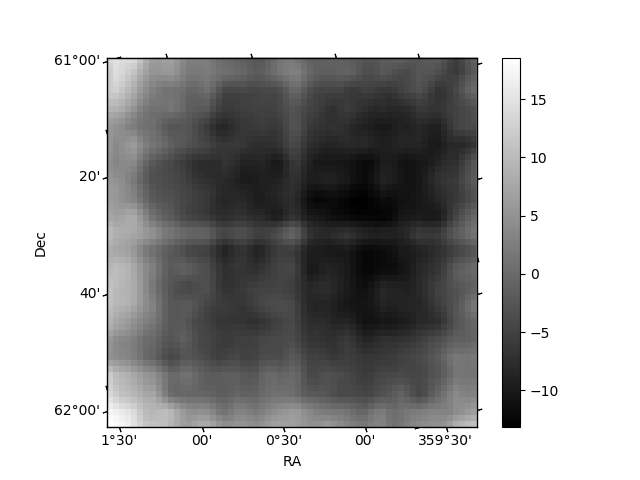
Quadrant B |
|---|---|---|---|
| Quadrant D | 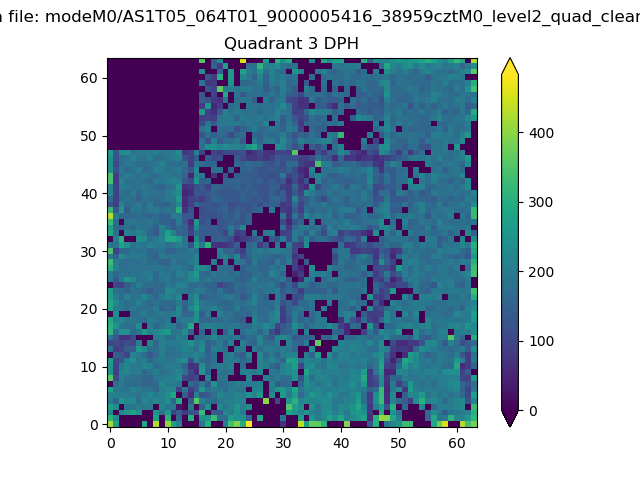 |
 |
Quadrant C |
| Plot type | Count rate plots | Images |
|---|---|---|
| Comparison with Poisson distribution Blue bars denote a histogram of data divided into 1 sec bins. Red curve is a Poisson curve with rate = median count rate of data. |
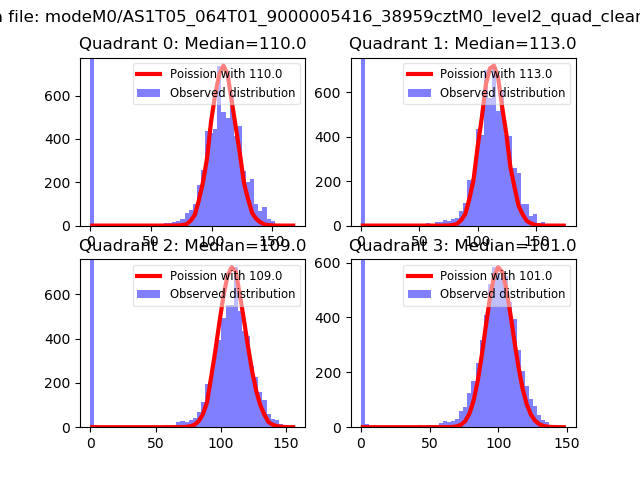 |
 |
| Quadrant-wise count rates Data is divided into 100 sec bins |
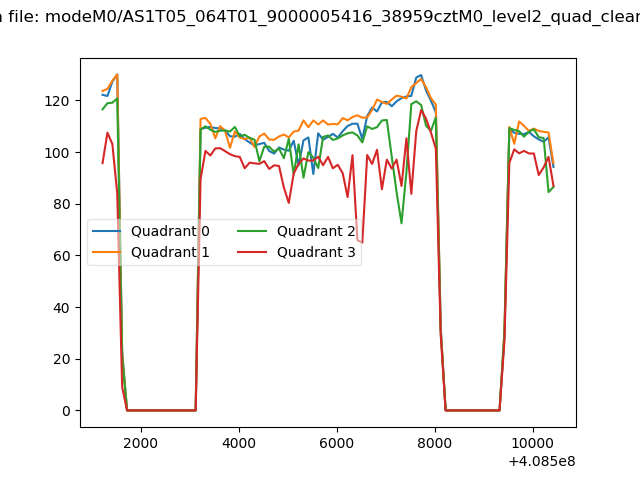 |
|
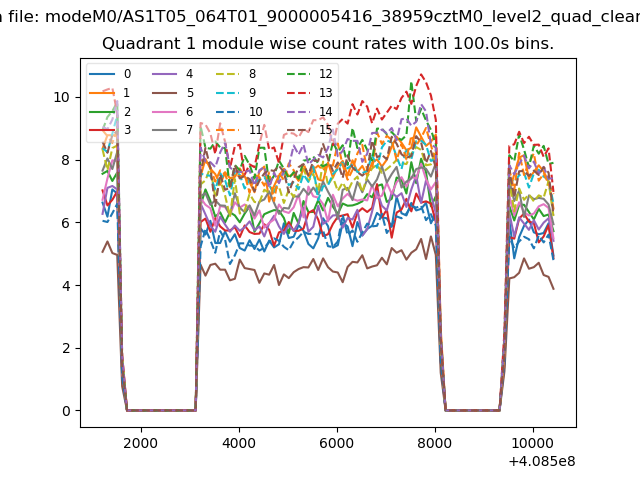
| Module-wise count rates for Quadrant A Data is divided into 100 sec bins |
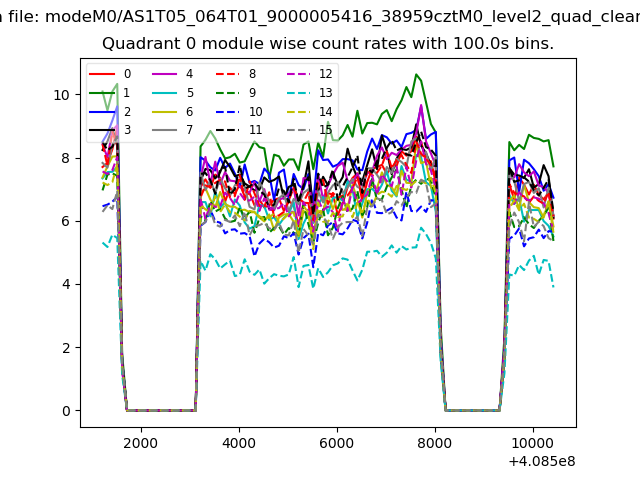 |
 |
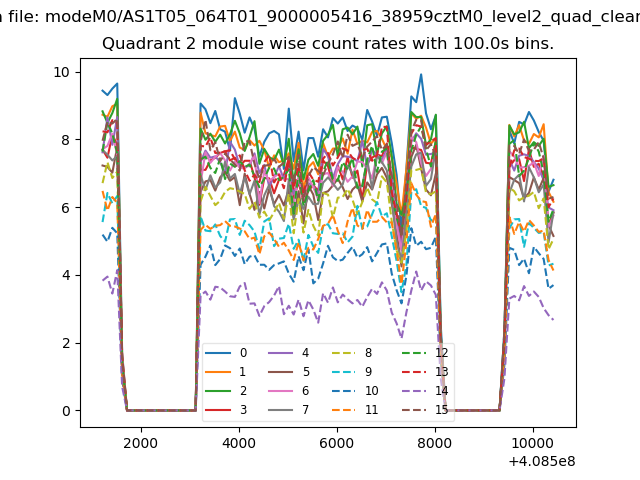
| Module-wise count rates for Quadrant B Data is divided into 100 sec bins |
 |
 |
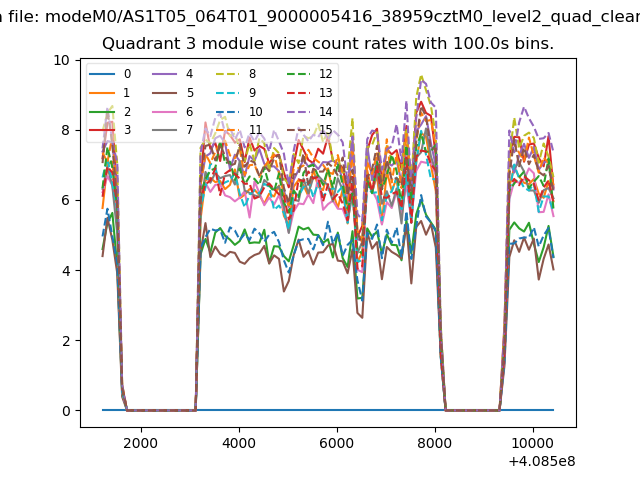
| Module-wise count rates for Quadrant C Data is divided into 100 sec bins |
 |
 |
| Module-wise count rates for Quadrant D Data is divided into 100 sec bins |
 |
 |
| Parameter | Plot |
|---|---|
| CZT HV Monitor | 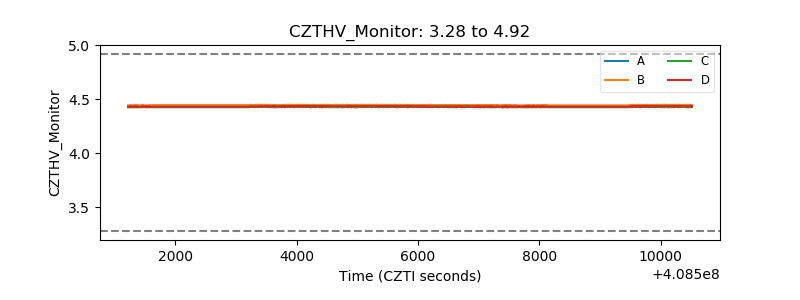 |
| D_VDD | 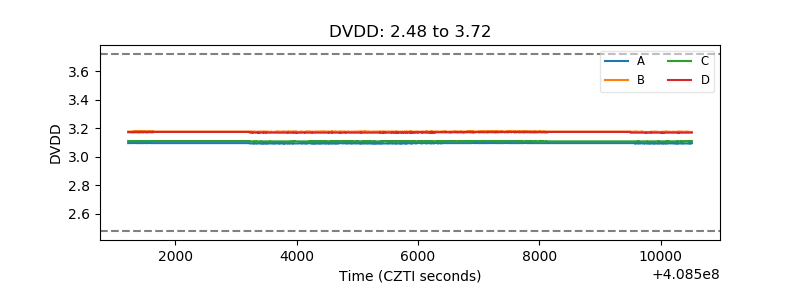 |
| Temperature 1 | 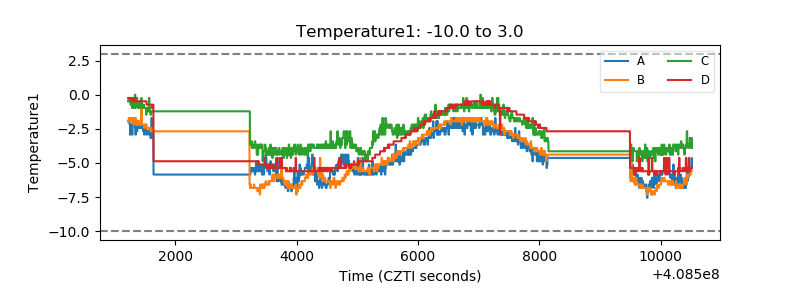 |
| Veto HV Monitor | 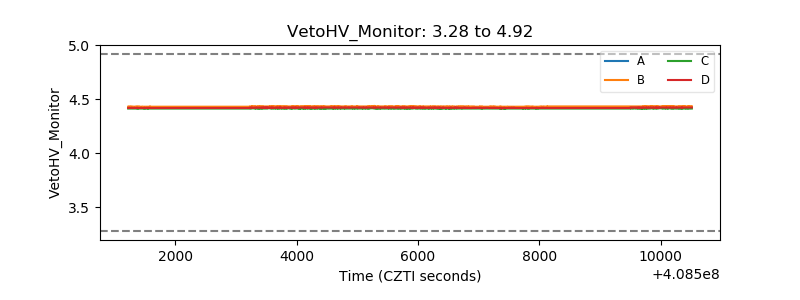 |
| Veto LLD | 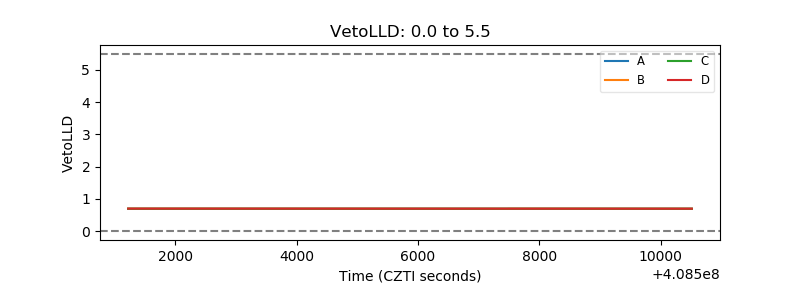 |
| Alpha Counter | 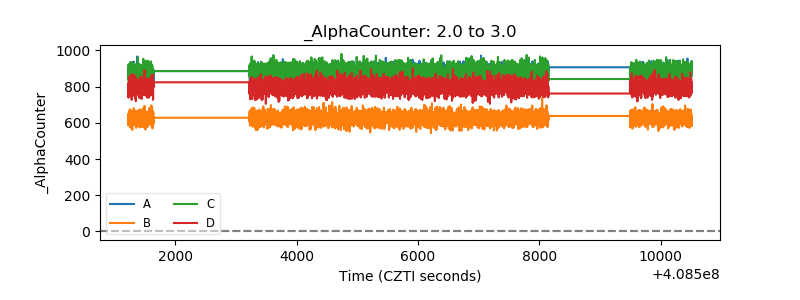 |
| _CPM_Rate | 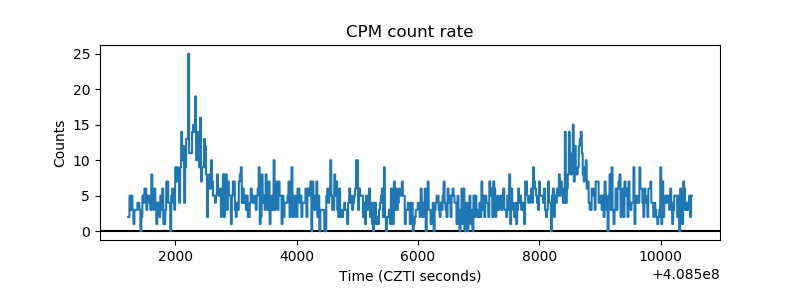 |
| CZT Counter | 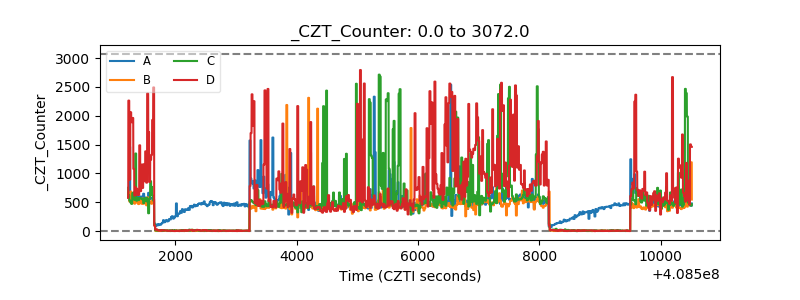 |
| +2.5 Volts monitor | 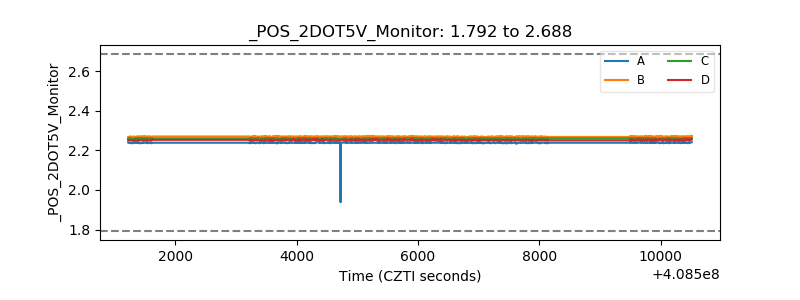 |
| +5 Volts monitor | 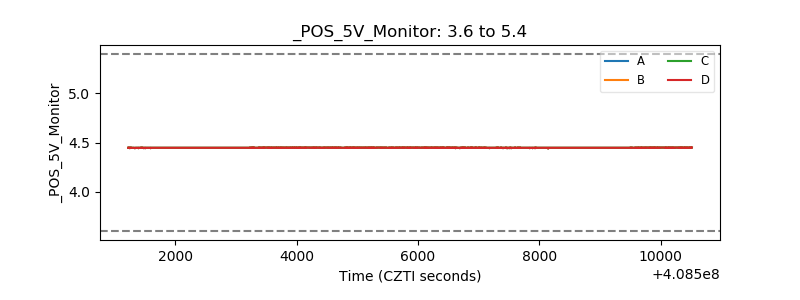 |
| _ROLL_ROT | 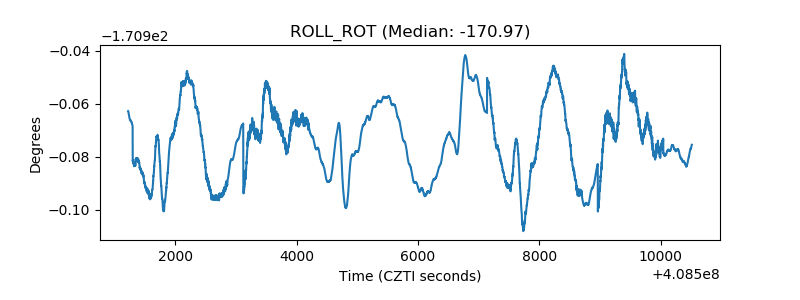 |
| _Roll_DEC | 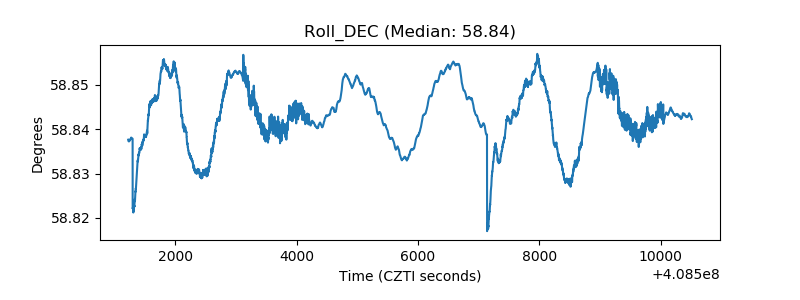 |
| _Roll_RA | 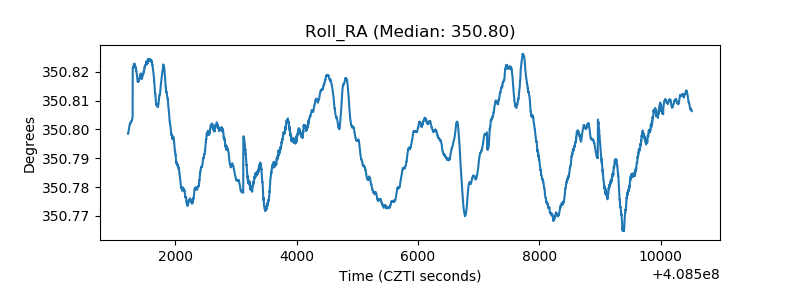 |
| Veto Counter | 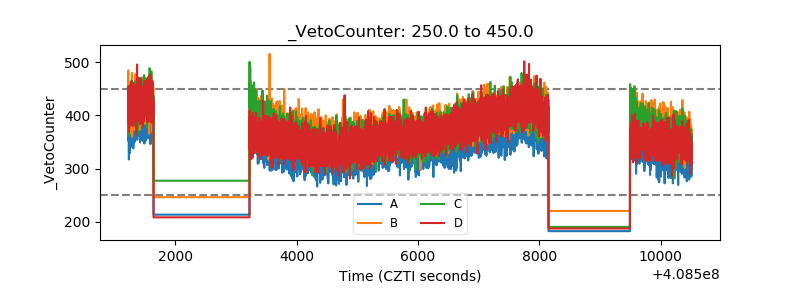 |