| Param | Original file | Final file |
|---|---|---|
| Filename | modeM0/AS1T05_064T01_9000005416_38960cztM0_level2.fits | modeM0/AS1T05_064T01_9000005416_38960cztM0_level2_quad_clean.evt |
| Size (bytes) | 409,199,040 | 98,847,360 |
| Size | 390.2 MB | 94.3 MB |
| Events in quadrant A | 3,229,481 | 656,625 |
| Events in quadrant B | 2,888,557 | 674,522 |
| Events in quadrant C | 3,552,191 | 648,448 |
| Events in quadrant D | 5,008,125 | 591,683 |
| Mode SS | |||
|---|---|---|---|
| Quadrant | BADHDUFLAG | Total packets | Discarded packets |
| A | 0 | 126 | 0 |
| B | 0 | 126 | 0 |
| C | 0 | 126 | 0 |
| D | 0 | 126 | 0 |
| Mode M9 | |||
|---|---|---|---|
| Quadrant | BADHDUFLAG | Total packets | Discarded packets |
| A | 0 | 26 | 0 |
| B | 0 | 26 | 0 |
| C | 0 | 26 | 0 |
| D | 0 | 26 | 0 |
| Mode M0 | |||
|---|---|---|---|
| Quadrant | BADHDUFLAG | Total packets | Discarded packets |
| A | 0 | 13178 | 3 |
| B | 0 | 12667 | 2 |
| C | 0 | 14273 | 2 |
| D | 0 | 19069 | 2 |
| Quadrant | Total seconds | Saturated seconds | Saturation percentage |
|---|---|---|---|
| A | 6033 | 52 | 0.861926% |
| B | 6033 | 34 | 0.563567% |
| C | 6033 | 111 | 1.839881% |
| D | 6033 | 276 | 4.574838% |
Noise dominated data is calculated using 1-second bins in cleaned event files. If a bin has >2000 counts, and if more than 50% of those come from <1% of pixels, then it is considered to be noise-dominated and hence unusable.
| Quadrant | # 1 sec bins | Bins with >0 counts | Bins with >2000 counts | High rate bins dominated by noise | Noise dominated (total time) | Noise dominated (detector-on time) | Marked lightcurve |
|---|---|---|---|---|---|---|---|
| A | 8689 | 6035 | 48 | 48 | 0.55% | 0.80% | 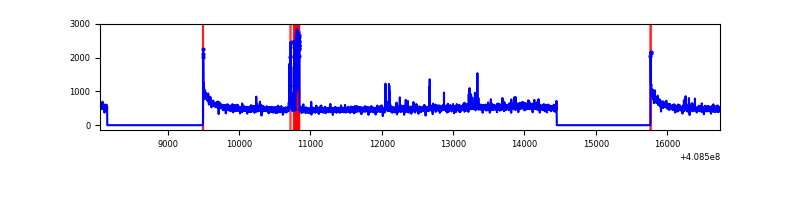 |
| B | 8689 | 6035 | 23 | 23 | 0.26% | 0.38% | 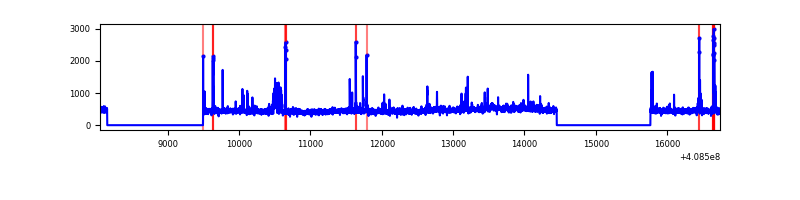 |
| C | 8689 | 6035 | 112 | 112 | 1.29% | 1.86% | 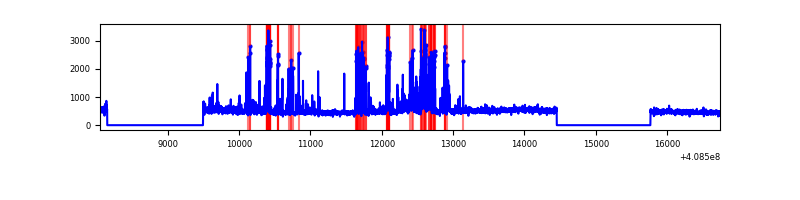 |
| D | 8689 | 6035 | 291 | 291 | 3.35% | 4.82% | 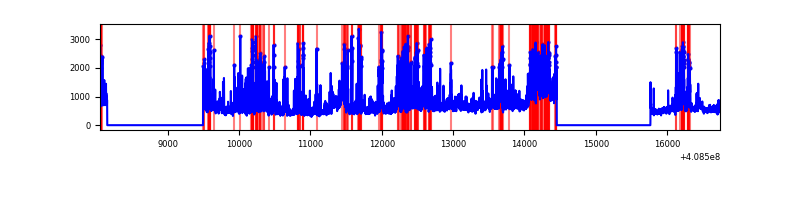 |
Top three noisy pixels from each quadrant. If the there are fewer than three noisy pixels in the level2.evt file, extra rows are filled as -1
| Pixel properties | Quadrant properties | ||||||
|---|---|---|---|---|---|---|---|
| Quadrant | DetID | PixID | Counts | Sigma | Mean | Median | Sigma |
| A | 10 | 83 | 457000 | 3379.11 | 666 | 651 | 135.1 |
| A | 13 | 248 | 183412 | 1353.28 | 666 | 651 | 135.1 |
| A | 13 | 254 | 9931 | 68.72 | 666 | 651 | 135.1 |
| B | 5 | 172 | 129123 | 997.9 | 664 | 645 | 128.7 |
| B | 5 | 184 | 57168 | 439.02 | 664 | 645 | 128.7 |
| B | 0 | 230 | 49449 | 379.06 | 664 | 645 | 128.7 |
| C | 14 | 254 | 721399 | 4747.61 | 650 | 653 | 151.8 |
| C | 15 | 214 | 249012 | 1635.96 | 650 | 653 | 151.8 |
| C | 1 | 128 | 17010 | 107.74 | 650 | 653 | 151.8 |
| D | 12 | 235 | 1196176 | 7655.55 | 643 | 625 | 156.2 |
| D | 12 | 227 | 683310 | 4371.48 | 643 | 625 | 156.2 |
| D | 2 | 249 | 244523 | 1561.77 | 643 | 625 | 156.2 |
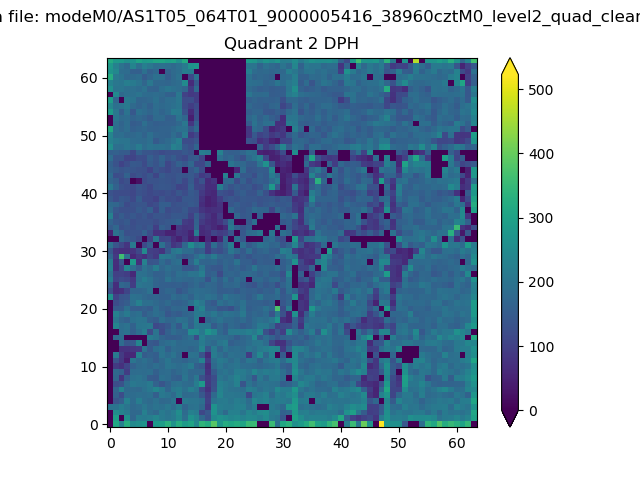
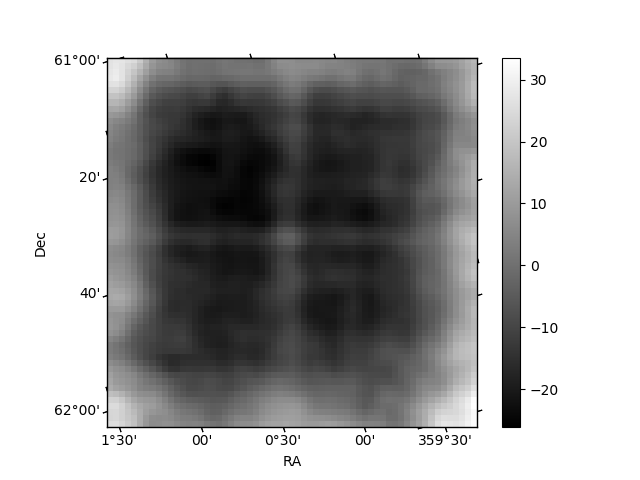
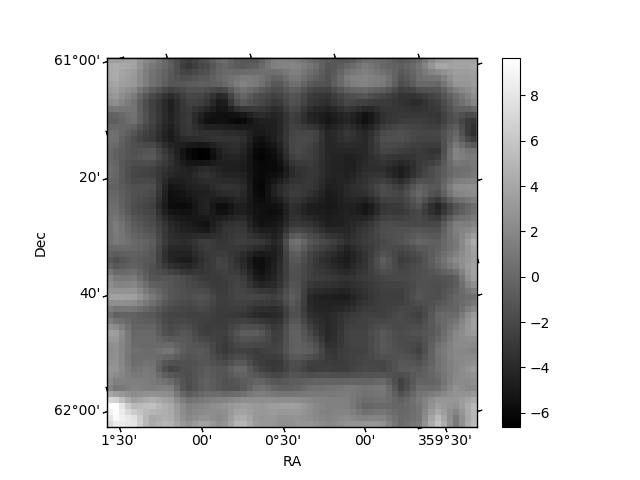
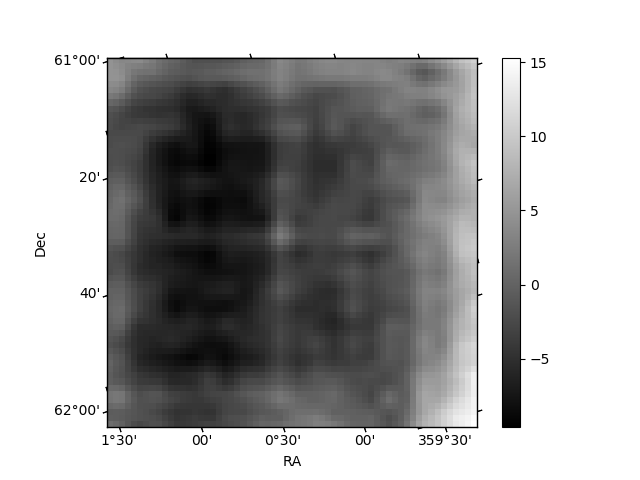
Histogram calculated using DETX and DETY for each event in the final _common_clean file
| Quadrant A | 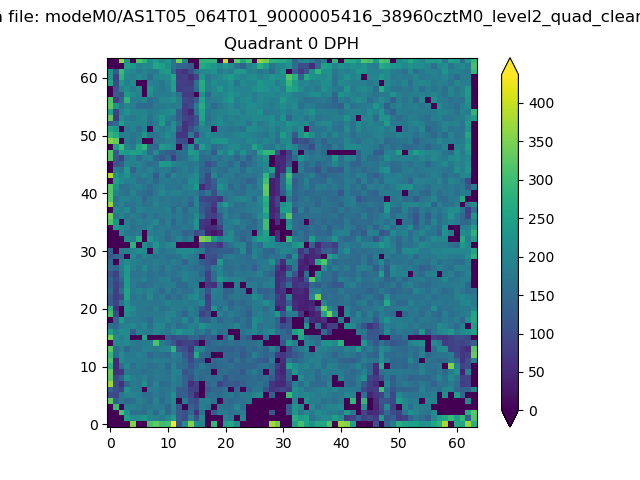 |
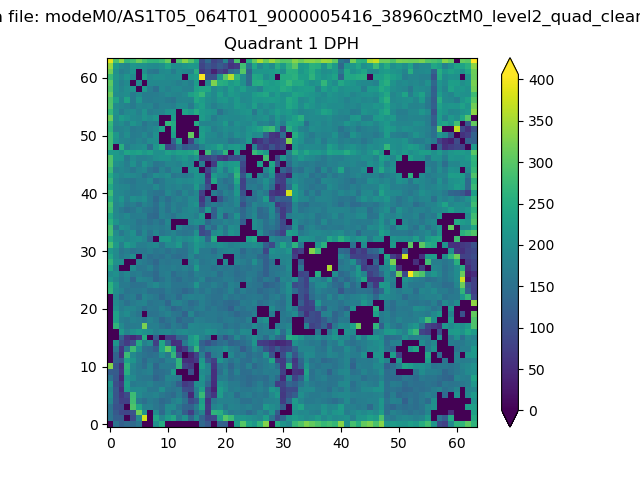 |
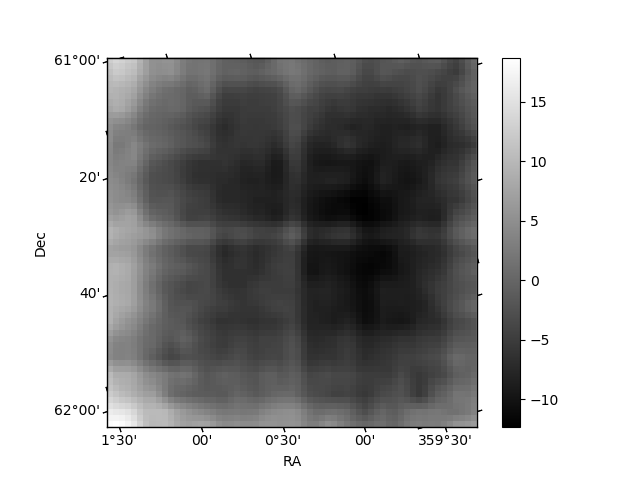
Quadrant B |
|---|---|---|---|
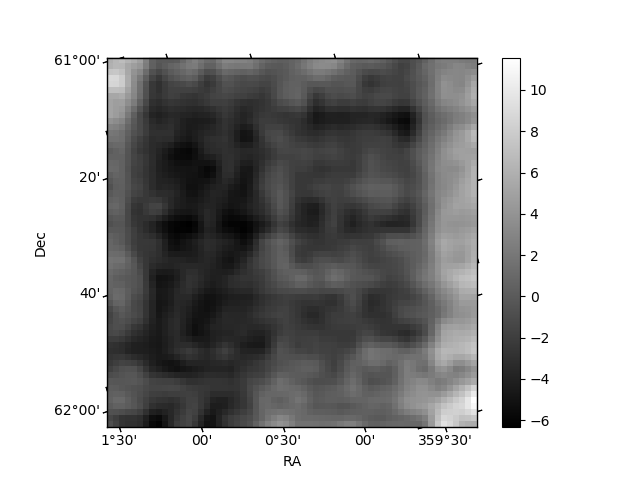
| Quadrant D | 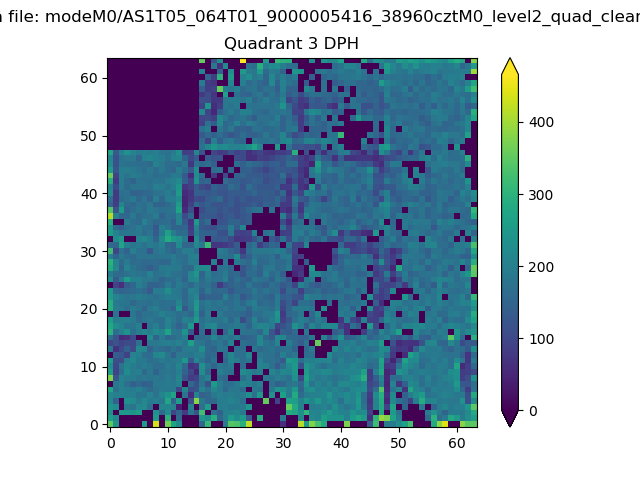 |
 |
Quadrant C |
| Plot type | Count rate plots | Images |
|---|---|---|
| Comparison with Poisson distribution Blue bars denote a histogram of data divided into 1 sec bins. Red curve is a Poisson curve with rate = median count rate of data. |
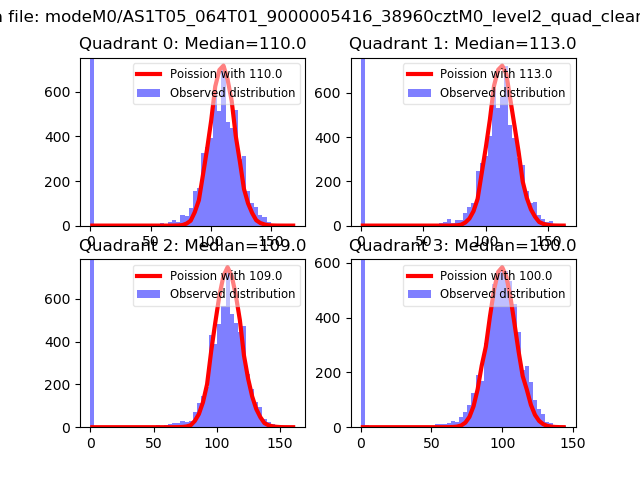 |
 |
| Quadrant-wise count rates Data is divided into 100 sec bins |
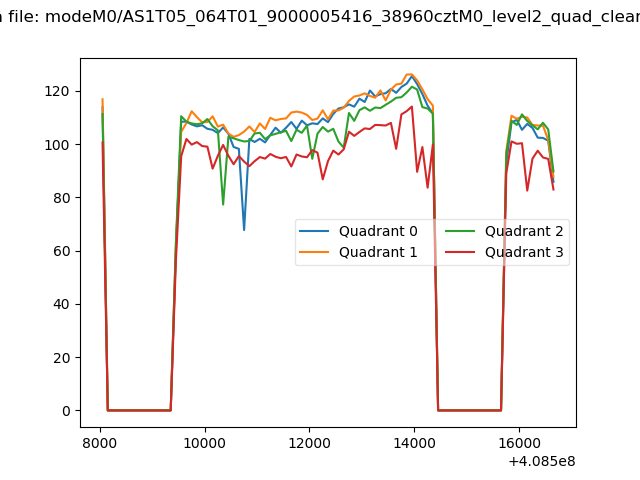 |
|
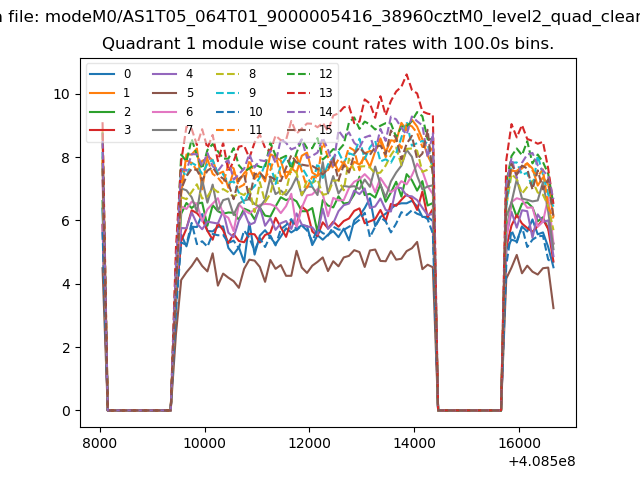
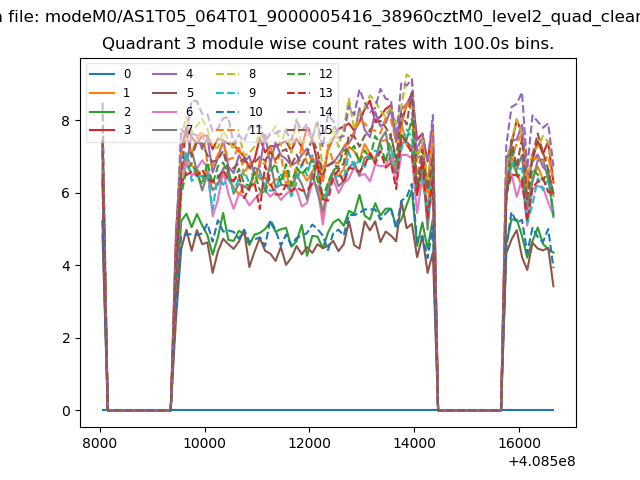
| Module-wise count rates for Quadrant A Data is divided into 100 sec bins |
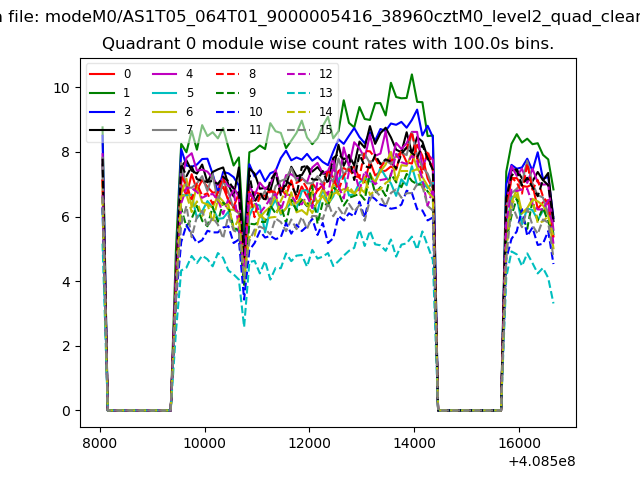 |
 |
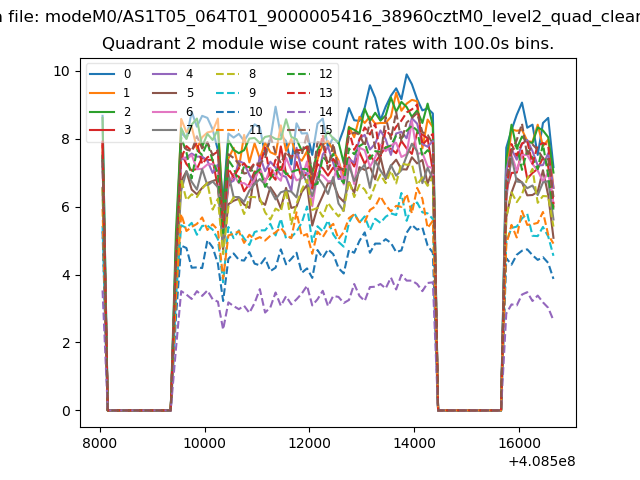
| Module-wise count rates for Quadrant B Data is divided into 100 sec bins |
 |
 |
| Module-wise count rates for Quadrant C Data is divided into 100 sec bins |
 |
 |
| Module-wise count rates for Quadrant D Data is divided into 100 sec bins |
 |
 |
| Parameter | Plot |
|---|---|
| CZT HV Monitor | 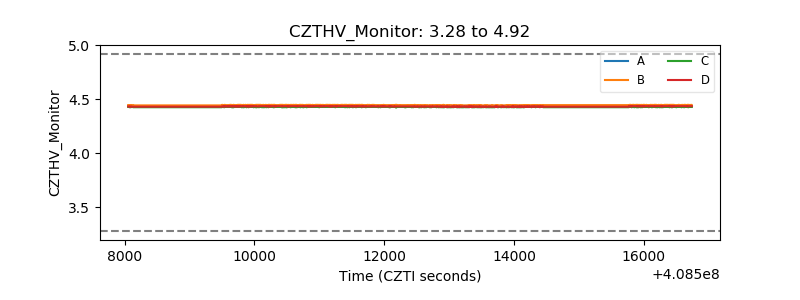 |
| D_VDD | 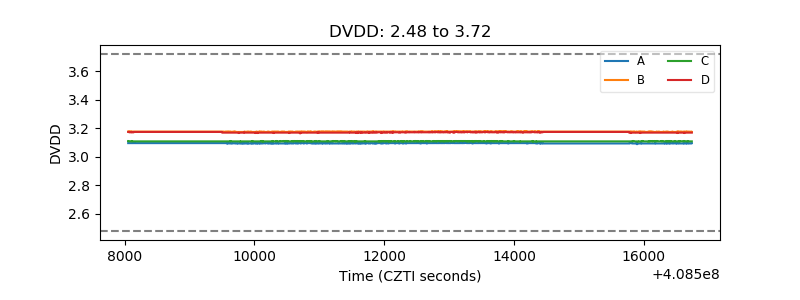 |
| Temperature 1 | 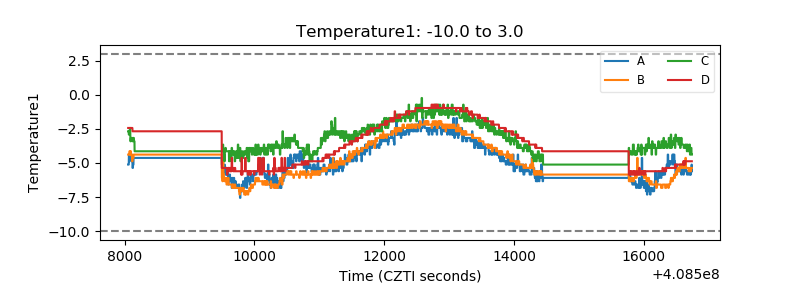 |
| Veto HV Monitor | 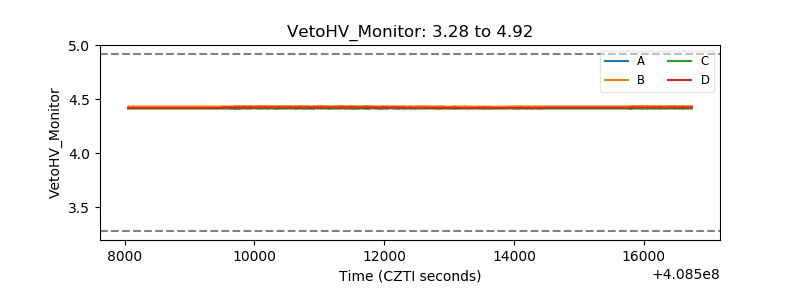 |
| Veto LLD | 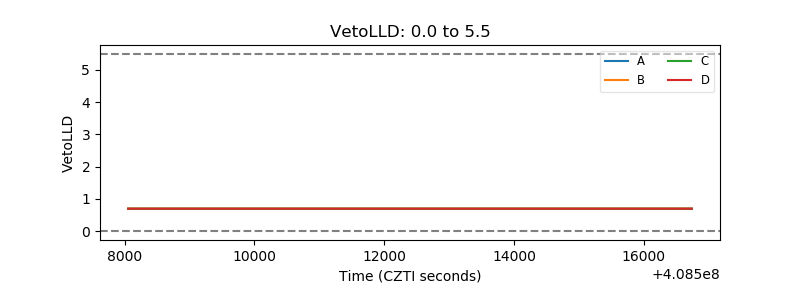 |
| Alpha Counter | 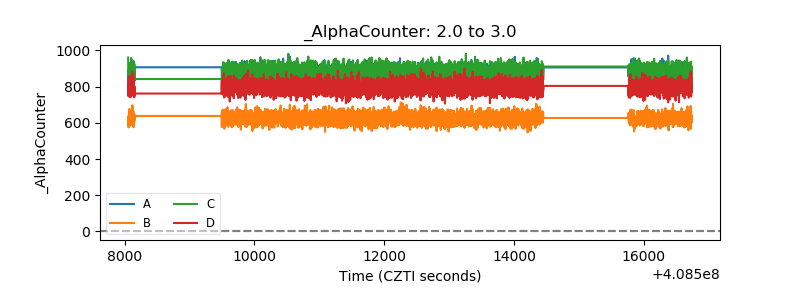 |
| _CPM_Rate | 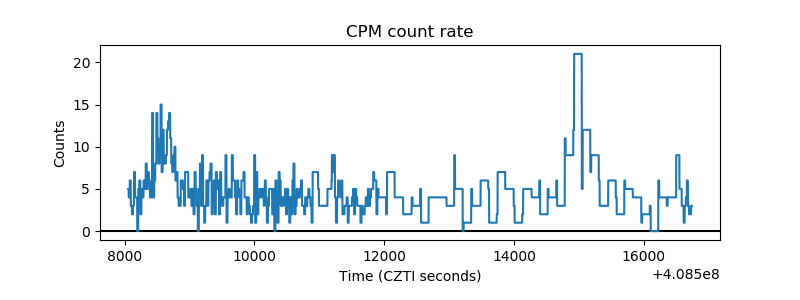 |
| CZT Counter | 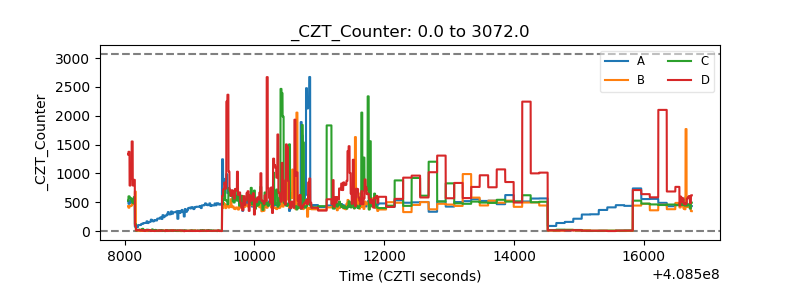 |
| +2.5 Volts monitor | 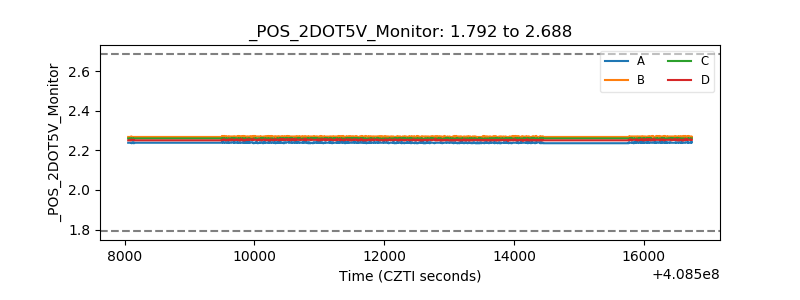 |
| +5 Volts monitor | 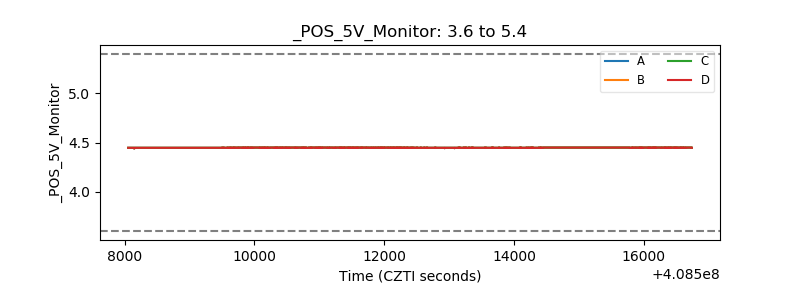 |
| _ROLL_ROT | 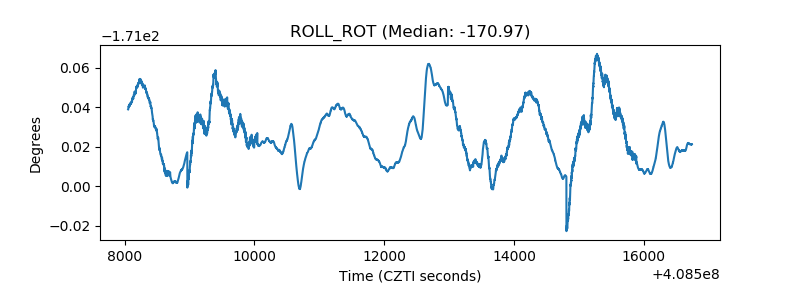 |
| _Roll_DEC | 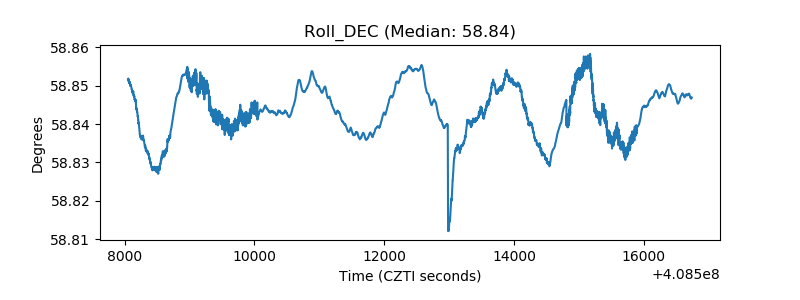 |
| _Roll_RA | 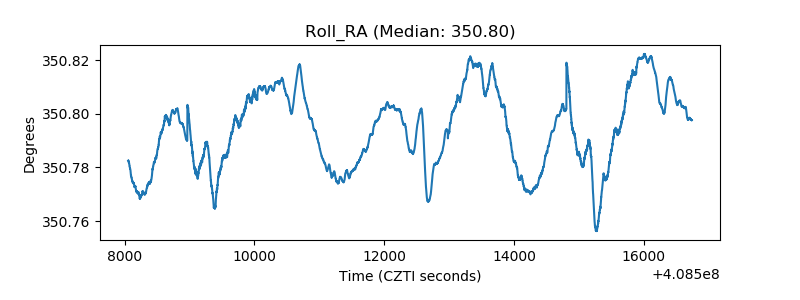 |
| Veto Counter | 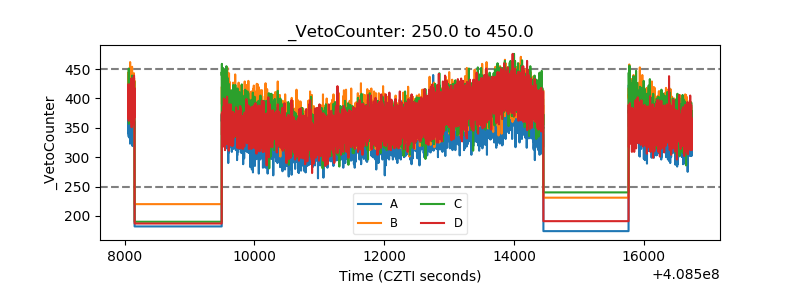 |