| Param | Original file | Final file |
|---|---|---|
| Filename | modeM0/AS1T05_064T01_9000005416_38962cztM0_level2.fits | modeM0/AS1T05_064T01_9000005416_38962cztM0_level2_quad_clean.evt |
| Size (bytes) | 689,693,760 | 175,847,040 |
| Size | 657.7 MB | 167.7 MB |
| Events in quadrant A | 5,705,801 | 1,175,048 |
| Events in quadrant B | 5,091,178 | 1,206,335 |
| Events in quadrant C | 5,557,538 | 1,152,533 |
| Events in quadrant D | 8,337,248 | 1,041,207 |
| Mode SS | |||
|---|---|---|---|
| Quadrant | BADHDUFLAG | Total packets | Discarded packets |
| A | 0 | 220 | 0 |
| B | 0 | 220 | 0 |
| C | 0 | 220 | 0 |
| D | 0 | 220 | 0 |
| Mode M9 | |||
|---|---|---|---|
| Quadrant | BADHDUFLAG | Total packets | Discarded packets |
| A | 0 | 30 | 0 |
| B | 0 | 30 | 0 |
| C | 0 | 30 | 0 |
| D | 0 | 31 | 0 |
| Mode M0 | |||
|---|---|---|---|
| Quadrant | BADHDUFLAG | Total packets | Discarded packets |
| A | 0 | 23418 | 4 |
| B | 0 | 22402 | 3 |
| C | 0 | 23234 | 3 |
| D | 0 | 32287 | 3 |
| Quadrant | Total seconds | Saturated seconds | Saturation percentage |
|---|---|---|---|
| A | 10820 | 40 | 0.369686% |
| B | 10820 | 61 | 0.563771% |
| C | 10820 | 110 | 1.016636% |
| D | 10820 | 383 | 3.539741% |
Noise dominated data is calculated using 1-second bins in cleaned event files. If a bin has >2000 counts, and if more than 50% of those come from <1% of pixels, then it is considered to be noise-dominated and hence unusable.
| Quadrant | # 1 sec bins | Bins with >0 counts | Bins with >2000 counts | High rate bins dominated by noise | Noise dominated (total time) | Noise dominated (detector-on time) | Marked lightcurve |
|---|---|---|---|---|---|---|---|
| A | 13566 | 10822 | 32 | 32 | 0.24% | 0.30% | 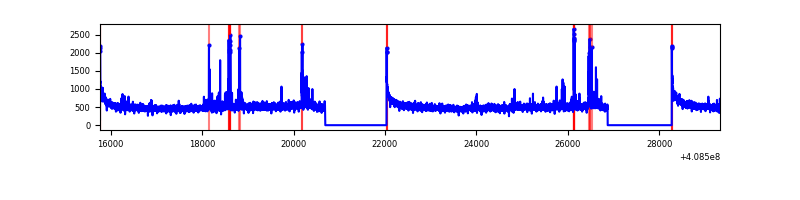 |
| B | 13566 | 10822 | 39 | 39 | 0.29% | 0.36% | 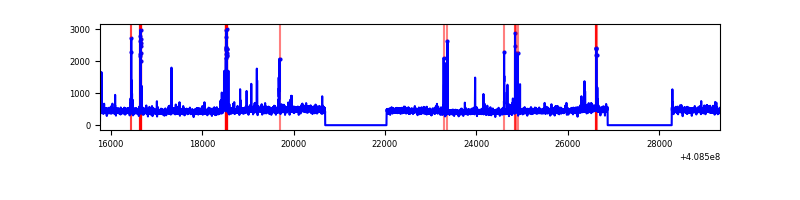 |
| C | 13566 | 10822 | 109 | 109 | 0.80% | 1.01% | 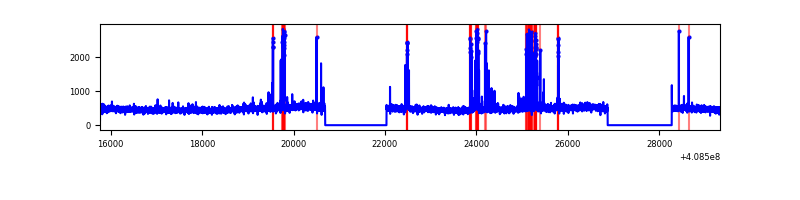 |
| D | 13566 | 10822 | 366 | 366 | 2.70% | 3.38% | 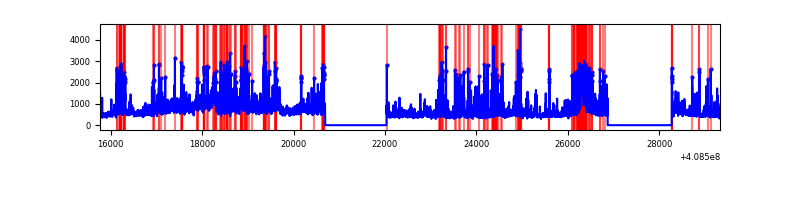 |
Top three noisy pixels from each quadrant. If the there are fewer than three noisy pixels in the level2.evt file, extra rows are filled as -1
| Pixel properties | Quadrant properties | ||||||
|---|---|---|---|---|---|---|---|
| Quadrant | DetID | PixID | Counts | Sigma | Mean | Median | Sigma |
| A | 10 | 83 | 769219 | 3173.06 | 1202 | 1177 | 242.1 |
| A | 13 | 248 | 242308 | 996.2 | 1202 | 1177 | 242.1 |
| A | 13 | 6 | 23207 | 91.01 | 1202 | 1177 | 242.1 |
| B | 5 | 172 | 211808 | 913.4 | 1195 | 1163 | 230.6 |
| B | 0 | 230 | 110913 | 475.9 | 1195 | 1163 | 230.6 |
| B | 15 | 85 | 58519 | 248.71 | 1195 | 1163 | 230.6 |
| C | 14 | 254 | 471210 | 1720.11 | 1171 | 1176 | 273.3 |
| C | 15 | 214 | 442004 | 1613.23 | 1171 | 1176 | 273.3 |
| C | 12 | 249 | 60207 | 216.03 | 1171 | 1176 | 273.3 |
| D | 12 | 235 | 2040393 | 7265.44 | 1157 | 1122 | 280.7 |
| D | 2 | 249 | 909681 | 3236.98 | 1157 | 1122 | 280.7 |
| D | 12 | 227 | 318318 | 1130.09 | 1157 | 1122 | 280.7 |
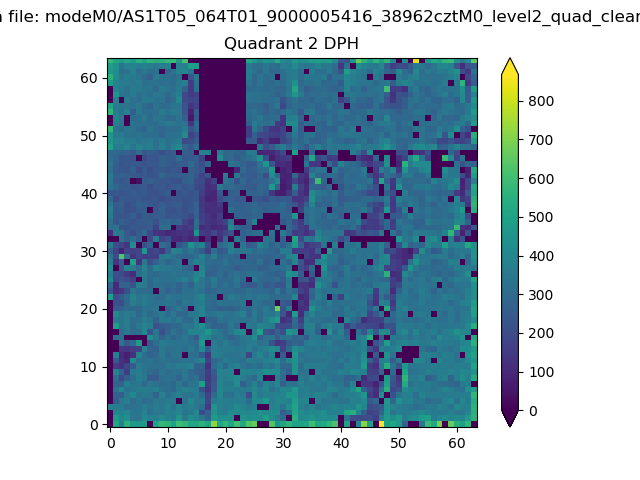
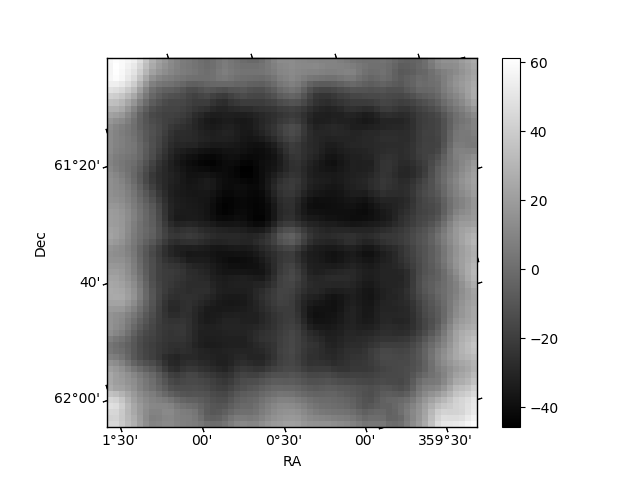
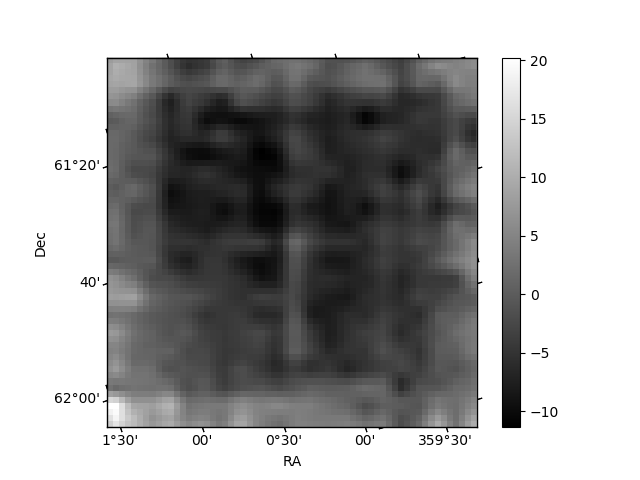
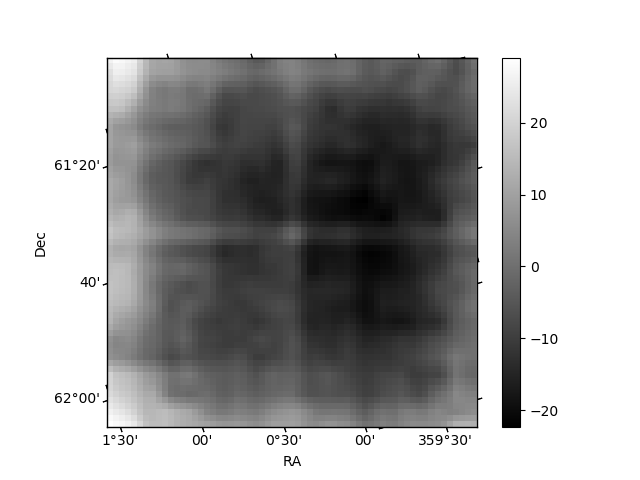
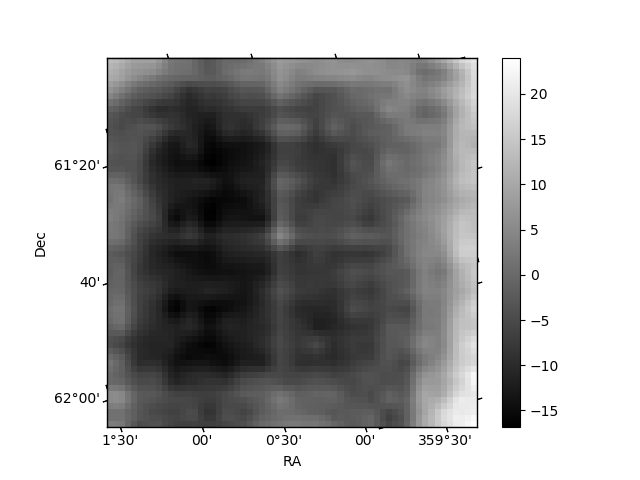
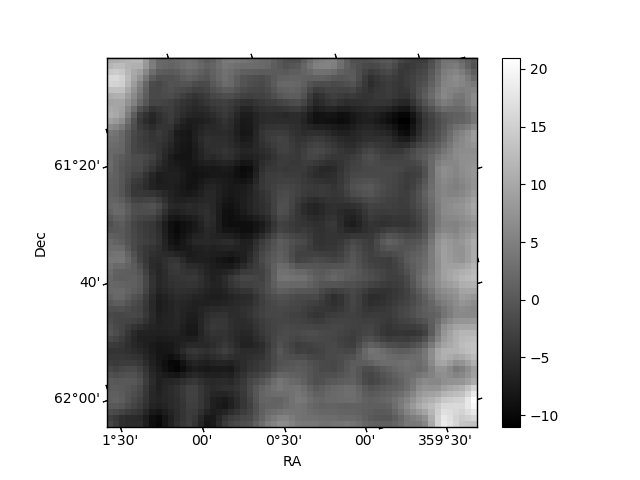
Histogram calculated using DETX and DETY for each event in the final _common_clean file
| Quadrant A | 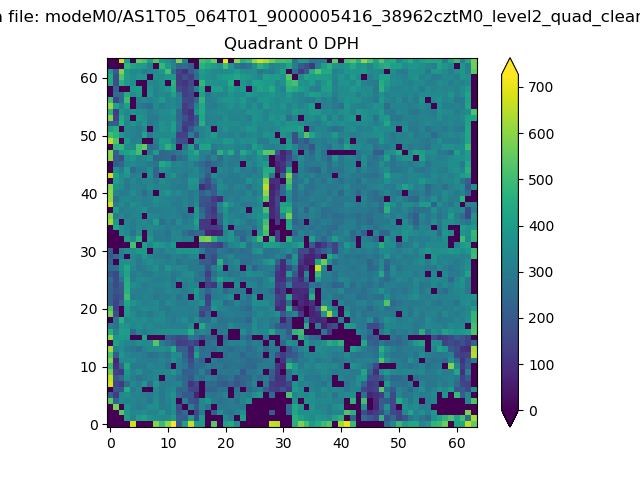 |
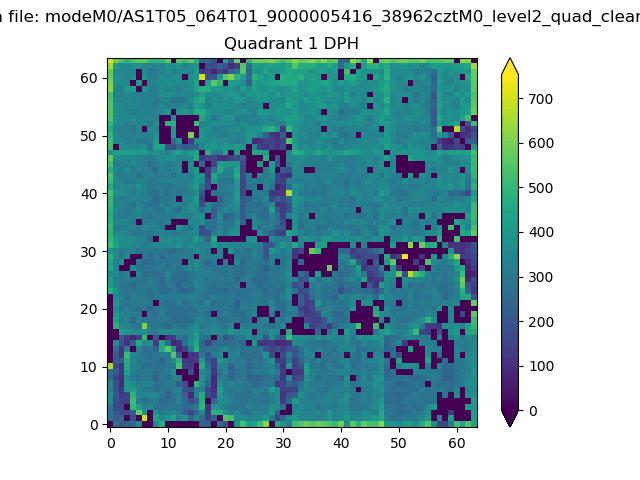 |
Quadrant B |
|---|---|---|---|
| Quadrant D | 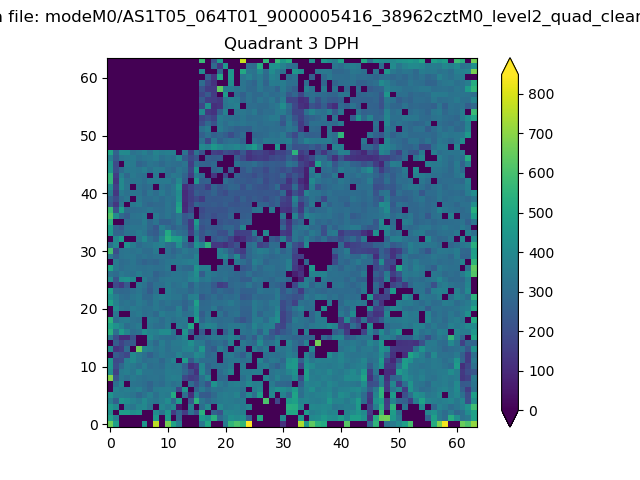 |
 |
Quadrant C |
| Plot type | Count rate plots | Images |
|---|---|---|
| Comparison with Poisson distribution Blue bars denote a histogram of data divided into 1 sec bins. Red curve is a Poisson curve with rate = median count rate of data. |
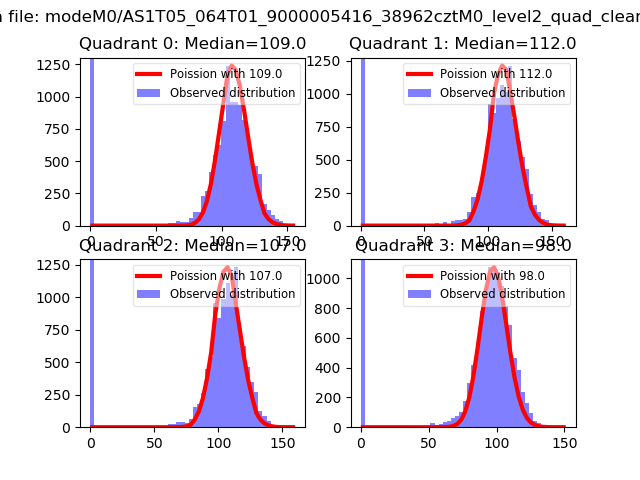 |
 |
| Quadrant-wise count rates Data is divided into 100 sec bins |
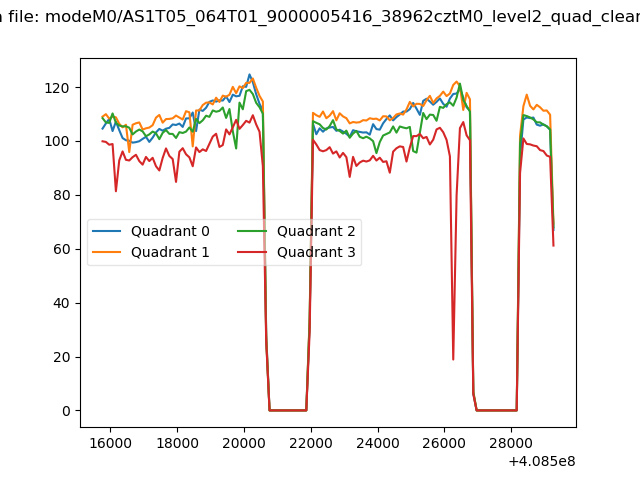 |
|
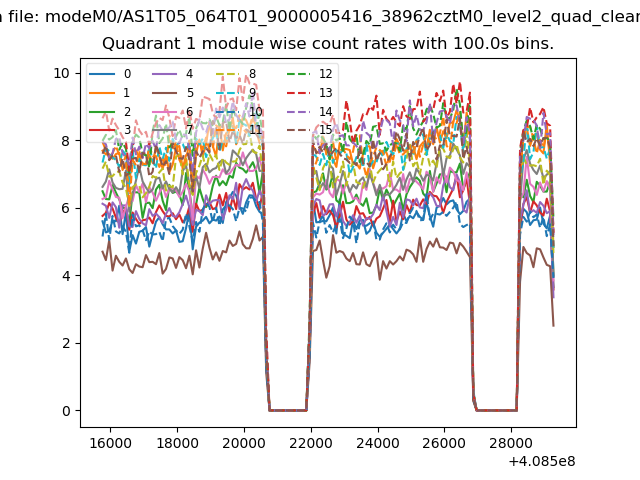
| Module-wise count rates for Quadrant A Data is divided into 100 sec bins |
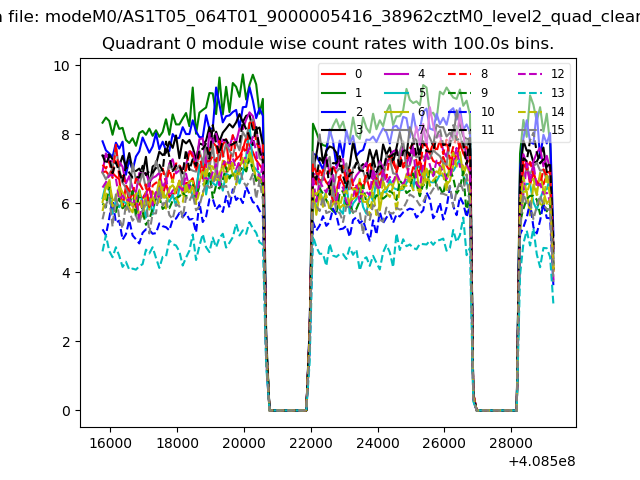 |
 |
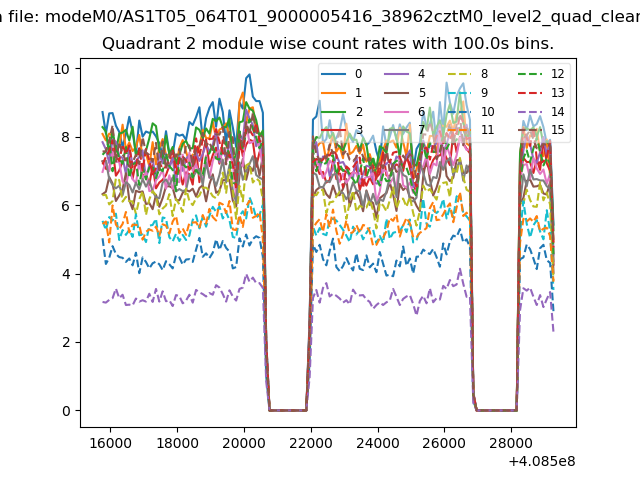
| Module-wise count rates for Quadrant B Data is divided into 100 sec bins |
 |
 |
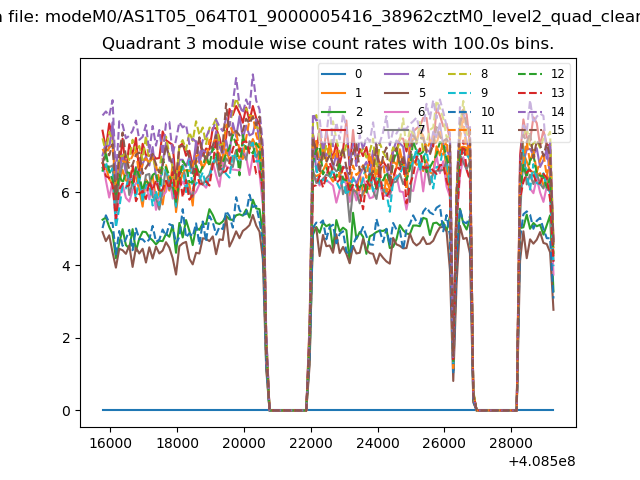
| Module-wise count rates for Quadrant C Data is divided into 100 sec bins |
 |
 |
| Module-wise count rates for Quadrant D Data is divided into 100 sec bins |
 |
 |
| Parameter | Plot |
|---|---|
| CZT HV Monitor | 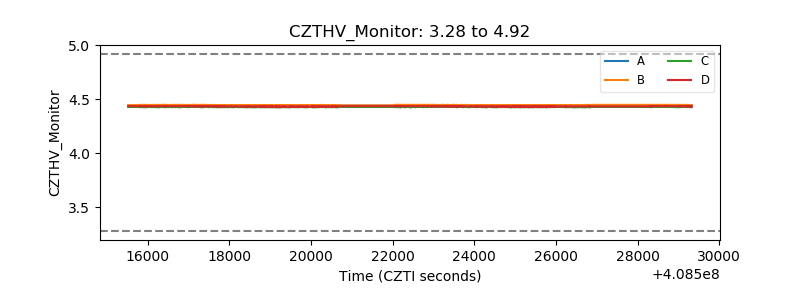 |
| D_VDD | 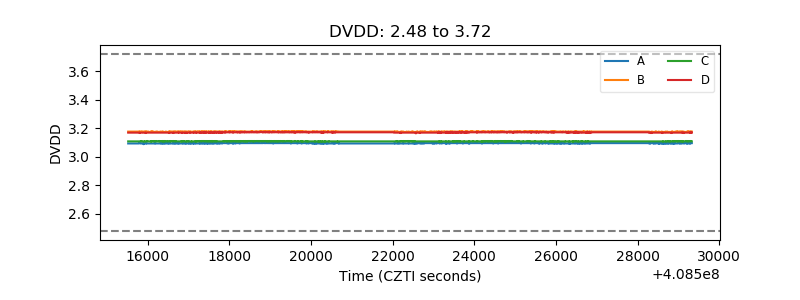 |
| Temperature 1 | 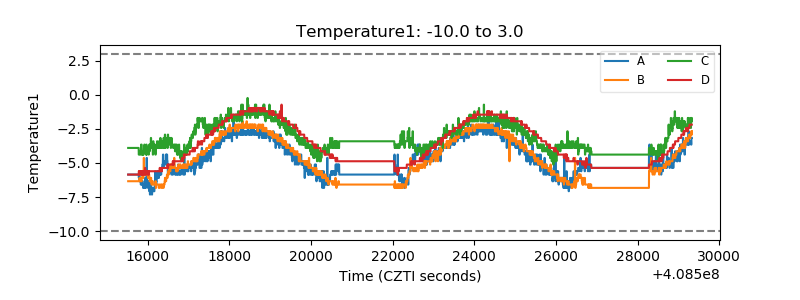 |
| Veto HV Monitor |  |
| Veto LLD | 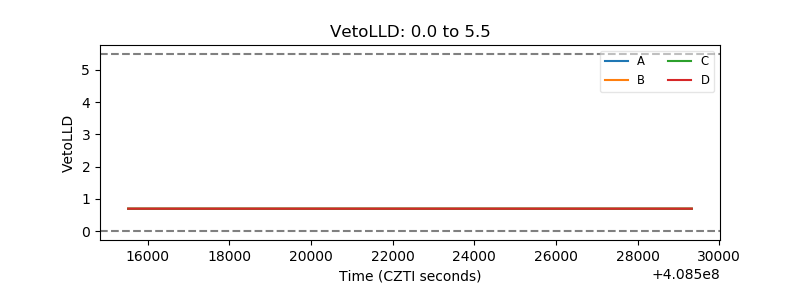 |
| Alpha Counter | 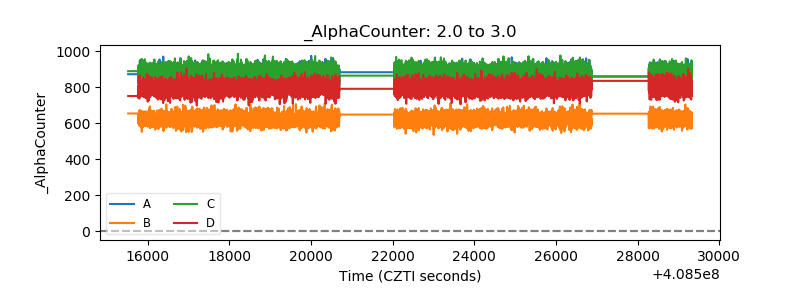 |
| _CPM_Rate | 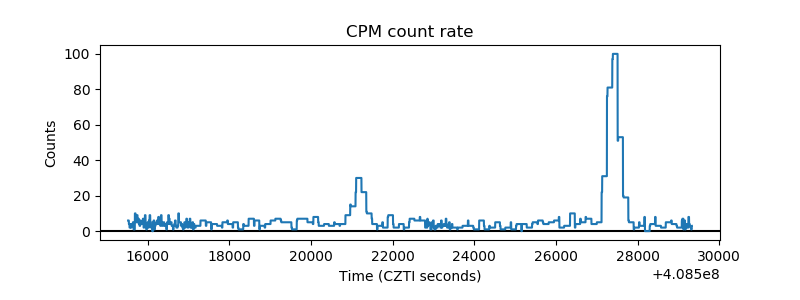 |
| CZT Counter | 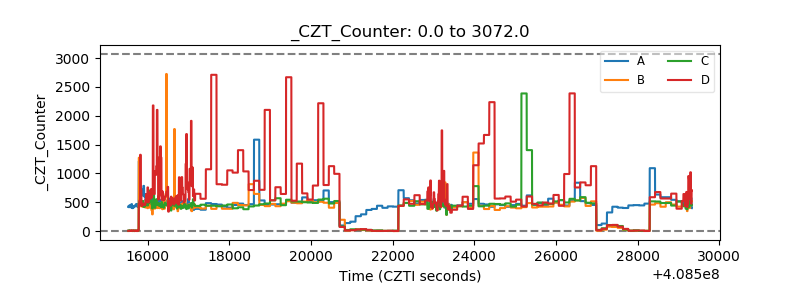 |
| +2.5 Volts monitor | 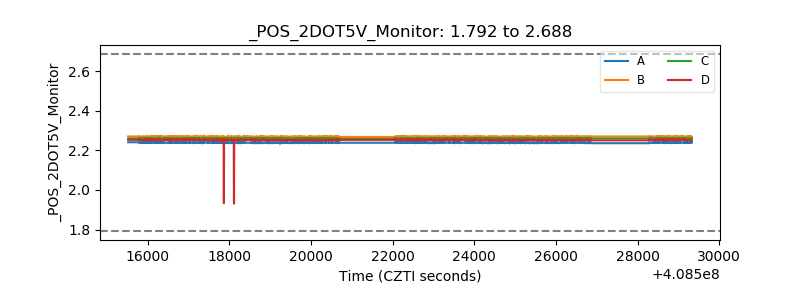 |
| +5 Volts monitor | 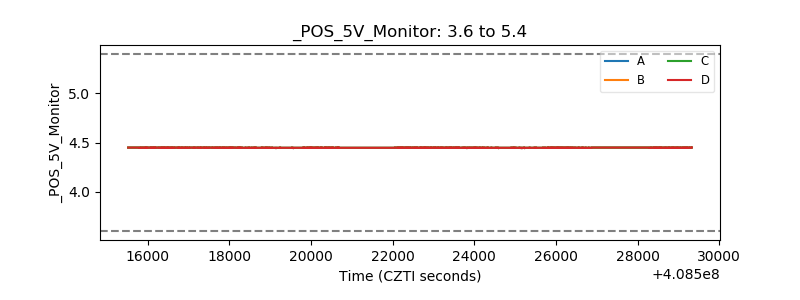 |
| _ROLL_ROT | 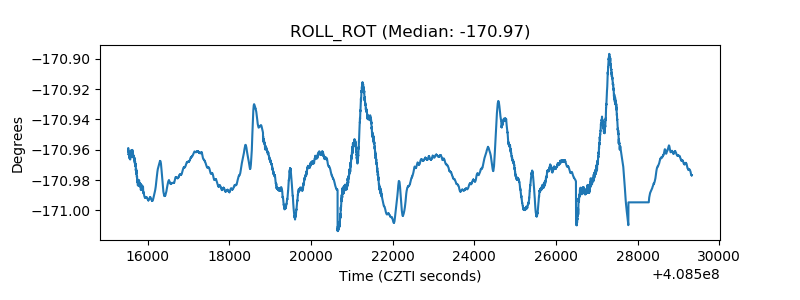 |
| _Roll_DEC | 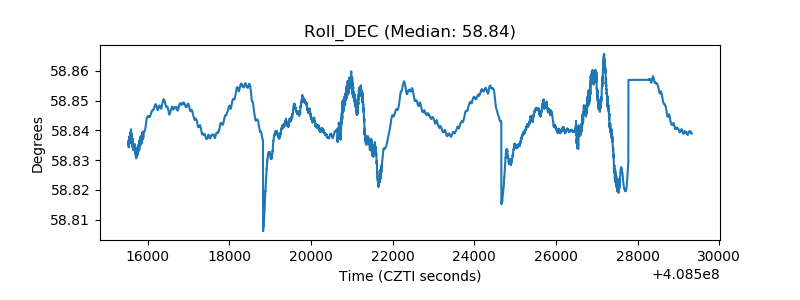 |
| _Roll_RA | 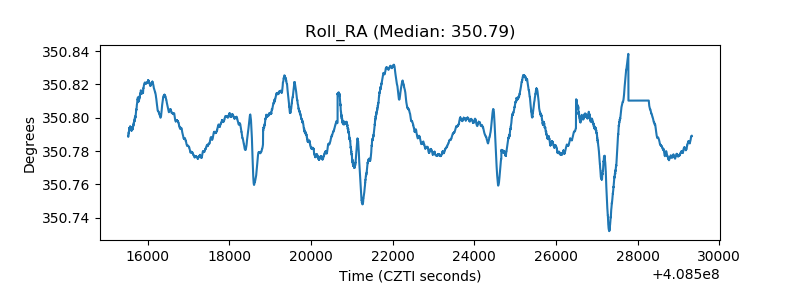 |
| Veto Counter | 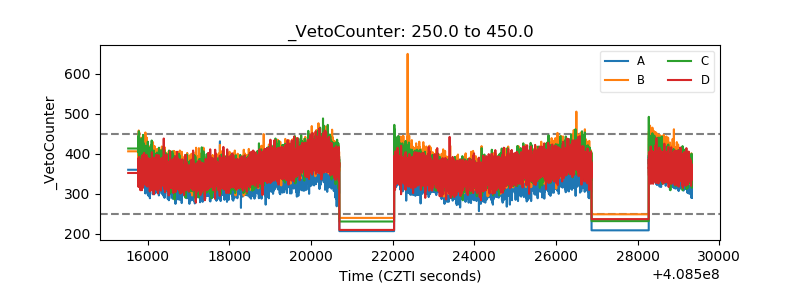 |