| Param | Original file | Final file |
|---|---|---|
| Filename | modeM0/AS1T05_064T01_9000005416_38963cztM0_level2.fits | modeM0/AS1T05_064T01_9000005416_38963cztM0_level2_quad_clean.evt |
| Size (bytes) | 369,817,920 | 93,208,320 |
| Size | 352.7 MB | 88.9 MB |
| Events in quadrant A | 2,979,918 | 632,490 |
| Events in quadrant B | 2,738,805 | 648,071 |
| Events in quadrant C | 2,695,242 | 619,784 |
| Events in quadrant D | 4,830,165 | 521,713 |
| Mode SS | |||
|---|---|---|---|
| Quadrant | BADHDUFLAG | Total packets | Discarded packets |
| A | 0 | 118 | 0 |
| B | 0 | 118 | 0 |
| C | 0 | 118 | 0 |
| D | 0 | 118 | 0 |
| Mode M9 | |||
|---|---|---|---|
| Quadrant | BADHDUFLAG | Total packets | Discarded packets |
| A | 0 | 17 | 0 |
| B | 0 | 17 | 0 |
| C | 0 | 17 | 0 |
| D | 0 | 18 | 0 |
| Mode M0 | |||
|---|---|---|---|
| Quadrant | BADHDUFLAG | Total packets | Discarded packets |
| A | 0 | 12304 | 6 |
| B | 0 | 11975 | 5 |
| C | 0 | 11596 | 8 |
| D | 0 | 18209 | 2 |
| Quadrant | Total seconds | Saturated seconds | Saturation percentage |
|---|---|---|---|
| A | 5720 | 14 | 0.244755% |
| B | 5720 | 38 | 0.664336% |
| C | 5718 | 5 | 0.087443% |
| D | 5722 | 590 | 10.311080% |
Noise dominated data is calculated using 1-second bins in cleaned event files. If a bin has >2000 counts, and if more than 50% of those come from <1% of pixels, then it is considered to be noise-dominated and hence unusable.
| Quadrant | # 1 sec bins | Bins with >0 counts | Bins with >2000 counts | High rate bins dominated by noise | Noise dominated (total time) | Noise dominated (detector-on time) | Marked lightcurve |
|---|---|---|---|---|---|---|---|
| A | 7246 | 5722 | 7 | 7 | 0.10% | 0.12% | 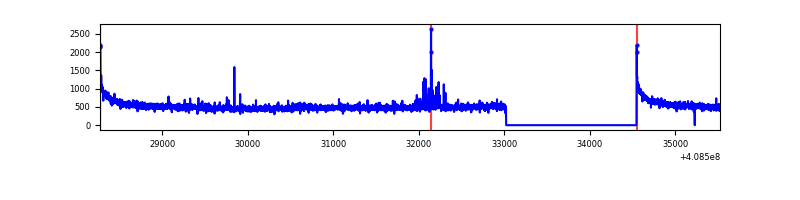 |
| B | 7246 | 5722 | 26 | 26 | 0.36% | 0.45% | 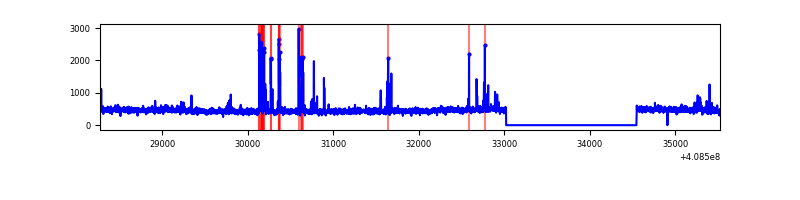 |
| C | 7246 | 5721 | 2 | 2 | 0.03% | 0.03% | 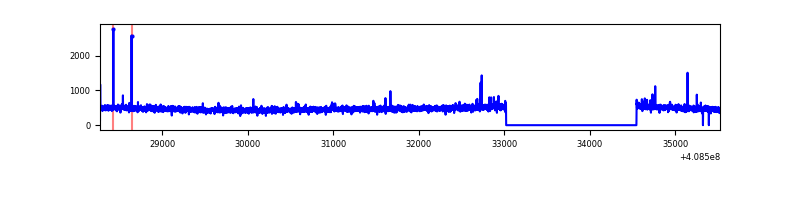 |
| D | 7246 | 5723 | 597 | 597 | 8.24% | 10.43% | 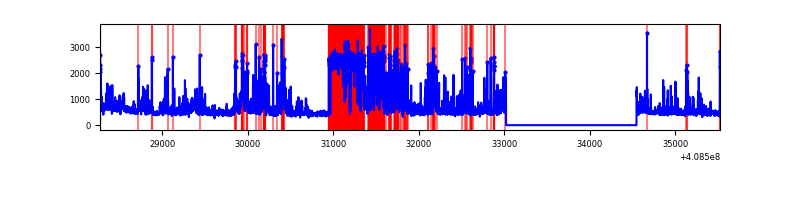 |
Top three noisy pixels from each quadrant. If the there are fewer than three noisy pixels in the level2.evt file, extra rows are filled as -1
| Pixel properties | Quadrant properties | ||||||
|---|---|---|---|---|---|---|---|
| Quadrant | DetID | PixID | Counts | Sigma | Mean | Median | Sigma |
| A | 10 | 83 | 445667 | 3437.78 | 637 | 623 | 129.5 |
| A | 7 | 3 | 43108 | 328.18 | 637 | 623 | 129.5 |
| A | 13 | 6 | 16593 | 123.36 | 637 | 623 | 129.5 |
| B | 5 | 172 | 133637 | 1075.76 | 632 | 612 | 123.7 |
| B | 0 | 230 | 53062 | 424.16 | 632 | 612 | 123.7 |
| B | 0 | 186 | 35590 | 282.86 | 632 | 612 | 123.7 |
| C | 15 | 214 | 237148 | 1641.72 | 618 | 621 | 144.1 |
| C | 2 | 16 | 25562 | 173.11 | 618 | 621 | 144.1 |
| C | 14 | 254 | 6581 | 41.37 | 618 | 621 | 144.1 |
| D | 2 | 249 | 1529111 | 10674.29 | 587 | 570 | 143.2 |
| D | 12 | 235 | 426001 | 2970.92 | 587 | 570 | 143.2 |
| D | 2 | 250 | 211462 | 1472.73 | 587 | 570 | 143.2 |
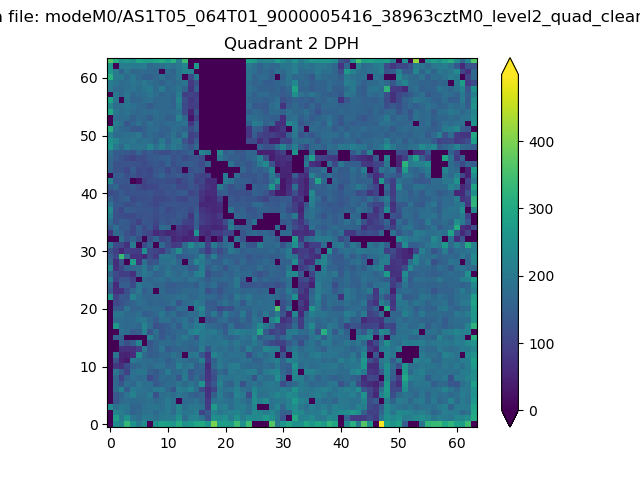
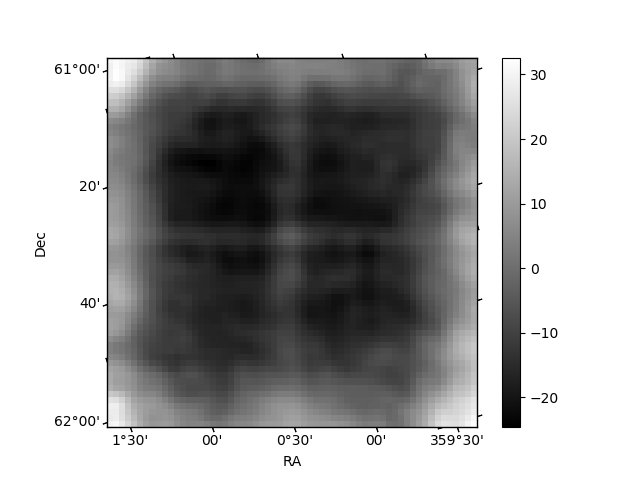
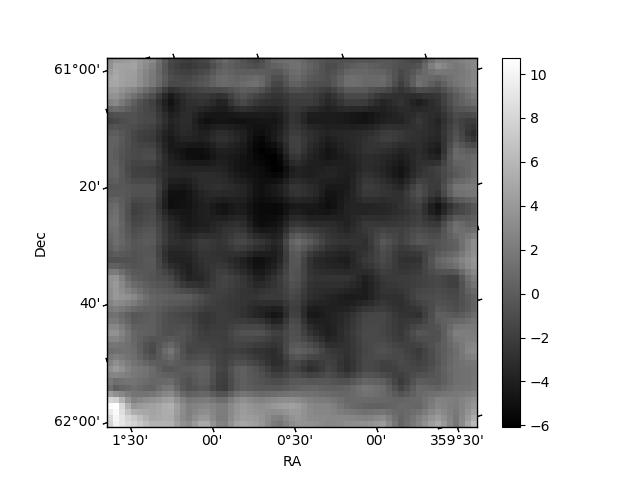
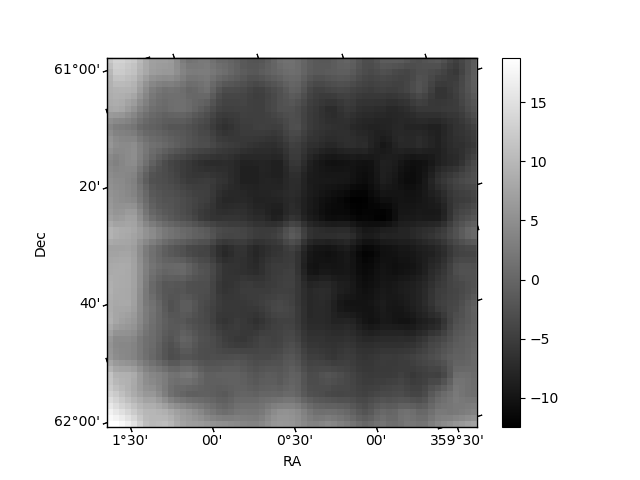
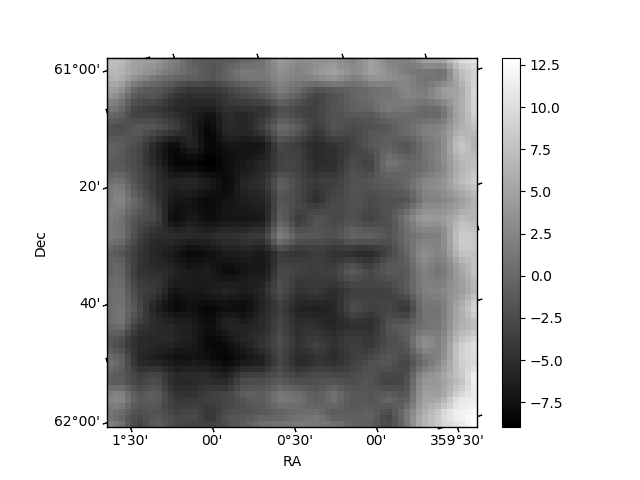
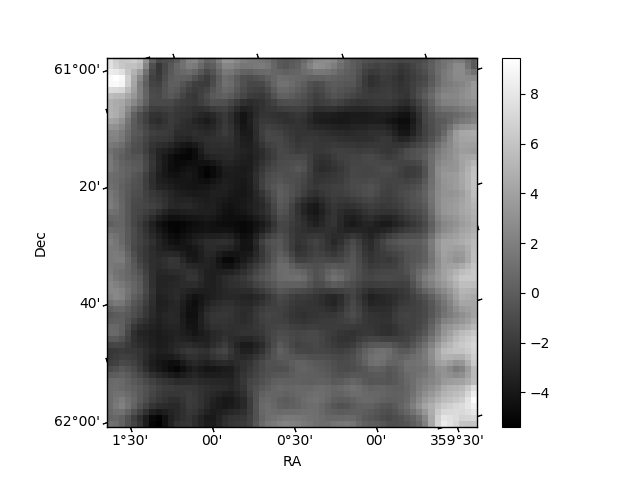
Histogram calculated using DETX and DETY for each event in the final _common_clean file
| Quadrant A | 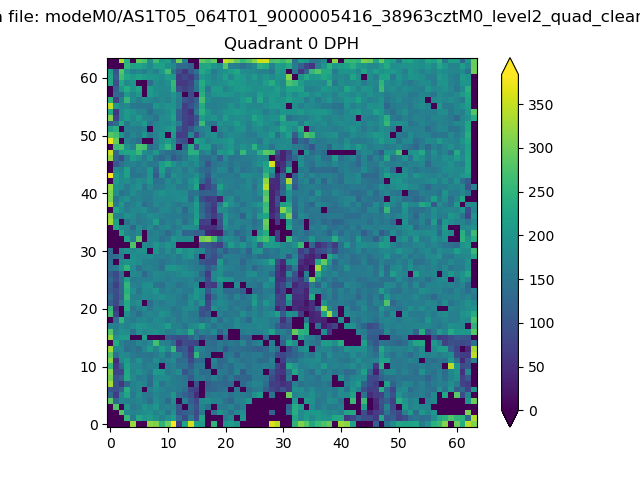 |
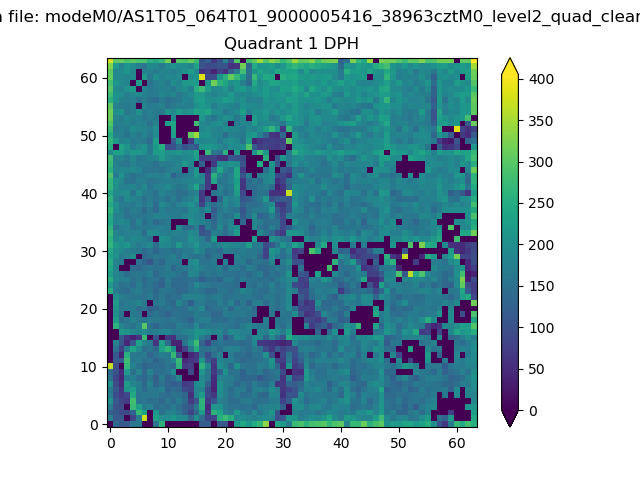 |
Quadrant B |
|---|---|---|---|
| Quadrant D | 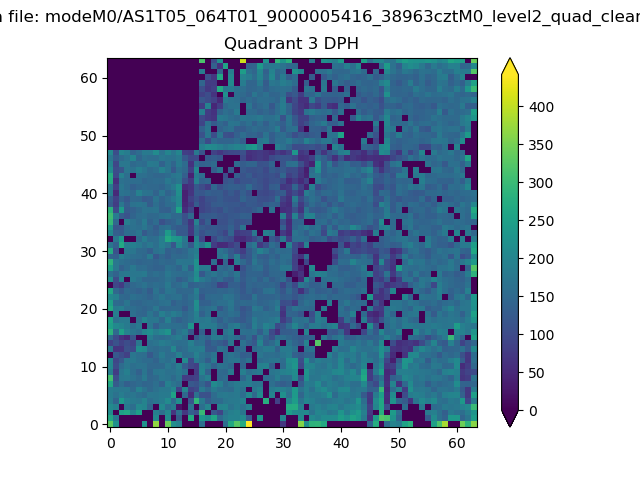 |
 |
Quadrant C |
| Plot type | Count rate plots | Images |
|---|---|---|
| Comparison with Poisson distribution Blue bars denote a histogram of data divided into 1 sec bins. Red curve is a Poisson curve with rate = median count rate of data. |
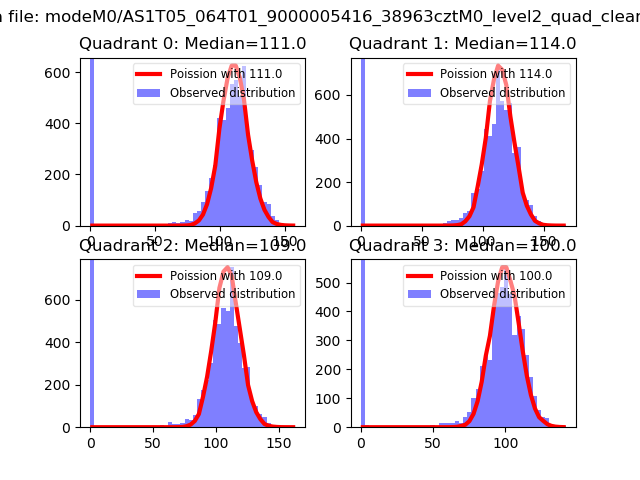 |
 |
| Quadrant-wise count rates Data is divided into 100 sec bins |
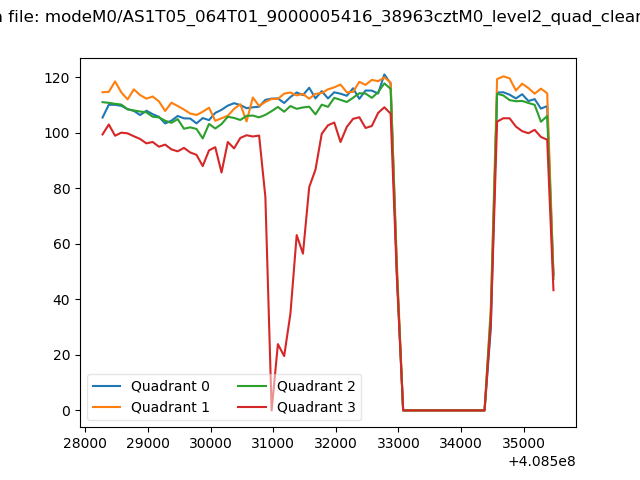 |
|
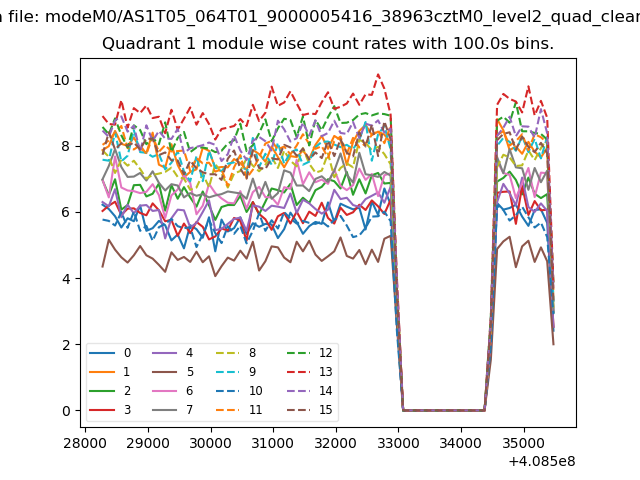
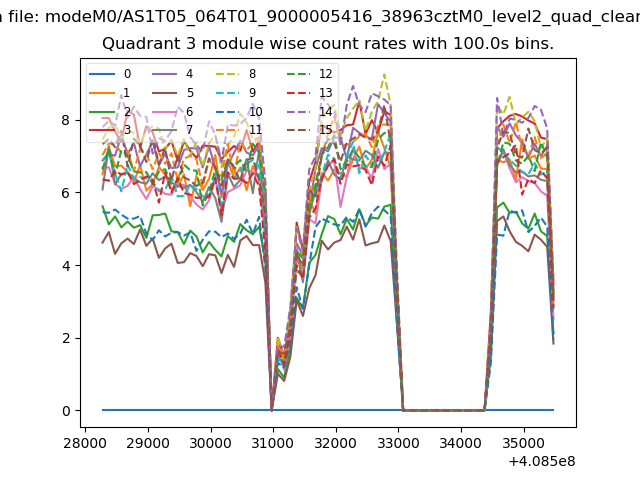
| Module-wise count rates for Quadrant A Data is divided into 100 sec bins |
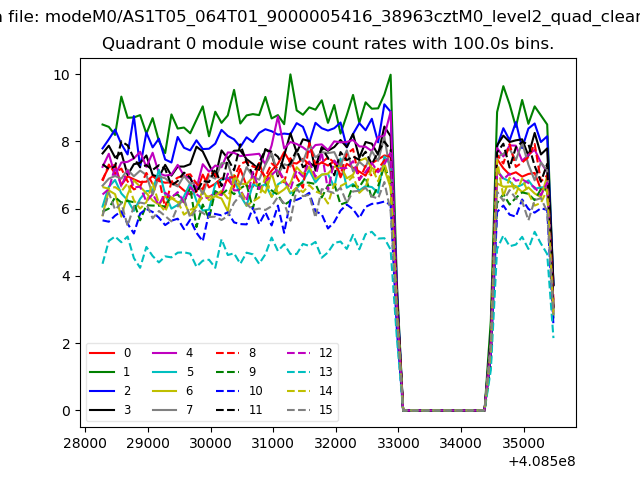 |
 |
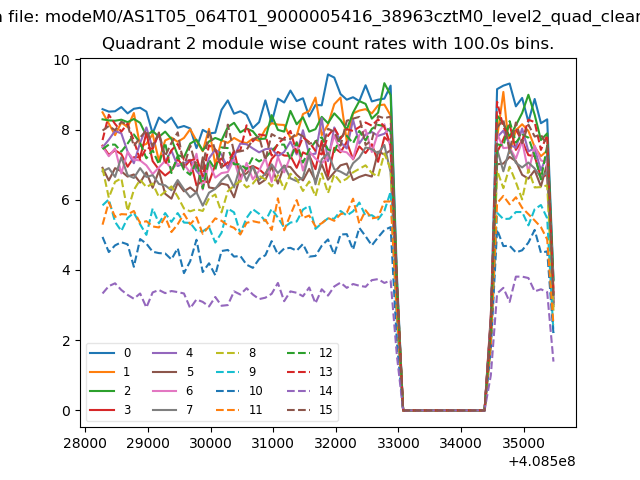
| Module-wise count rates for Quadrant B Data is divided into 100 sec bins |
 |
 |
| Module-wise count rates for Quadrant C Data is divided into 100 sec bins |
 |
 |
| Module-wise count rates for Quadrant D Data is divided into 100 sec bins |
 |
 |
| Parameter | Plot |
|---|---|
| CZT HV Monitor | 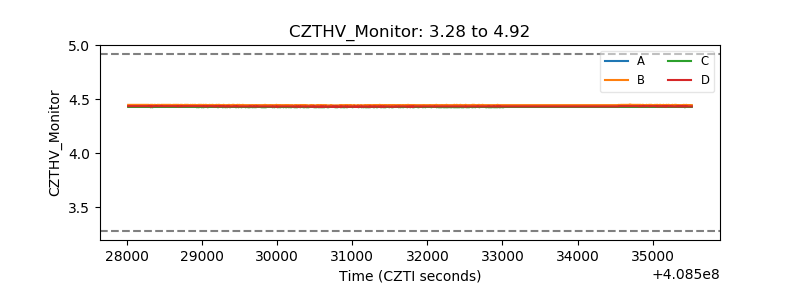 |
| D_VDD | 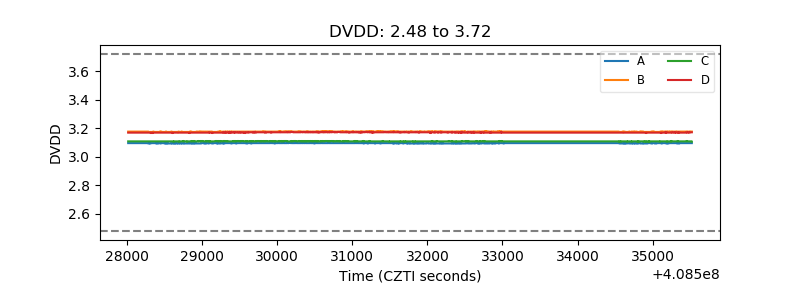 |
| Temperature 1 | 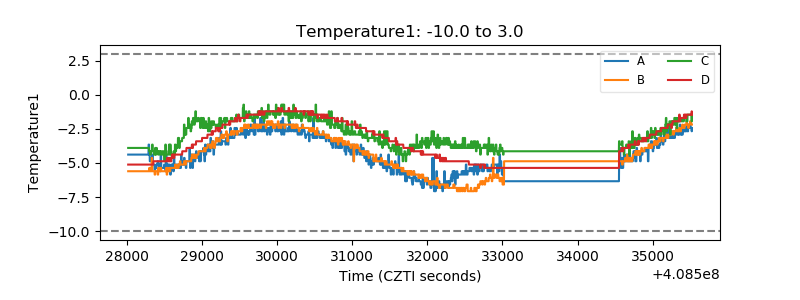 |
| Veto HV Monitor | 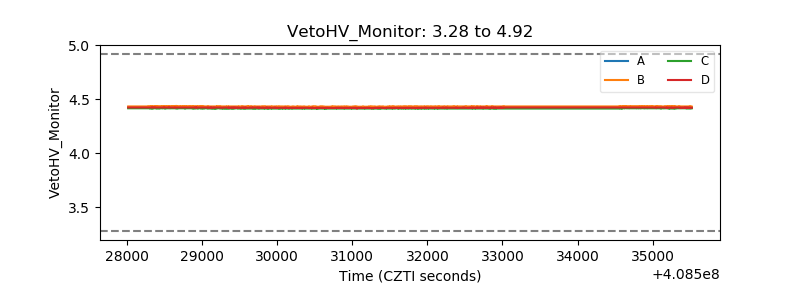 |
| Veto LLD | 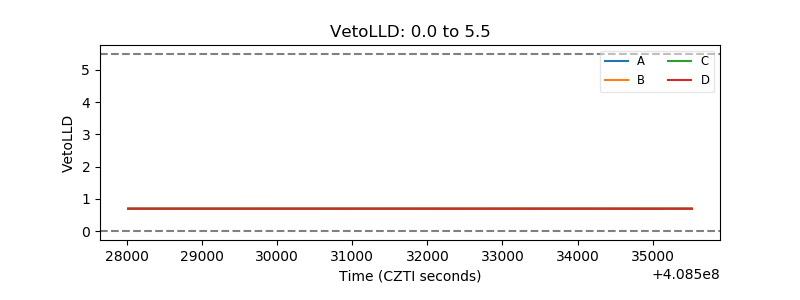 |
| Alpha Counter | 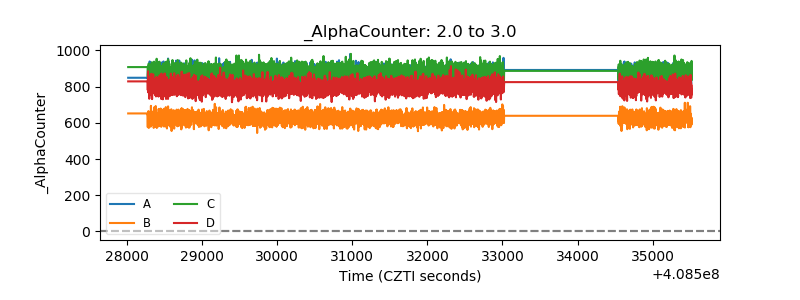 |
| _CPM_Rate | 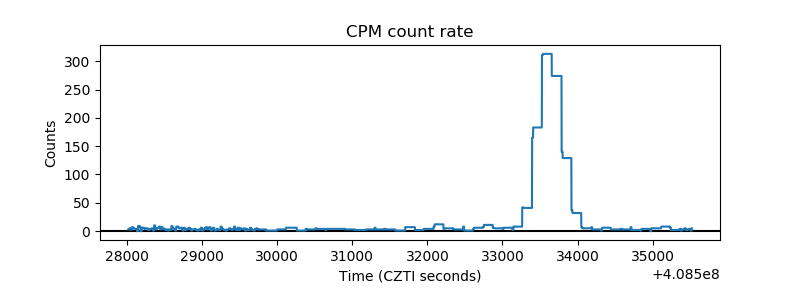 |
| CZT Counter | 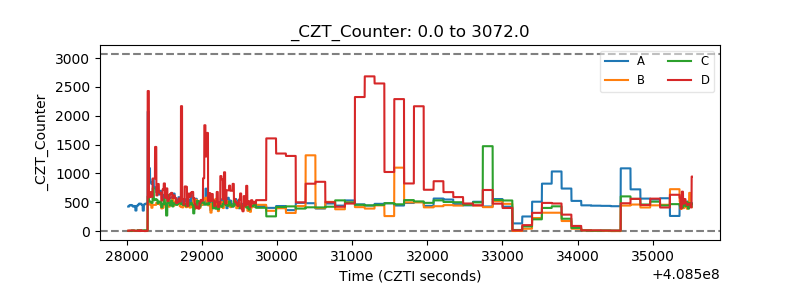 |
| +2.5 Volts monitor | 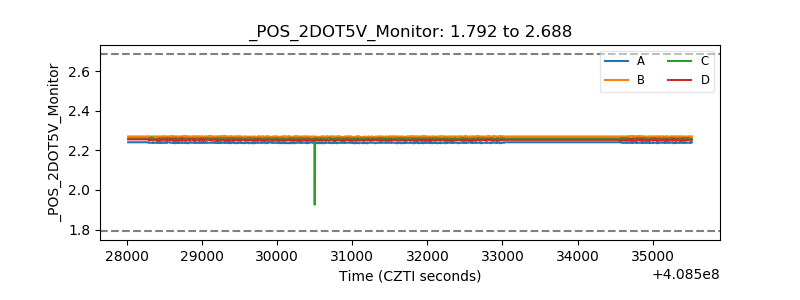 |
| +5 Volts monitor | 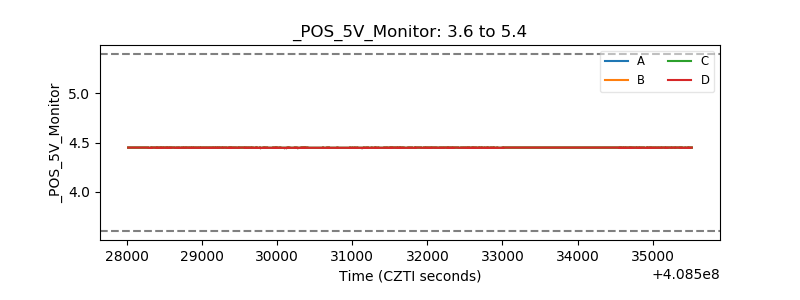 |
| _ROLL_ROT | 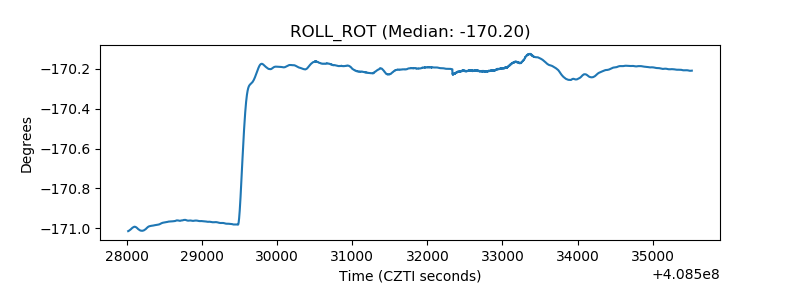 |
| _Roll_DEC | 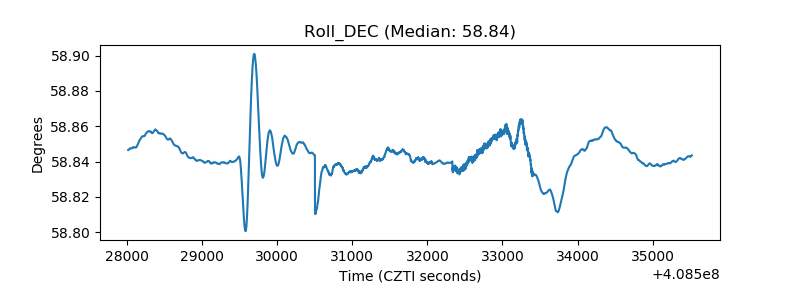 |
| _Roll_RA |  |
| Veto Counter | 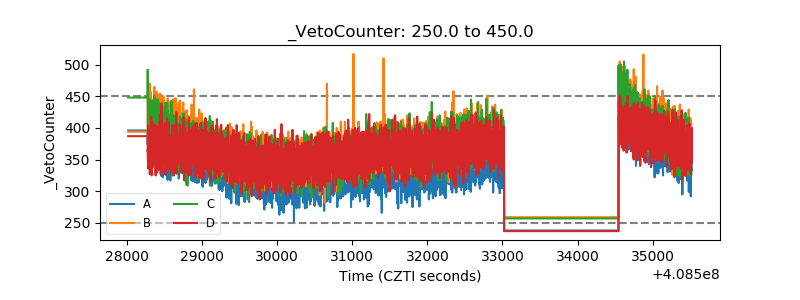 |