| Param | Original file | Final file |
|---|---|---|
| Filename | modeM0/AS1T05_064T01_9000005416_38964cztM0_level2.fits | modeM0/AS1T05_064T01_9000005416_38964cztM0_level2_quad_clean.evt |
| Size (bytes) | 365,500,800 | 91,592,640 |
| Size | 348.6 MB | 87.3 MB |
| Events in quadrant A | 2,830,334 | 622,835 |
| Events in quadrant B | 2,759,164 | 627,398 |
| Events in quadrant C | 3,954,147 | 586,578 |
| Events in quadrant D | 3,560,296 | 553,977 |
| Mode SS | |||
|---|---|---|---|
| Quadrant | BADHDUFLAG | Total packets | Discarded packets |
| A | 0 | 110 | 0 |
| B | 0 | 110 | 0 |
| C | 0 | 110 | 0 |
| D | 0 | 110 | 0 |
| Mode M9 | |||
|---|---|---|---|
| Quadrant | BADHDUFLAG | Total packets | Discarded packets |
| A | 0 | 28 | 0 |
| B | 0 | 28 | 0 |
| C | 0 | 28 | 0 |
| D | 0 | 29 | 0 |
| Mode M0 | |||
|---|---|---|---|
| Quadrant | BADHDUFLAG | Total packets | Discarded packets |
| A | 0 | 11809 | 2 |
| B | 0 | 11856 | 1 |
| C | 0 | 15332 | 1 |
| D | 0 | 14145 | 1 |
| Quadrant | Total seconds | Saturated seconds | Saturation percentage |
|---|---|---|---|
| A | 5471 | 18 | 0.329007% |
| B | 5471 | 77 | 1.407421% |
| C | 5471 | 207 | 3.783586% |
| D | 5471 | 121 | 2.211661% |
Noise dominated data is calculated using 1-second bins in cleaned event files. If a bin has >2000 counts, and if more than 50% of those come from <1% of pixels, then it is considered to be noise-dominated and hence unusable.
| Quadrant | # 1 sec bins | Bins with >0 counts | Bins with >2000 counts | High rate bins dominated by noise | Noise dominated (total time) | Noise dominated (detector-on time) | Marked lightcurve |
|---|---|---|---|---|---|---|---|
| A | 7144 | 5472 | 4 | 4 | 0.06% | 0.07% | 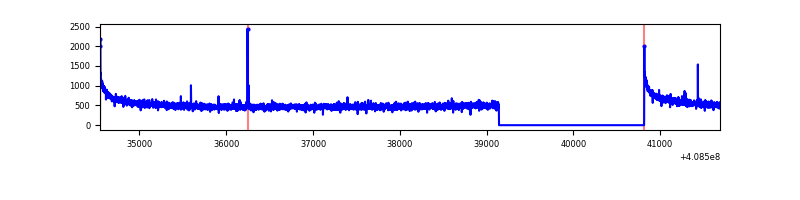 |
| B | 7144 | 5472 | 65 | 65 | 0.91% | 1.19% | 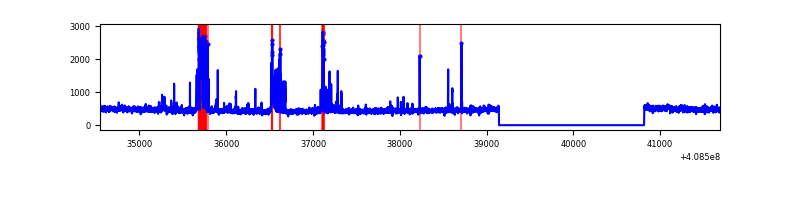 |
| C | 7144 | 5472 | 211 | 211 | 2.95% | 3.86% | 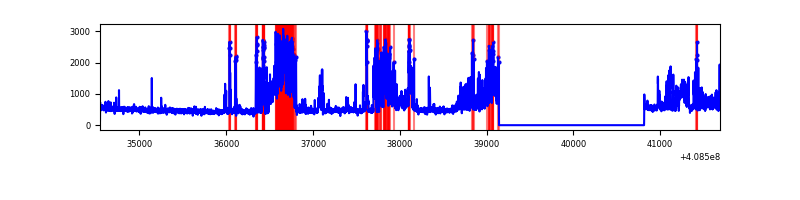 |
| D | 7144 | 5472 | 124 | 124 | 1.74% | 2.27% | 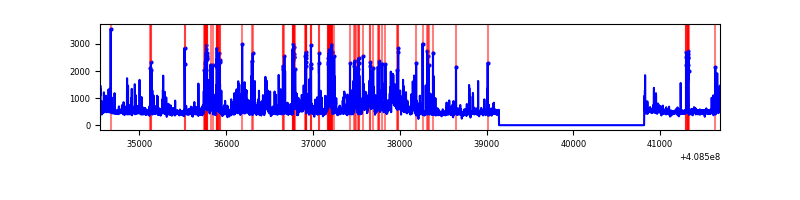 |
Top three noisy pixels from each quadrant. If the there are fewer than three noisy pixels in the level2.evt file, extra rows are filled as -1
| Pixel properties | Quadrant properties | ||||||
|---|---|---|---|---|---|---|---|
| Quadrant | DetID | PixID | Counts | Sigma | Mean | Median | Sigma |
| A | 10 | 83 | 436568 | 3510.92 | 612 | 599 | 124.2 |
| A | 9 | 143 | 14023 | 108.11 | 612 | 599 | 124.2 |
| A | 13 | 6 | 9599 | 72.48 | 612 | 599 | 124.2 |
| B | 5 | 172 | 243939 | 2105.34 | 602 | 586 | 115.6 |
| B | 15 | 85 | 92721 | 797.1 | 602 | 586 | 115.6 |
| B | 0 | 230 | 48036 | 410.51 | 602 | 586 | 115.6 |
| C | 14 | 254 | 1406110 | 10266.25 | 588 | 591 | 136.9 |
| C | 15 | 214 | 225872 | 1645.5 | 588 | 591 | 136.9 |
| C | 2 | 16 | 11961 | 83.05 | 588 | 591 | 136.9 |
| D | 12 | 227 | 461813 | 3174.03 | 594 | 576 | 145.3 |
| D | 2 | 249 | 220318 | 1512.16 | 594 | 576 | 145.3 |
| D | 12 | 233 | 152981 | 1048.78 | 594 | 576 | 145.3 |
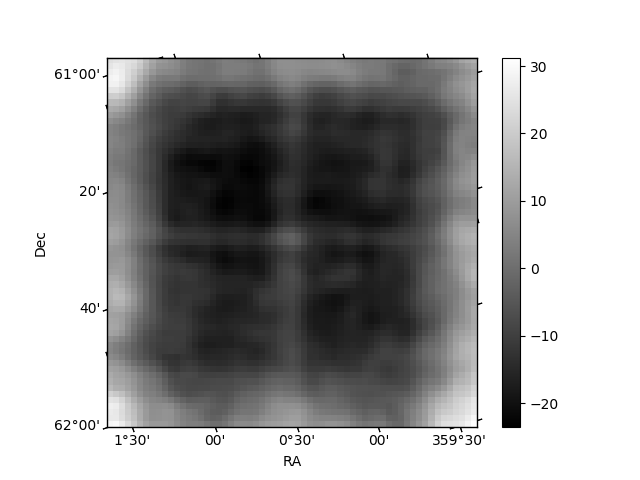
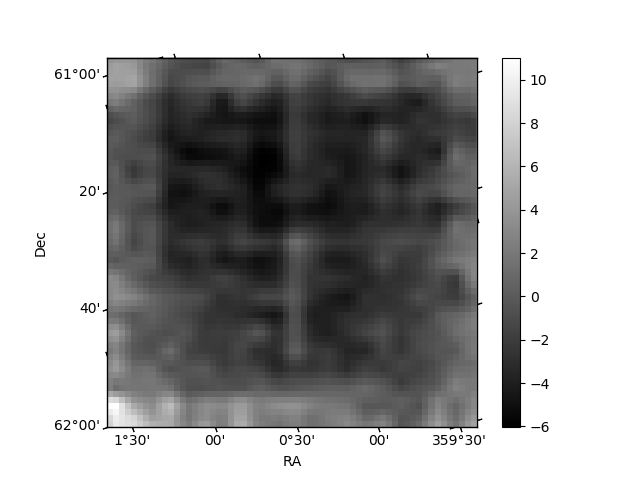
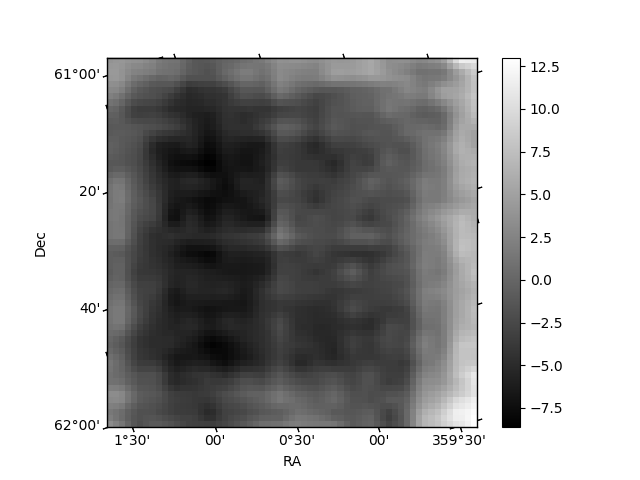
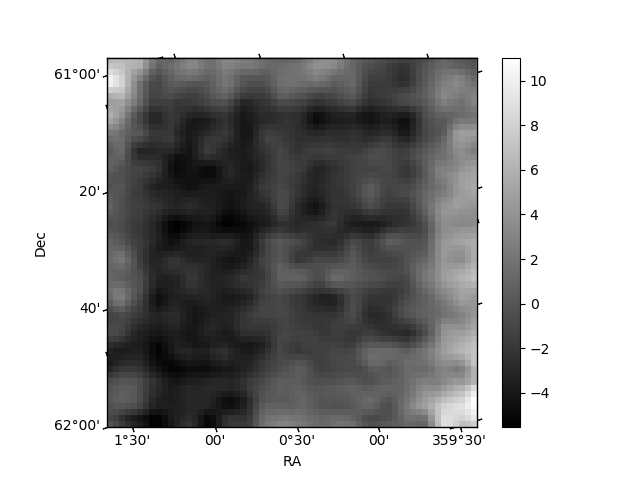
Histogram calculated using DETX and DETY for each event in the final _common_clean file
| Quadrant A | 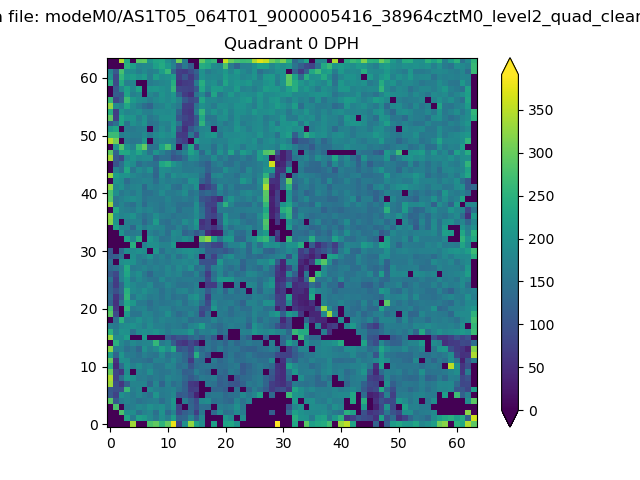 |
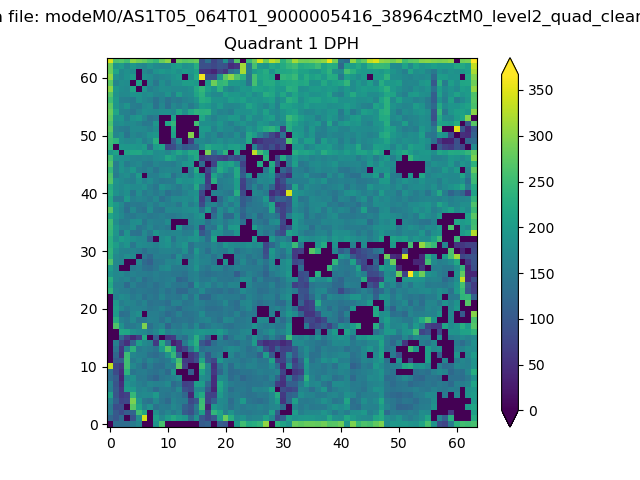 |
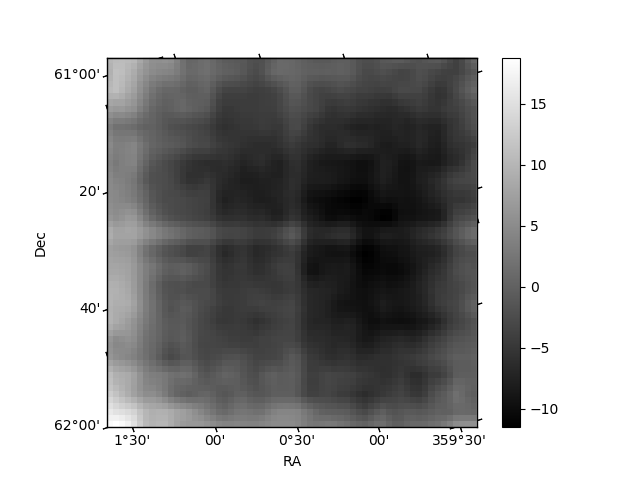
Quadrant B |
|---|---|---|---|
| Quadrant D | 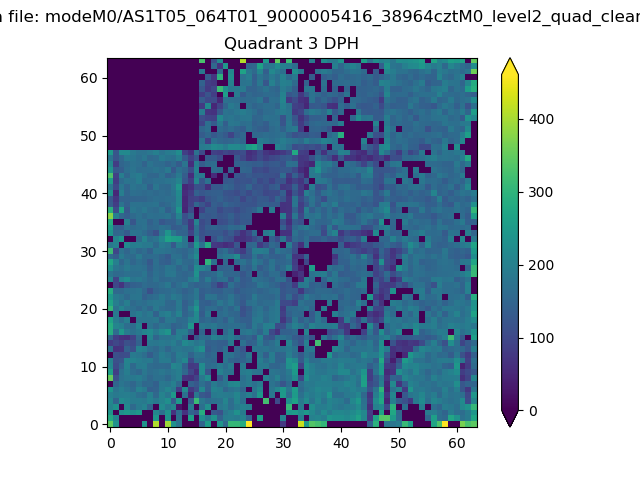 |
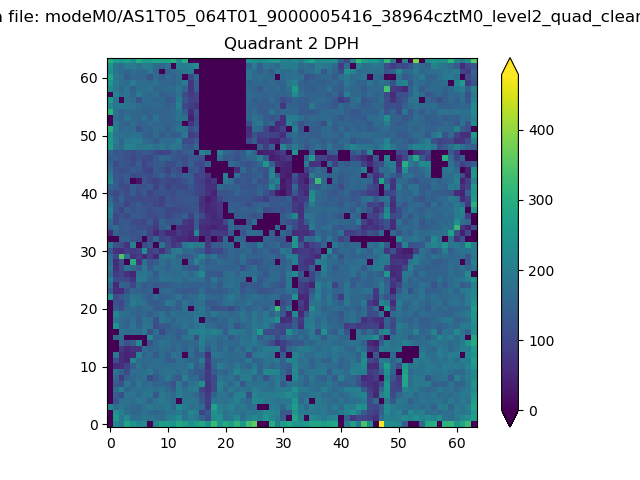 |
Quadrant C |
| Plot type | Count rate plots | Images |
|---|---|---|
| Comparison with Poisson distribution Blue bars denote a histogram of data divided into 1 sec bins. Red curve is a Poisson curve with rate = median count rate of data. |
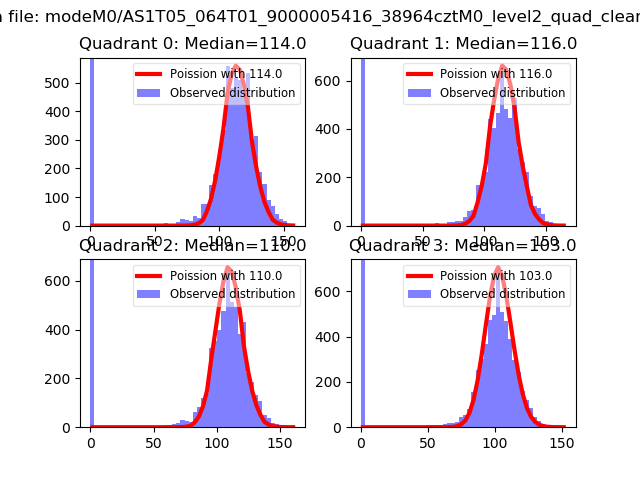 |
 |
| Quadrant-wise count rates Data is divided into 100 sec bins |
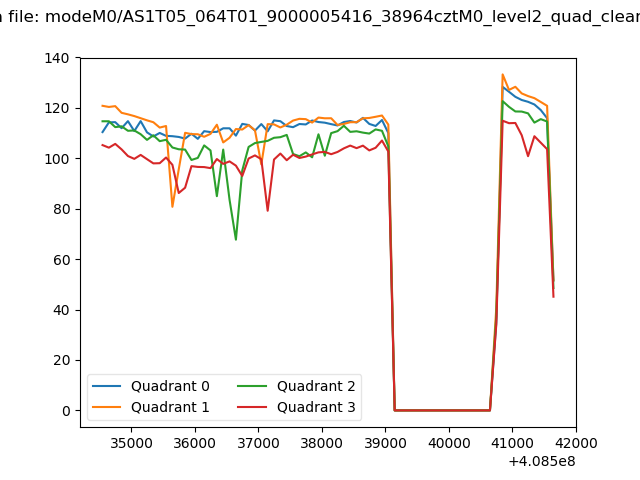 |
|
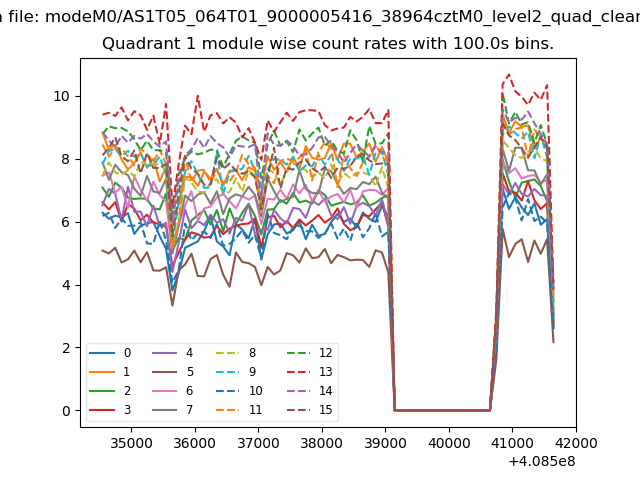
| Module-wise count rates for Quadrant A Data is divided into 100 sec bins |
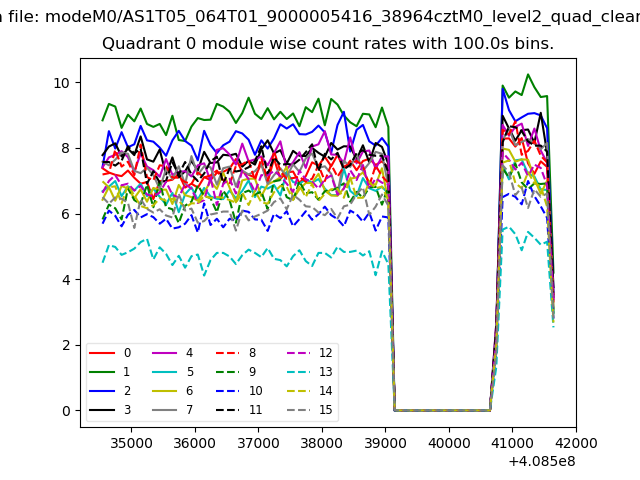 |
 |
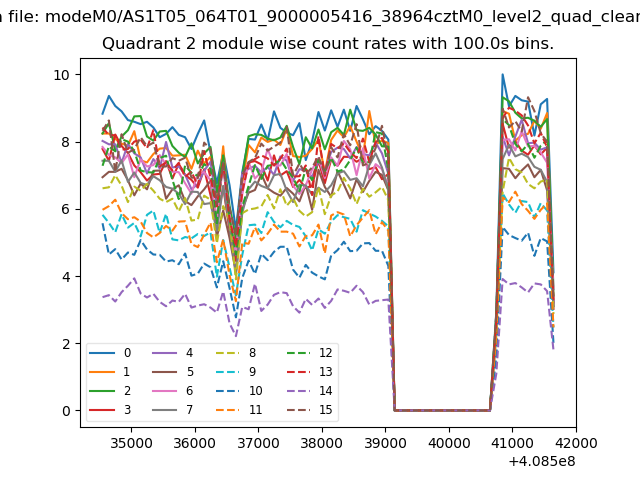
| Module-wise count rates for Quadrant B Data is divided into 100 sec bins |
 |
 |
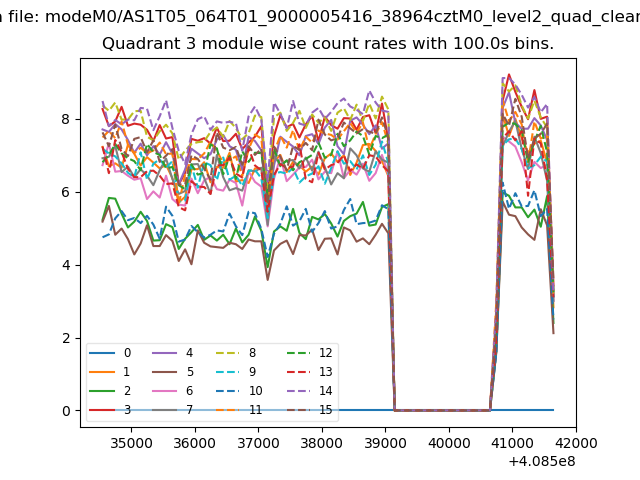
| Module-wise count rates for Quadrant C Data is divided into 100 sec bins |
 |
 |
| Module-wise count rates for Quadrant D Data is divided into 100 sec bins |
 |
 |
| Parameter | Plot |
|---|---|
| CZT HV Monitor | 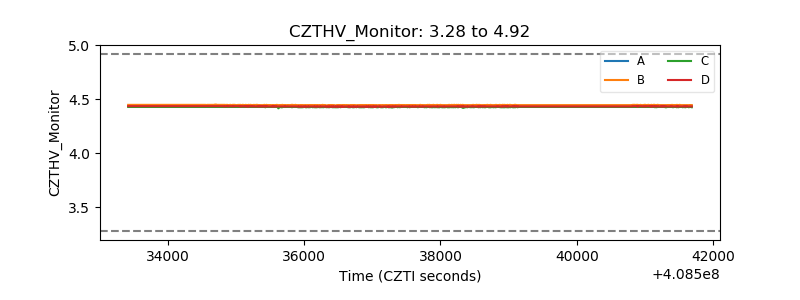 |
| D_VDD | 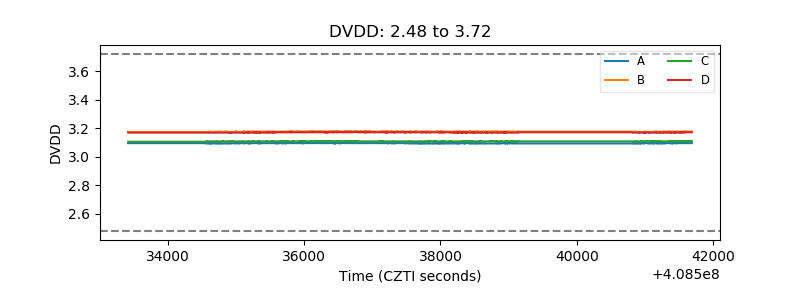 |
| Temperature 1 | 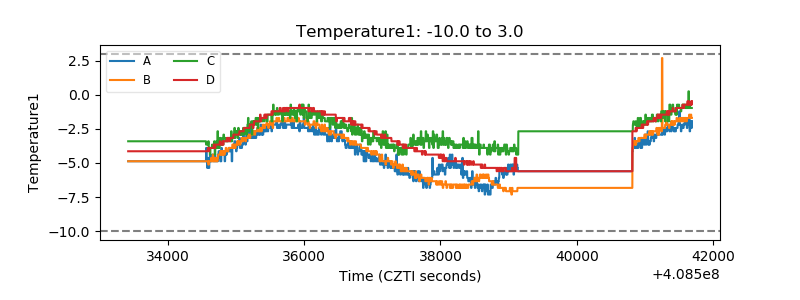 |
| Veto HV Monitor | 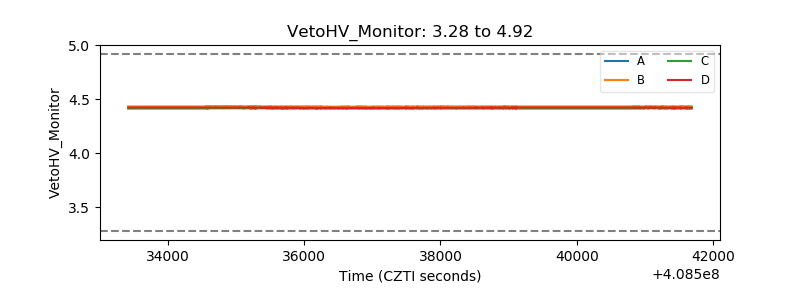 |
| Veto LLD | 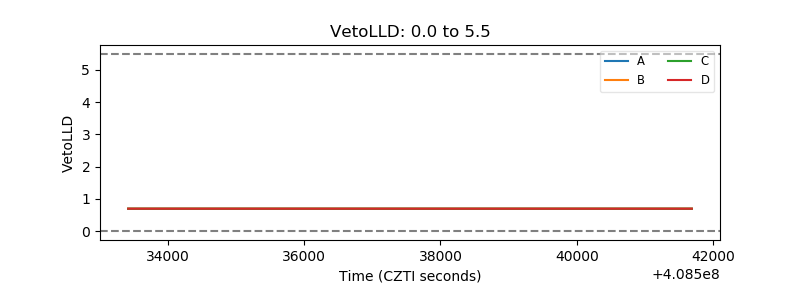 |
| Alpha Counter | 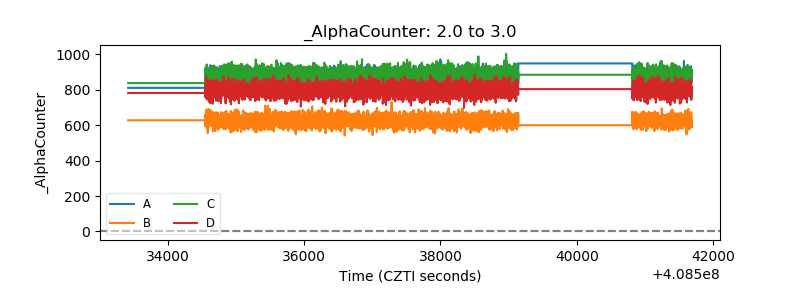 |
| _CPM_Rate | 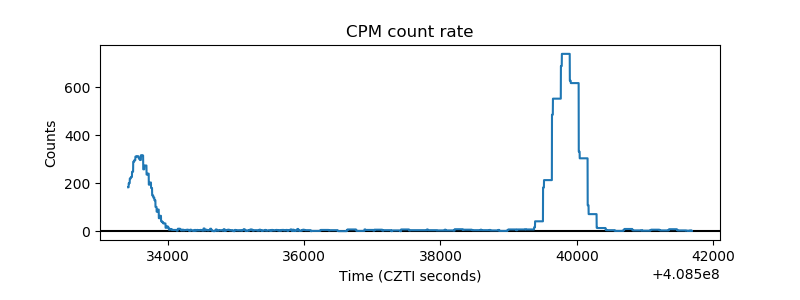 |
| CZT Counter | 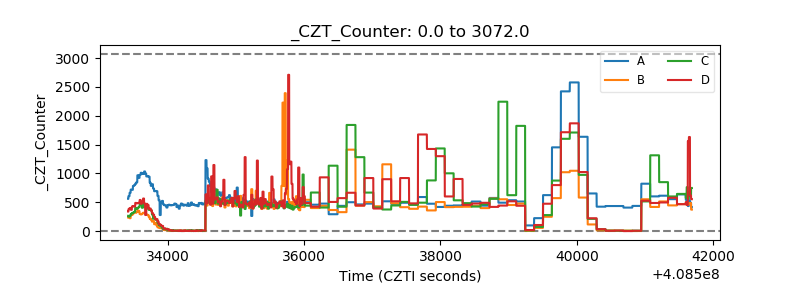 |
| +2.5 Volts monitor | 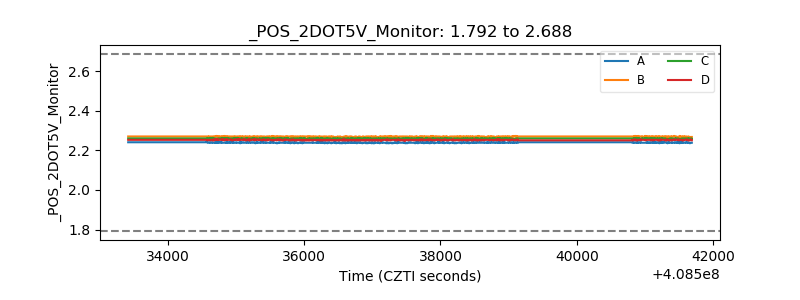 |
| +5 Volts monitor | 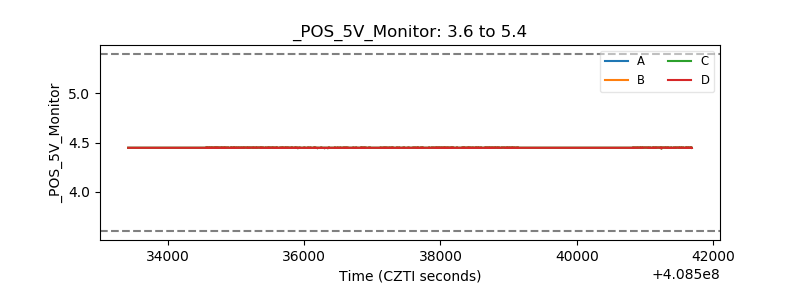 |
| _ROLL_ROT | 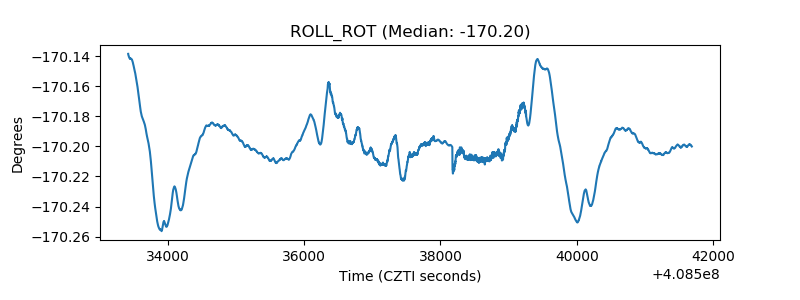 |
| _Roll_DEC | 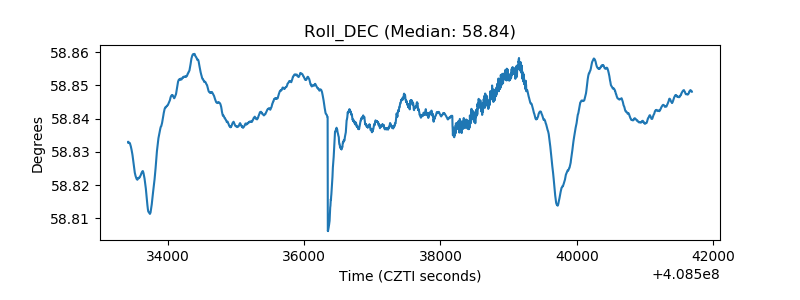 |
| _Roll_RA | 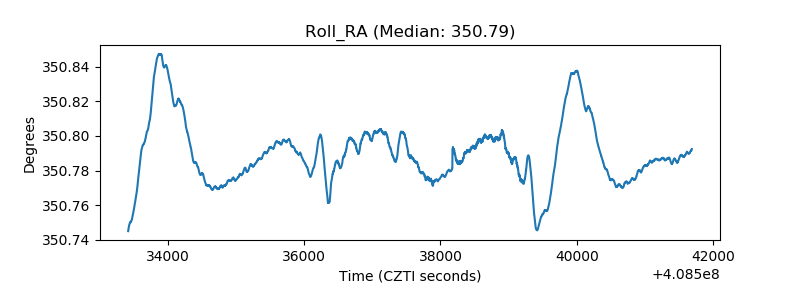 |
| Veto Counter | 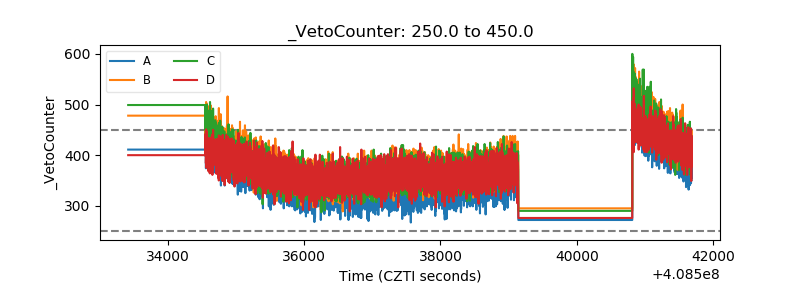 |