| Param | Original file | Final file |
|---|---|---|
| Filename | modeM0/AS1T05_064T01_9000005416_38966cztM0_level2.fits | modeM0/AS1T05_064T01_9000005416_38966cztM0_level2_quad_clean.evt |
| Size (bytes) | 402,079,680 | 95,181,120 |
| Size | 383.5 MB | 90.8 MB |
| Events in quadrant A | 2,977,334 | 665,789 |
| Events in quadrant B | 2,752,914 | 670,921 |
| Events in quadrant C | 5,201,745 | 565,934 |
| Events in quadrant D | 3,520,163 | 591,610 |
| Mode SS | |||
|---|---|---|---|
| Quadrant | BADHDUFLAG | Total packets | Discarded packets |
| A | 0 | 112 | 0 |
| B | 0 | 112 | 0 |
| C | 0 | 112 | 0 |
| D | 0 | 112 | 0 |
| Mode M9 | |||
|---|---|---|---|
| Quadrant | BADHDUFLAG | Total packets | Discarded packets |
| A | 0 | 19 | 0 |
| B | 0 | 19 | 0 |
| C | 0 | 19 | 0 |
| D | 0 | 20 | 0 |
| Mode M0 | |||
|---|---|---|---|
| Quadrant | BADHDUFLAG | Total packets | Discarded packets |
| A | 0 | 12237 | 2 |
| B | 0 | 11749 | 1 |
| C | 0 | 18929 | 1 |
| D | 0 | 14108 | 1 |
| Quadrant | Total seconds | Saturated seconds | Saturation percentage |
|---|---|---|---|
| A | 5548 | 18 | 0.324441% |
| B | 5548 | 13 | 0.234319% |
| C | 5548 | 747 | 13.464311% |
| D | 5548 | 112 | 2.018745% |
Noise dominated data is calculated using 1-second bins in cleaned event files. If a bin has >2000 counts, and if more than 50% of those come from <1% of pixels, then it is considered to be noise-dominated and hence unusable.
| Quadrant | # 1 sec bins | Bins with >0 counts | Bins with >2000 counts | High rate bins dominated by noise | Noise dominated (total time) | Noise dominated (detector-on time) | Marked lightcurve |
|---|---|---|---|---|---|---|---|
| A | 7342 | 5549 | 2 | 2 | 0.03% | 0.04% | 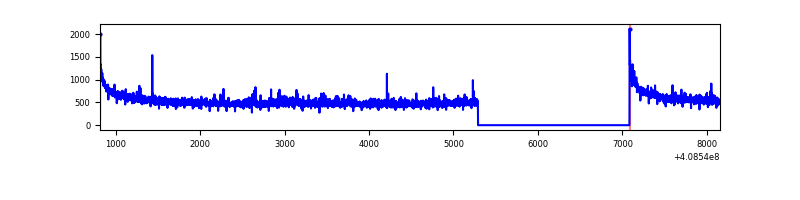 |
| B | 7342 | 5549 | 11 | 11 | 0.15% | 0.20% | 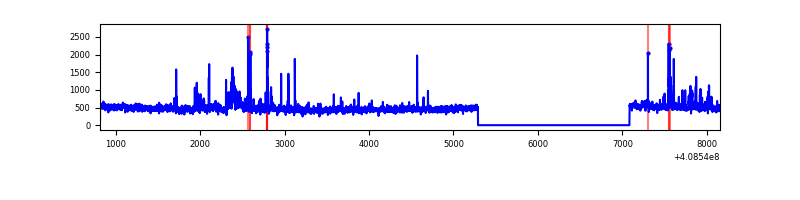 |
| C | 7342 | 5549 | 753 | 753 | 10.26% | 13.57% | 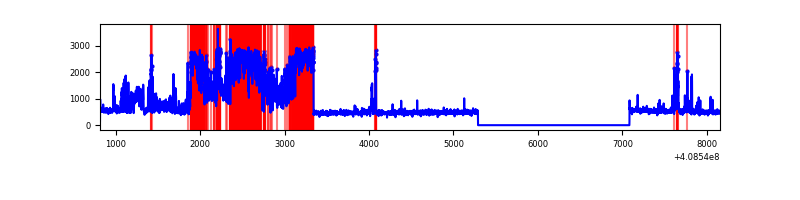 |
| D | 7342 | 5549 | 117 | 117 | 1.59% | 2.11% | 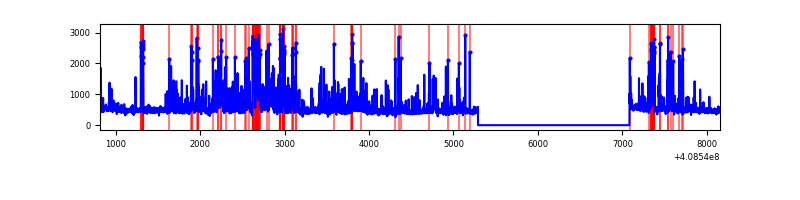 |
Top three noisy pixels from each quadrant. If the there are fewer than three noisy pixels in the level2.evt file, extra rows are filled as -1
| Pixel properties | Quadrant properties | ||||||
|---|---|---|---|---|---|---|---|
| Quadrant | DetID | PixID | Counts | Sigma | Mean | Median | Sigma |
| A | 10 | 83 | 451438 | 3525.77 | 633 | 619 | 127.9 |
| A | 15 | 222 | 45398 | 350.21 | 633 | 619 | 127.9 |
| A | 13 | 248 | 13113 | 97.71 | 633 | 619 | 127.9 |
| B | 5 | 172 | 177164 | 1483.03 | 624 | 607 | 119.1 |
| B | 0 | 230 | 89564 | 747.21 | 624 | 607 | 119.1 |
| B | 0 | 229 | 15804 | 127.65 | 624 | 607 | 119.1 |
| C | 14 | 254 | 2644725 | 19682.46 | 581 | 586 | 134.3 |
| C | 15 | 214 | 232315 | 1724.95 | 581 | 586 | 134.3 |
| C | 12 | 249 | 22111 | 160.23 | 581 | 586 | 134.3 |
| D | 2 | 250 | 307181 | 2053.21 | 615 | 598 | 149.3 |
| D | 12 | 233 | 280045 | 1871.48 | 615 | 598 | 149.3 |
| D | 2 | 249 | 134335 | 895.65 | 615 | 598 | 149.3 |
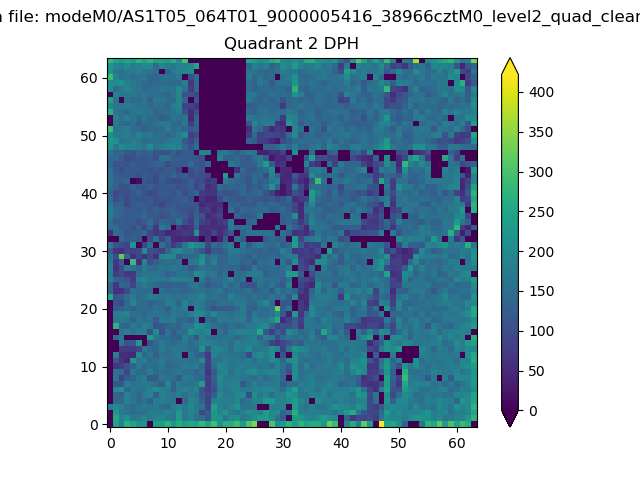
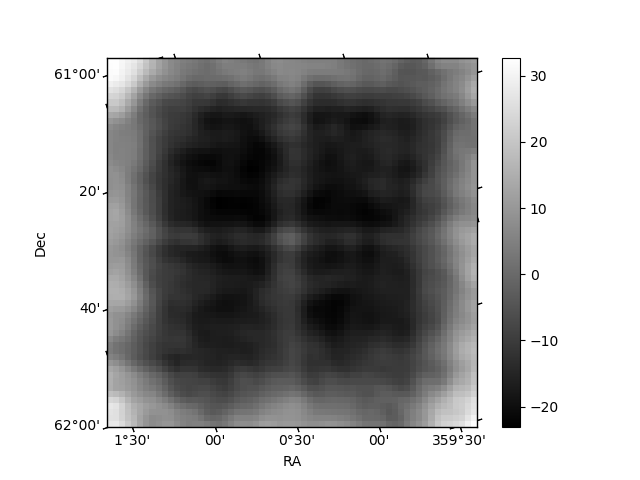
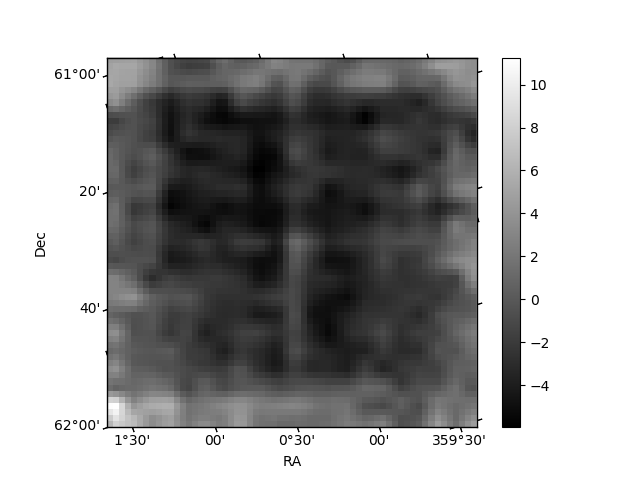
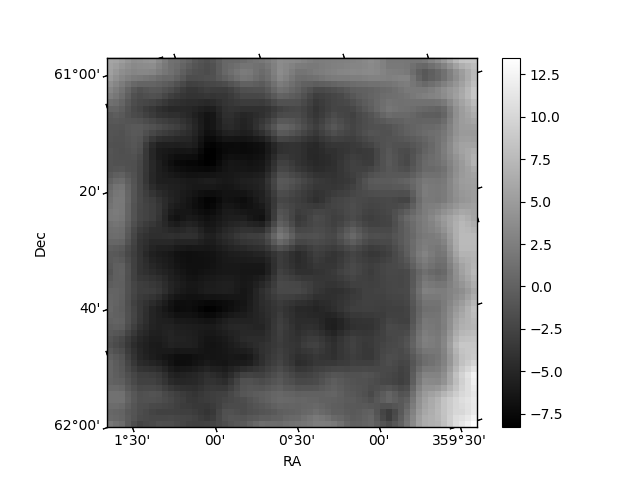
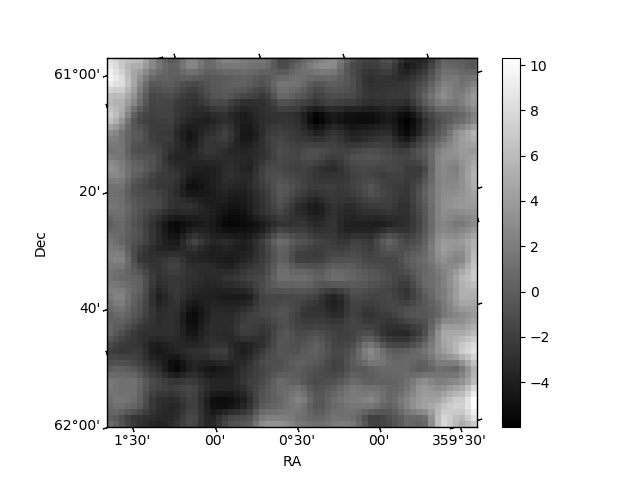
Histogram calculated using DETX and DETY for each event in the final _common_clean file
| Quadrant A | 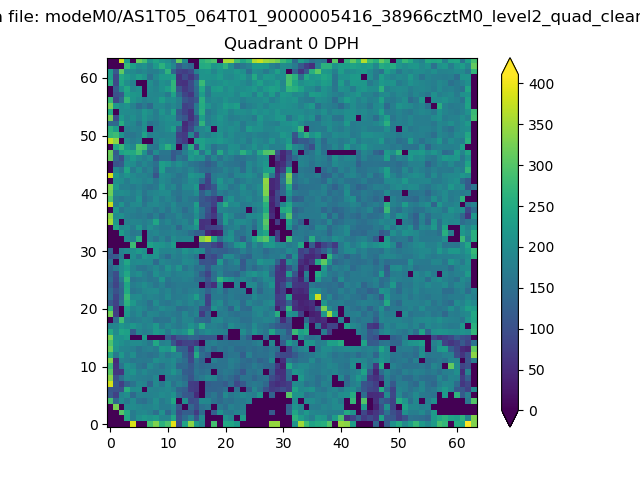 |
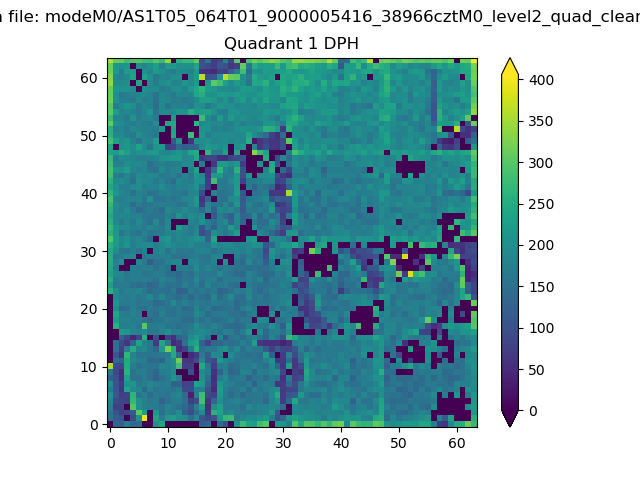 |
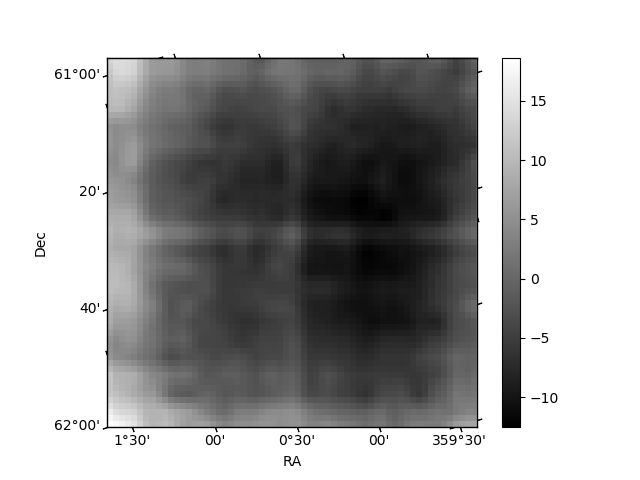
Quadrant B |
|---|---|---|---|
| Quadrant D | 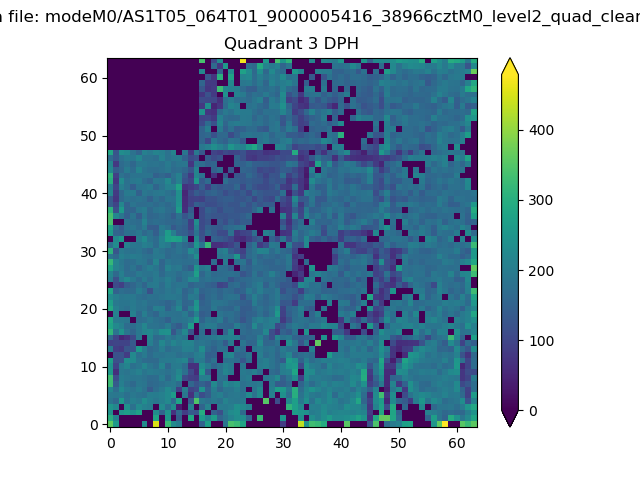 |
 |
Quadrant C |
| Plot type | Count rate plots | Images |
|---|---|---|
| Comparison with Poisson distribution Blue bars denote a histogram of data divided into 1 sec bins. Red curve is a Poisson curve with rate = median count rate of data. |
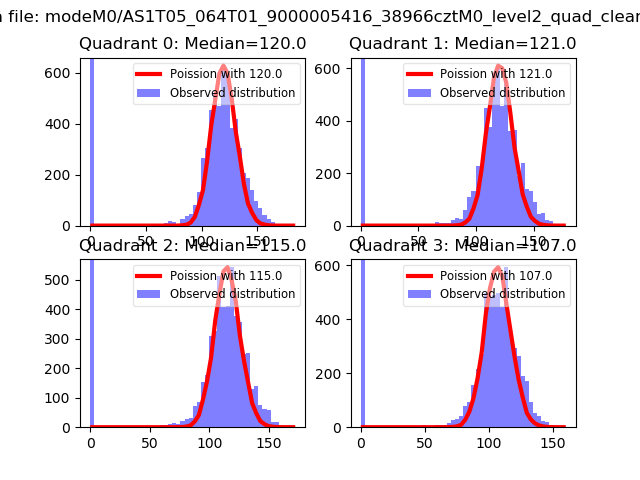 |
 |
| Quadrant-wise count rates Data is divided into 100 sec bins |
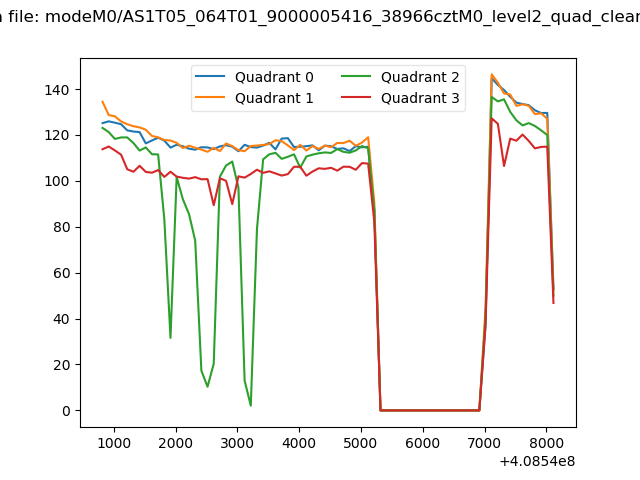 |
|
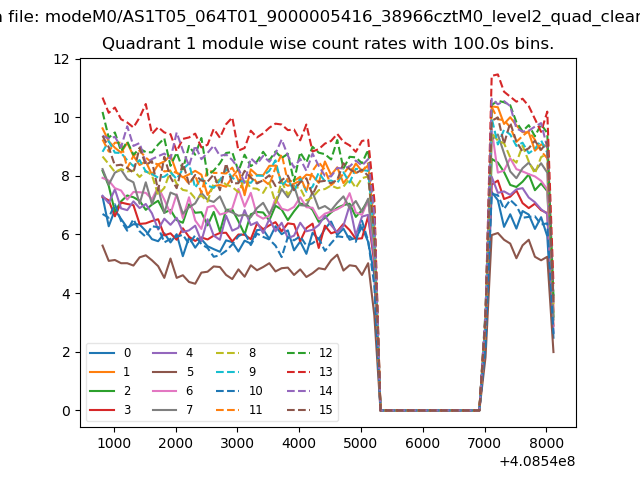
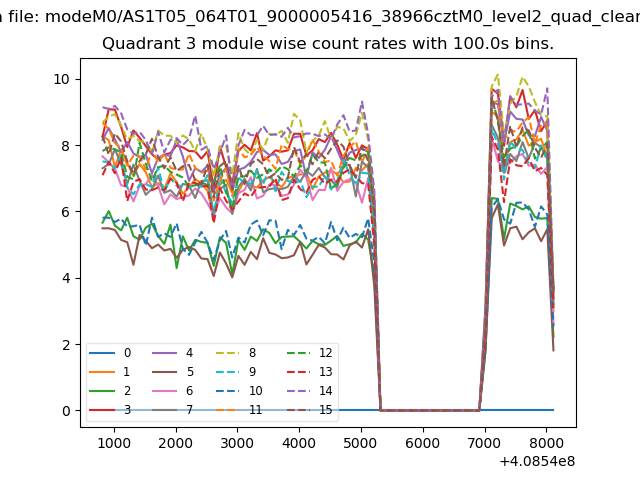
| Module-wise count rates for Quadrant A Data is divided into 100 sec bins |
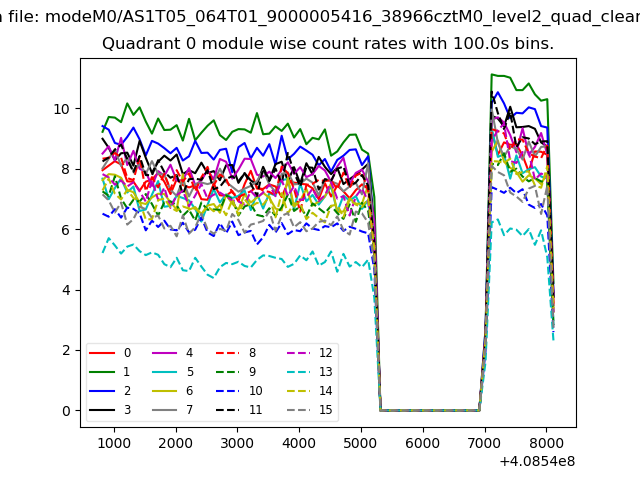 |
 |
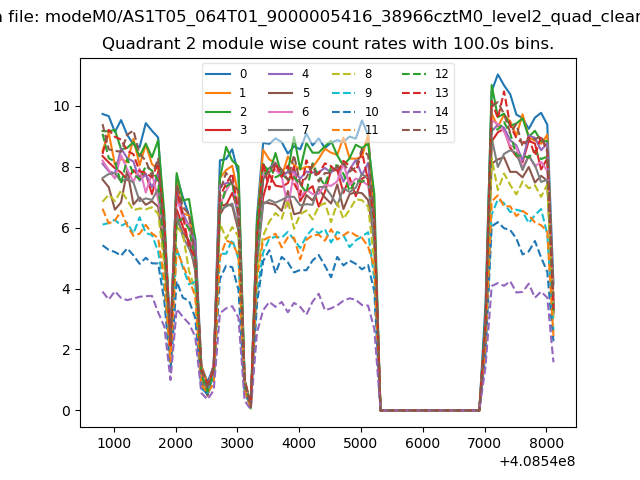
| Module-wise count rates for Quadrant B Data is divided into 100 sec bins |
 |
 |
| Module-wise count rates for Quadrant C Data is divided into 100 sec bins |
 |
 |
| Module-wise count rates for Quadrant D Data is divided into 100 sec bins |
 |
 |
| Parameter | Plot |
|---|---|
| CZT HV Monitor | 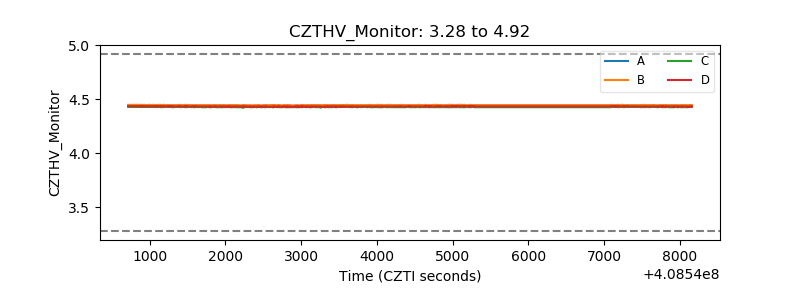 |
| D_VDD | 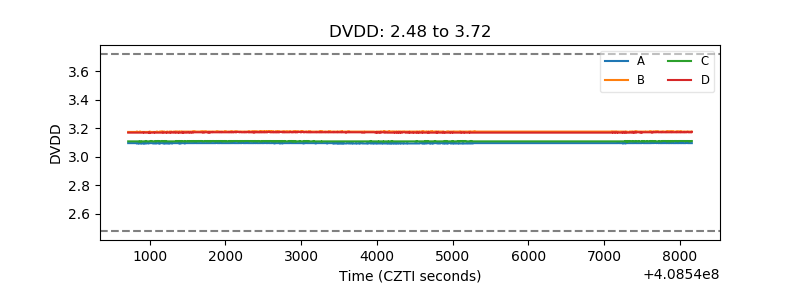 |
| Temperature 1 | 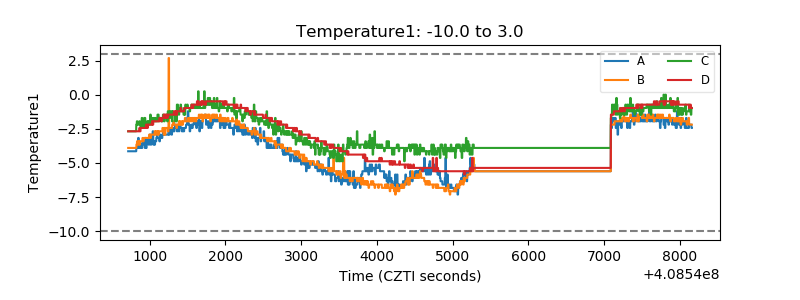 |
| Veto HV Monitor | 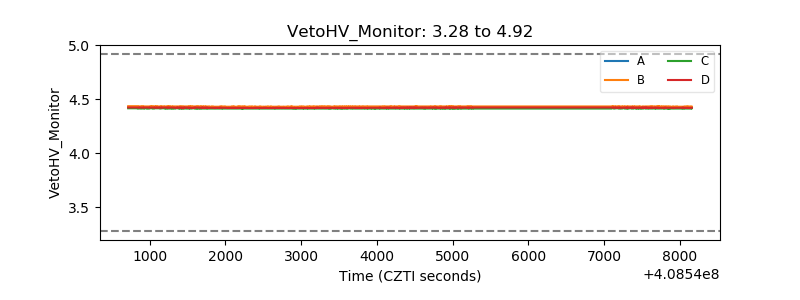 |
| Veto LLD | 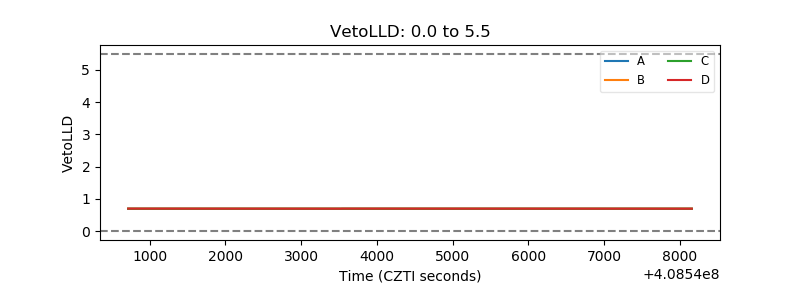 |
| Alpha Counter | 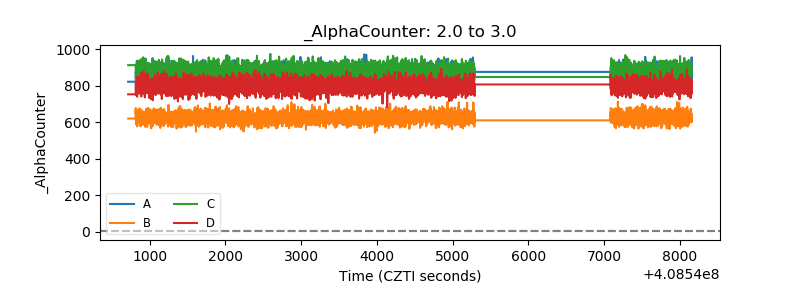 |
| _CPM_Rate | 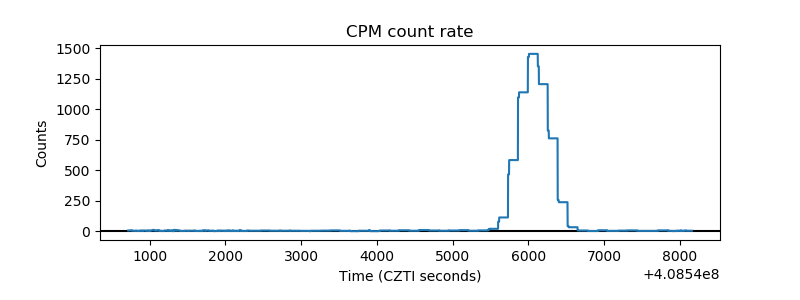 |
| CZT Counter | 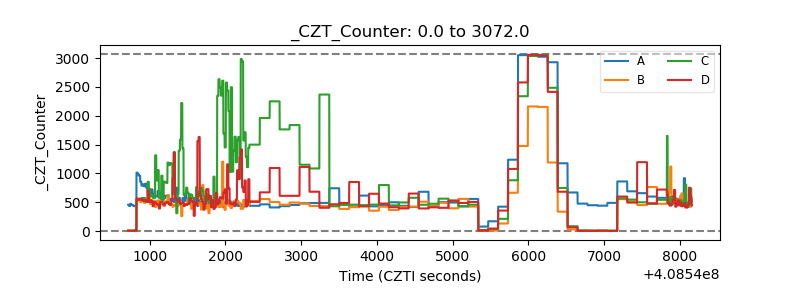 |
| +2.5 Volts monitor | 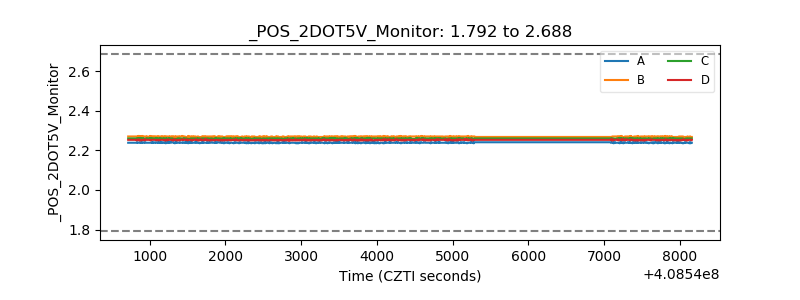 |
| +5 Volts monitor |  |
| _ROLL_ROT | 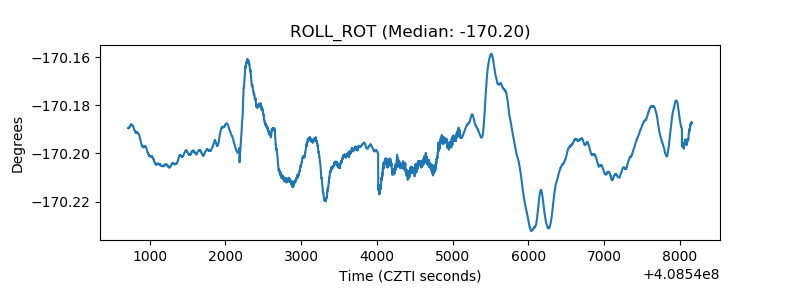 |
| _Roll_DEC | 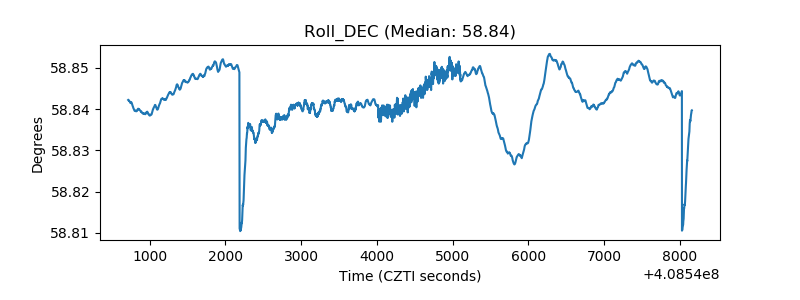 |
| _Roll_RA | 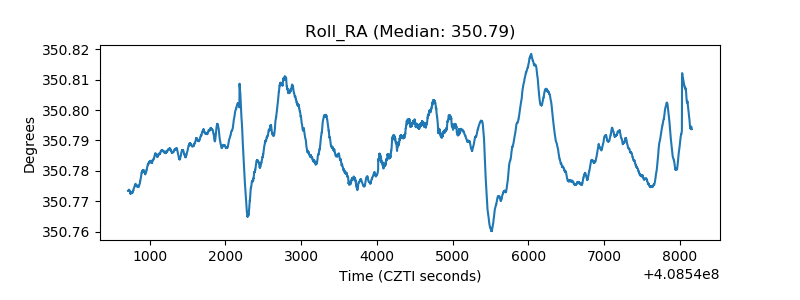 |
| Veto Counter | 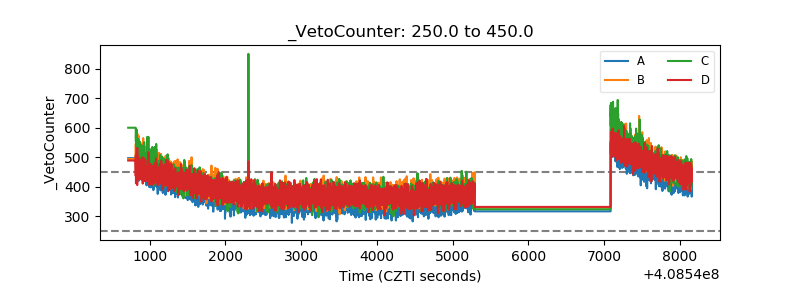 |