| Param | Original file | Final file |
|---|---|---|
| Filename | modeM0/AS1T05_064T01_9000005416_38967cztM0_level2.fits | modeM0/AS1T05_064T01_9000005416_38967cztM0_level2_quad_clean.evt |
| Size (bytes) | 336,646,080 | 93,971,520 |
| Size | 321.1 MB | 89.6 MB |
| Events in quadrant A | 2,880,579 | 647,174 |
| Events in quadrant B | 2,623,889 | 651,147 |
| Events in quadrant C | 3,119,831 | 619,684 |
| Events in quadrant D | 3,438,525 | 568,995 |
| Mode SS | |||
|---|---|---|---|
| Quadrant | BADHDUFLAG | Total packets | Discarded packets |
| A | 0 | 104 | 0 |
| B | 0 | 104 | 0 |
| C | 0 | 104 | 0 |
| D | 0 | 104 | 0 |
| Mode M9 | |||
|---|---|---|---|
| Quadrant | BADHDUFLAG | Total packets | Discarded packets |
| A | 0 | 20 | 0 |
| B | 0 | 20 | 0 |
| C | 0 | 20 | 0 |
| D | 0 | 20 | 0 |
| Mode M0 | |||
|---|---|---|---|
| Quadrant | BADHDUFLAG | Total packets | Discarded packets |
| A | 0 | 11743 | 3 |
| B | 0 | 11061 | 2 |
| C | 0 | 12341 | 2 |
| D | 0 | 13640 | 2 |
| Quadrant | Total seconds | Saturated seconds | Saturation percentage |
|---|---|---|---|
| A | 5119 | 31 | 0.605587% |
| B | 5119 | 49 | 0.957218% |
| C | 5119 | 77 | 1.504200% |
| D | 5119 | 199 | 3.887478% |
Noise dominated data is calculated using 1-second bins in cleaned event files. If a bin has >2000 counts, and if more than 50% of those come from <1% of pixels, then it is considered to be noise-dominated and hence unusable.
| Quadrant | # 1 sec bins | Bins with >0 counts | Bins with >2000 counts | High rate bins dominated by noise | Noise dominated (total time) | Noise dominated (detector-on time) | Marked lightcurve |
|---|---|---|---|---|---|---|---|
| A | 7063 | 5120 | 24 | 24 | 0.34% | 0.47% | 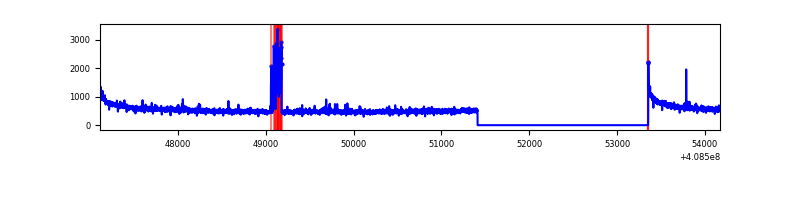 |
| B | 7063 | 5120 | 35 | 35 | 0.50% | 0.68% | 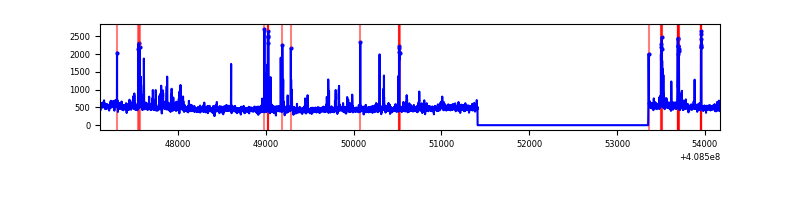 |
| C | 7063 | 5120 | 76 | 76 | 1.08% | 1.48% | 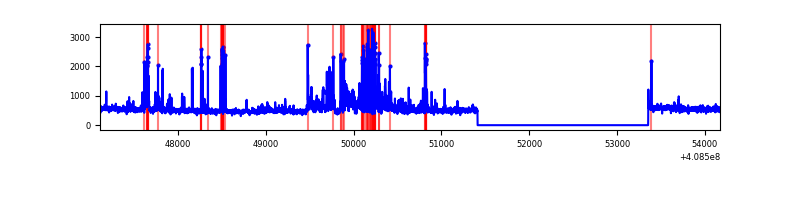 |
| D | 7063 | 5120 | 183 | 183 | 2.59% | 3.57% | 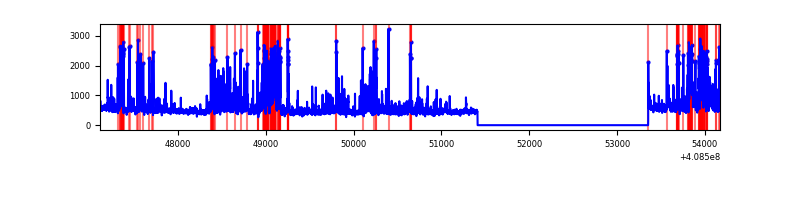 |
Top three noisy pixels from each quadrant. If the there are fewer than three noisy pixels in the level2.evt file, extra rows are filled as -1
| Pixel properties | Quadrant properties | ||||||
|---|---|---|---|---|---|---|---|
| Quadrant | DetID | PixID | Counts | Sigma | Mean | Median | Sigma |
| A | 10 | 83 | 422859 | 3495.27 | 597 | 585 | 120.8 |
| A | 15 | 174 | 111279 | 916.24 | 597 | 585 | 120.8 |
| A | 13 | 248 | 17059 | 136.36 | 597 | 585 | 120.8 |
| B | 5 | 172 | 199593 | 1777.87 | 589 | 573 | 111.9 |
| B | 0 | 230 | 50107 | 442.49 | 589 | 573 | 111.9 |
| B | 0 | 199 | 17993 | 155.61 | 589 | 573 | 111.9 |
| C | 14 | 254 | 574646 | 4323.96 | 579 | 584 | 132.8 |
| C | 15 | 214 | 224903 | 1689.62 | 579 | 584 | 132.8 |
| C | 12 | 249 | 19574 | 143.04 | 579 | 584 | 132.8 |
| D | 2 | 249 | 672116 | 4806.53 | 581 | 565 | 139.7 |
| D | 12 | 233 | 208120 | 1485.54 | 581 | 565 | 139.7 |
| D | 12 | 227 | 117705 | 838.41 | 581 | 565 | 139.7 |
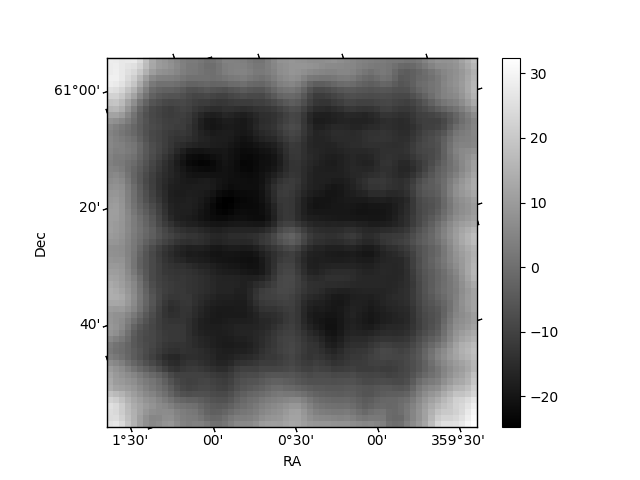
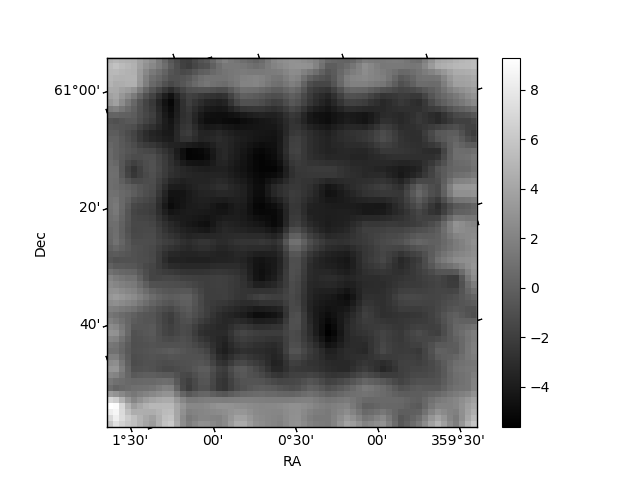
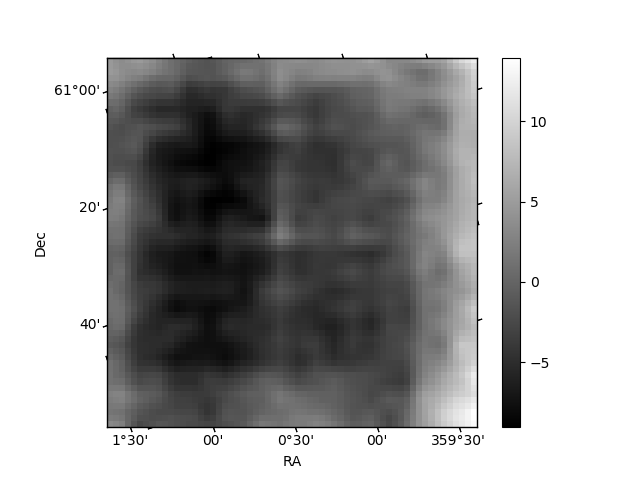
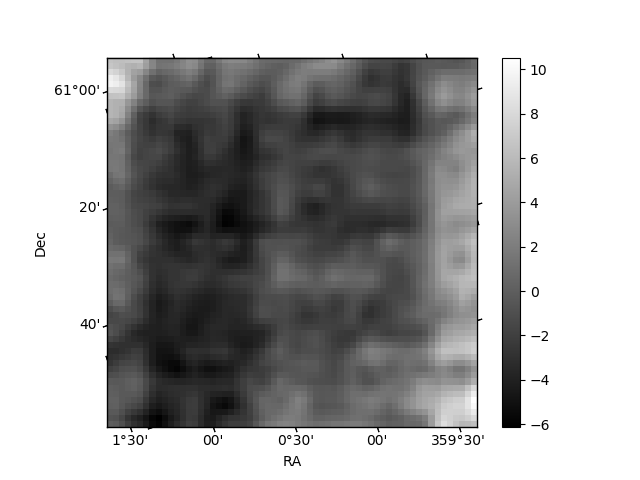
Histogram calculated using DETX and DETY for each event in the final _common_clean file
| Quadrant A | 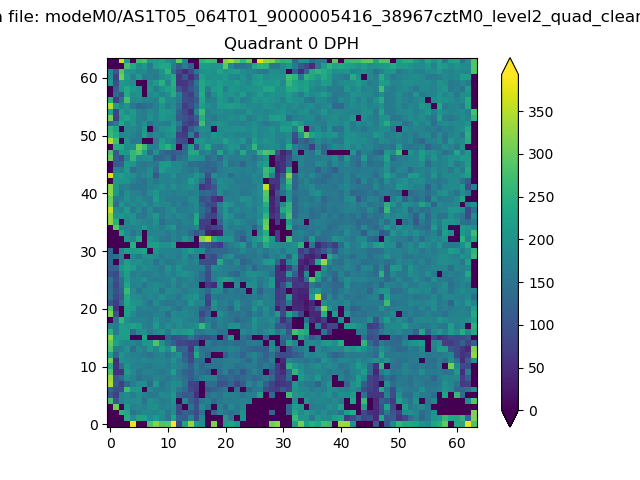 |
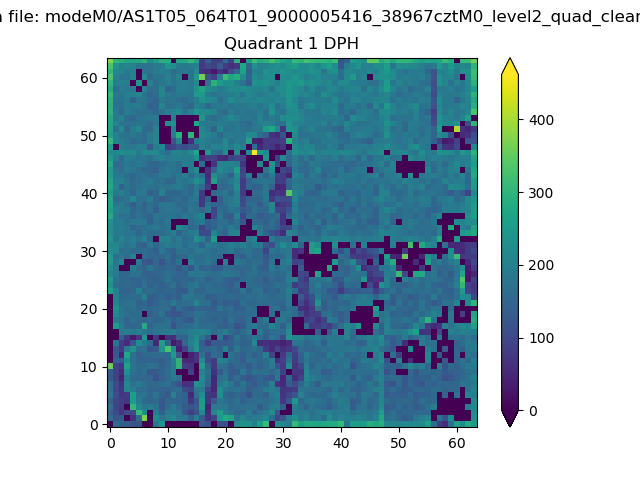 |
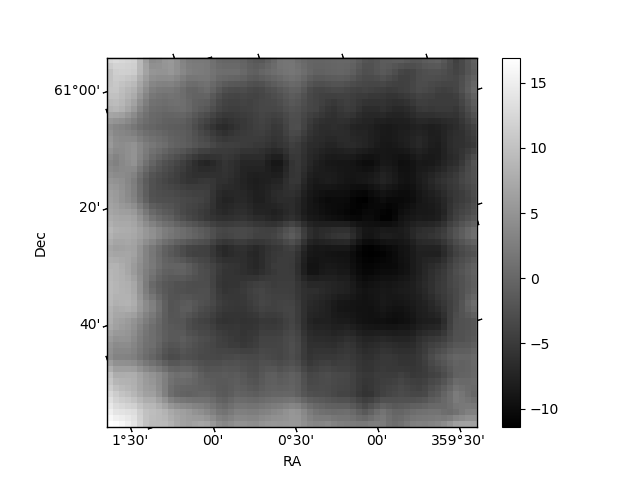
Quadrant B |
|---|---|---|---|
| Quadrant D | 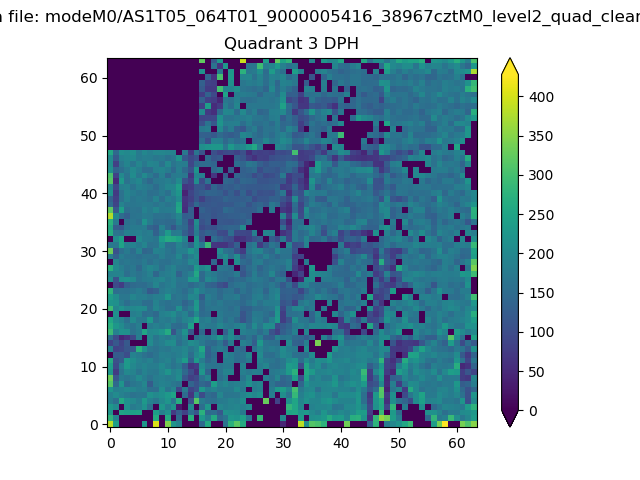 |
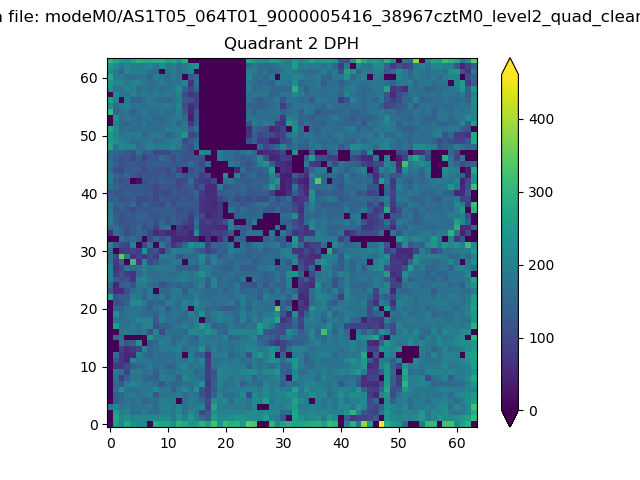 |
Quadrant C |
| Plot type | Count rate plots | Images |
|---|---|---|
| Comparison with Poisson distribution Blue bars denote a histogram of data divided into 1 sec bins. Red curve is a Poisson curve with rate = median count rate of data. |
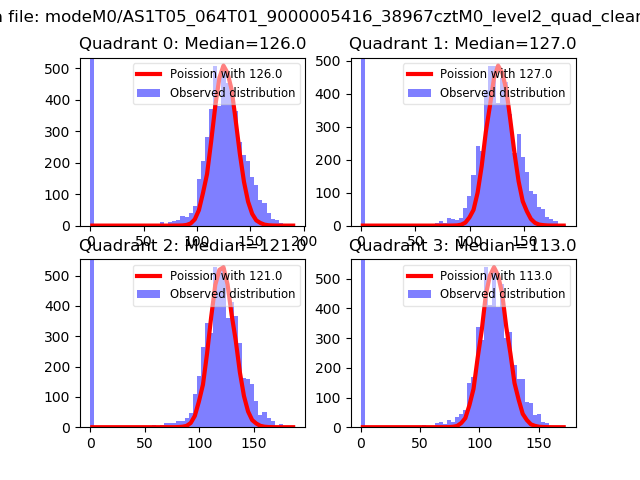 |
 |
| Quadrant-wise count rates Data is divided into 100 sec bins |
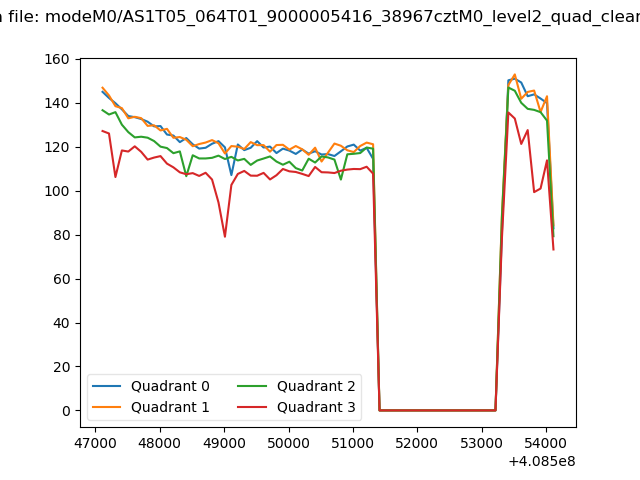 |
|
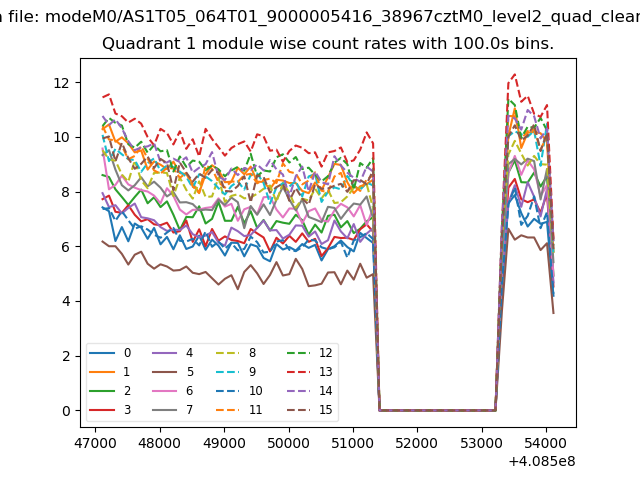
| Module-wise count rates for Quadrant A Data is divided into 100 sec bins |
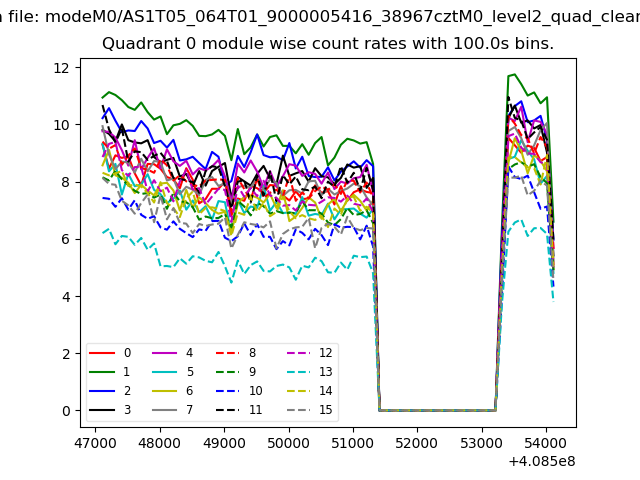 |
 |
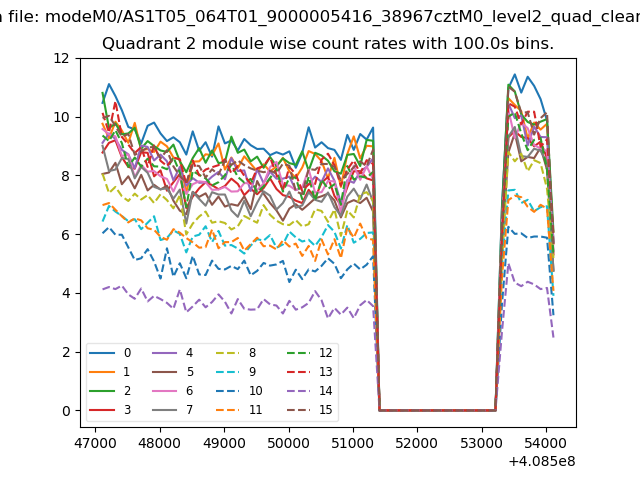
| Module-wise count rates for Quadrant B Data is divided into 100 sec bins |
 |
 |
| Module-wise count rates for Quadrant C Data is divided into 100 sec bins |
 |
 |
| Module-wise count rates for Quadrant D Data is divided into 100 sec bins |
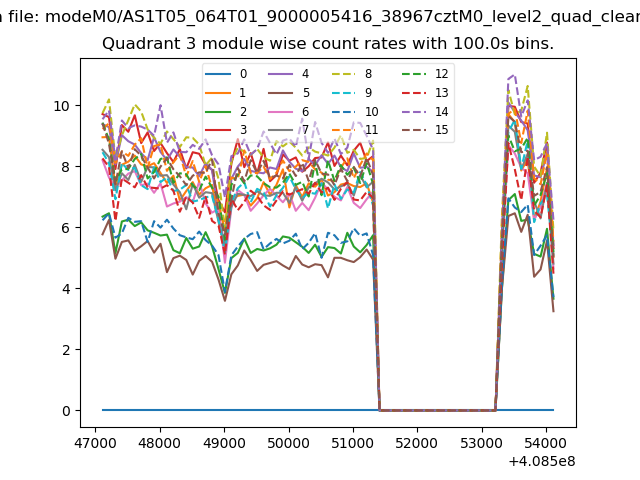 |
 |
| Parameter | Plot |
|---|---|
| CZT HV Monitor | 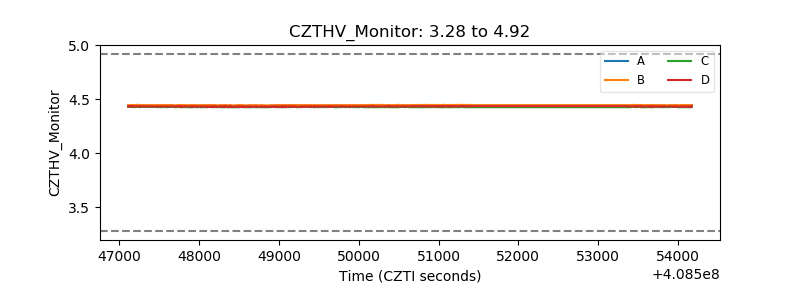 |
| D_VDD | 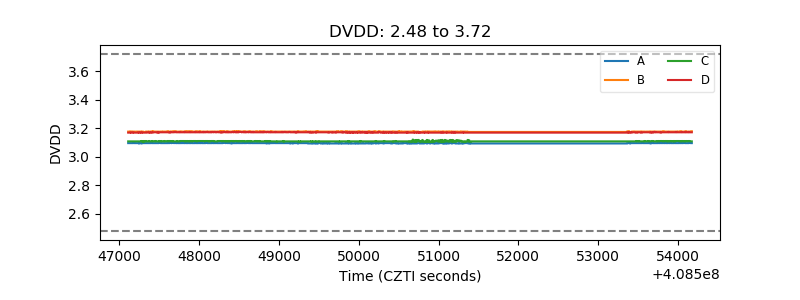 |
| Temperature 1 | 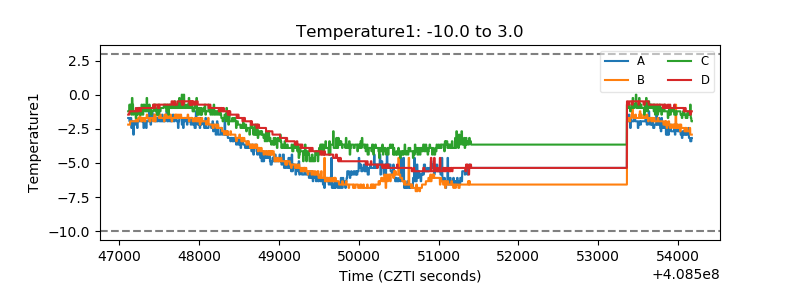 |
| Veto HV Monitor | 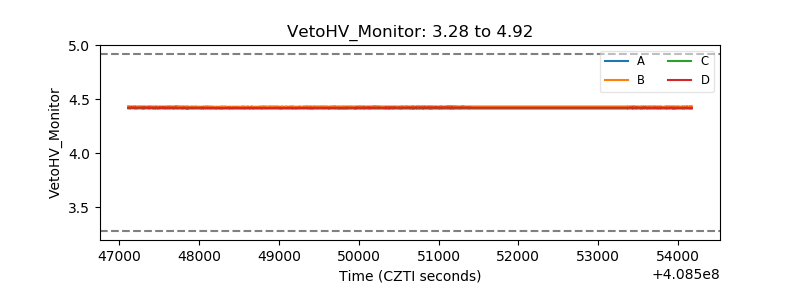 |
| Veto LLD | 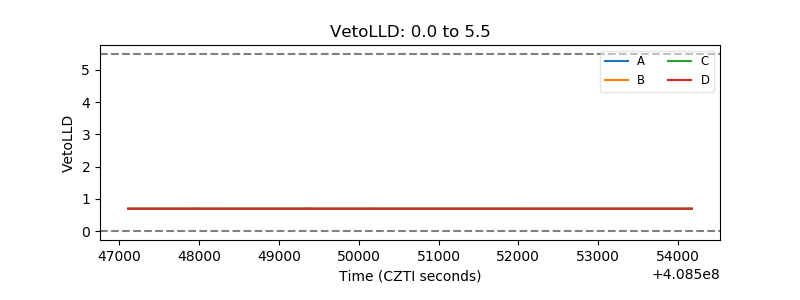 |
| Alpha Counter | 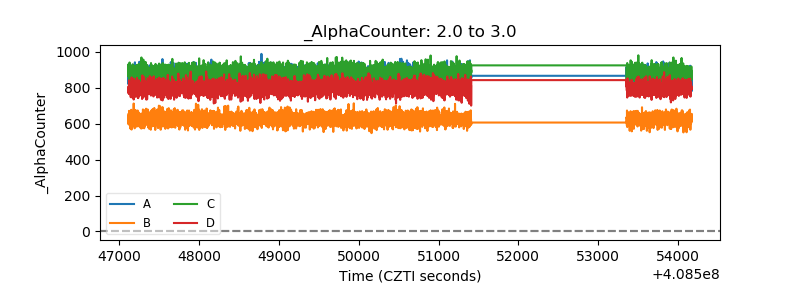 |
| _CPM_Rate | 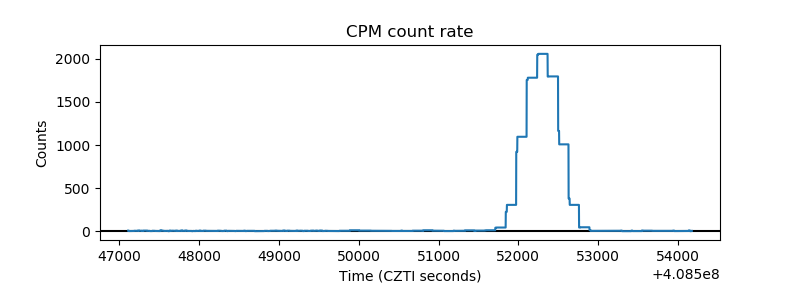 |
| CZT Counter | 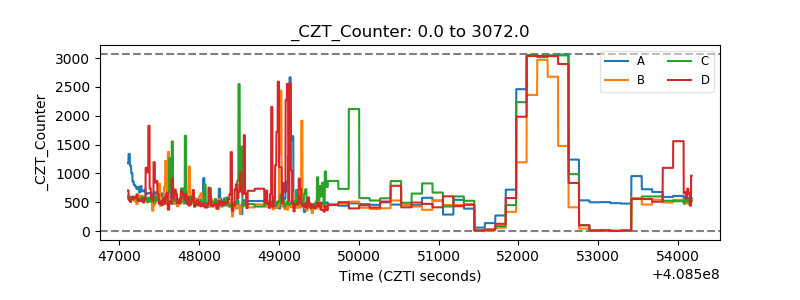 |
| +2.5 Volts monitor | 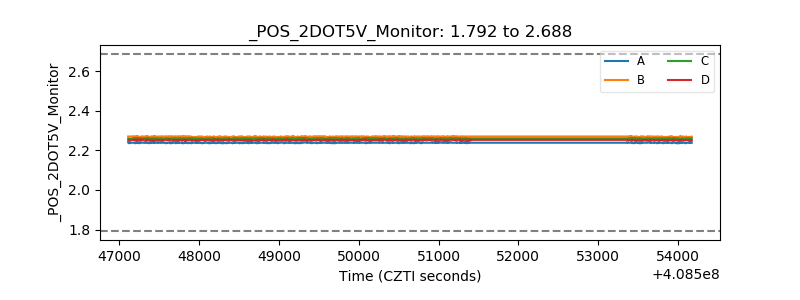 |
| +5 Volts monitor | 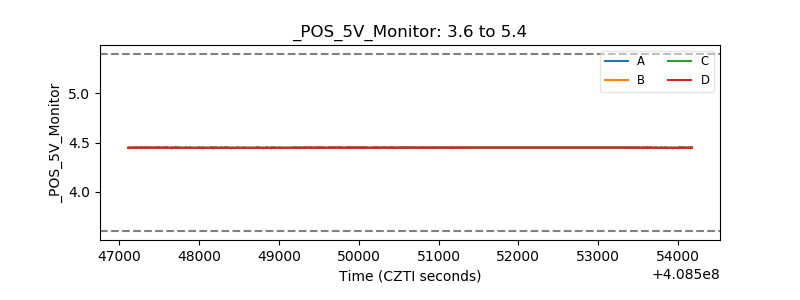 |
| _ROLL_ROT | 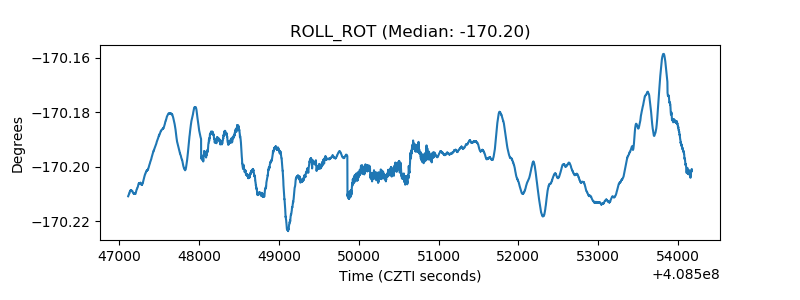 |
| _Roll_DEC | 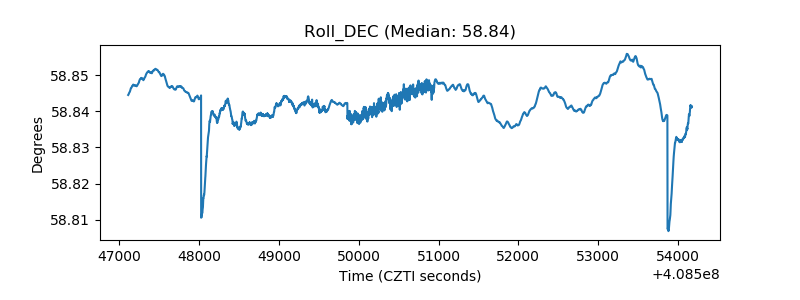 |
| _Roll_RA | 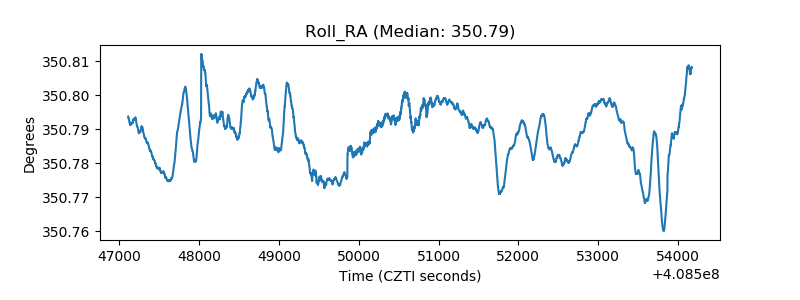 |
| Veto Counter | 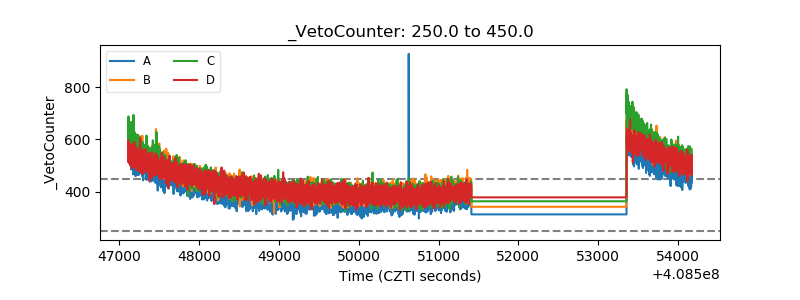 |