| Param | Original file | Final file |
|---|---|---|
| Filename | modeM0/AS1A12_057T01_9000005418_38968cztM0_level2.fits | modeM0/AS1A12_057T01_9000005418_38968cztM0_level2_quad_clean.evt |
| Size (bytes) | 196,041,600 | 57,643,200 |
| Size | 187.0 MB | 55.0 MB |
| Events in quadrant A | 1,698,297 | 397,883 |
| Events in quadrant B | 1,690,158 | 403,371 |
| Events in quadrant C | 1,563,382 | 388,550 |
| Events in quadrant D | 2,066,352 | 339,408 |
| Mode M9 | |||
|---|---|---|---|
| Quadrant | BADHDUFLAG | Total packets | Discarded packets |
| A | 0 | 21 | 0 |
| B | 0 | 21 | 0 |
| C | 0 | 21 | 0 |
| D | 0 | 21 | 0 |
| Mode SS | |||
|---|---|---|---|
| Quadrant | BADHDUFLAG | Total packets | Discarded packets |
| A | 0 | 62 | 0 |
| B | 0 | 62 | 0 |
| C | 0 | 62 | 0 |
| D | 0 | 62 | 0 |
| Mode M0 | |||
|---|---|---|---|
| Quadrant | BADHDUFLAG | Total packets | Discarded packets |
| A | 0 | 6990 | 2 |
| B | 0 | 6995 | 1 |
| C | 0 | 6590 | 1 |
| D | 0 | 8266 | 1 |
| Quadrant | Total seconds | Saturated seconds | Saturation percentage |
|---|---|---|---|
| A | 3041 | 12 | 0.394607% |
| B | 3041 | 36 | 1.183821% |
| C | 3041 | 2 | 0.065768% |
| D | 3041 | 192 | 6.313713% |
Noise dominated data is calculated using 1-second bins in cleaned event files. If a bin has >2000 counts, and if more than 50% of those come from <1% of pixels, then it is considered to be noise-dominated and hence unusable.
| Quadrant | # 1 sec bins | Bins with >0 counts | Bins with >2000 counts | High rate bins dominated by noise | Noise dominated (total time) | Noise dominated (detector-on time) | Marked lightcurve |
|---|---|---|---|---|---|---|---|
| A | 5074 | 3042 | 6 | 6 | 0.12% | 0.20% | 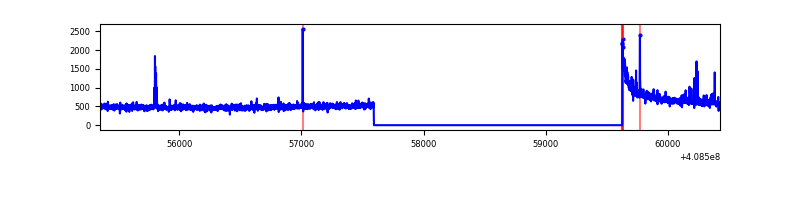 |
| B | 5074 | 3042 | 29 | 29 | 0.57% | 0.95% | 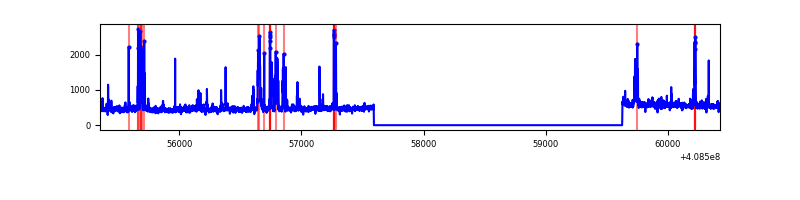 |
| C | 5074 | 3042 | 1 | 1 | 0.02% | 0.03% | 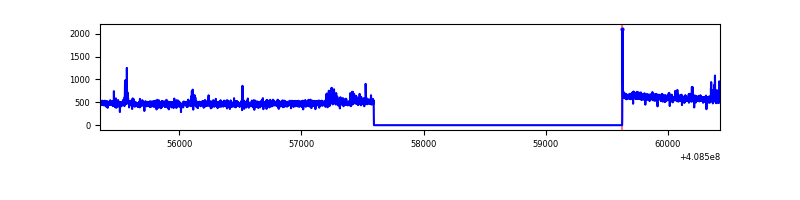 |
| D | 5074 | 3042 | 184 | 184 | 3.63% | 6.05% | 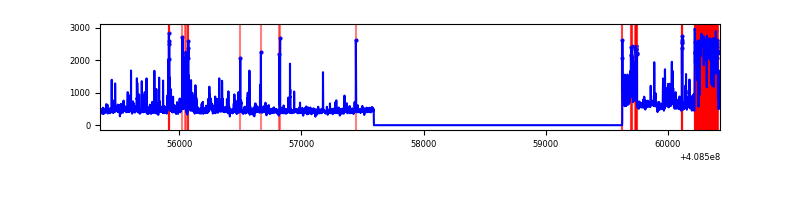 |
Top three noisy pixels from each quadrant. If the there are fewer than three noisy pixels in the level2.evt file, extra rows are filled as -1
| Pixel properties | Quadrant properties | ||||||
|---|---|---|---|---|---|---|---|
| Quadrant | DetID | PixID | Counts | Sigma | Mean | Median | Sigma |
| A | 10 | 83 | 235048 | 3166.0 | 361 | 355 | 74.1 |
| A | 13 | 248 | 58070 | 778.57 | 361 | 355 | 74.1 |
| A | 13 | 6 | 6171 | 78.46 | 361 | 355 | 74.1 |
| B | 5 | 172 | 145535 | 2114.78 | 360 | 352 | 68.7 |
| B | 5 | 184 | 91107 | 1321.96 | 360 | 352 | 68.7 |
| B | 0 | 230 | 22021 | 315.64 | 360 | 352 | 68.7 |
| C | 15 | 214 | 133413 | 1601.97 | 355 | 358 | 83.1 |
| C | 14 | 254 | 36881 | 439.73 | 355 | 358 | 83.1 |
| C | 0 | 10 | 4572 | 50.74 | 355 | 358 | 83.1 |
| D | 2 | 249 | 471779 | 5662.47 | 342 | 332 | 83.3 |
| D | 12 | 227 | 96091 | 1150.14 | 342 | 332 | 83.3 |
| D | 2 | 250 | 47523 | 566.8 | 342 | 332 | 83.3 |
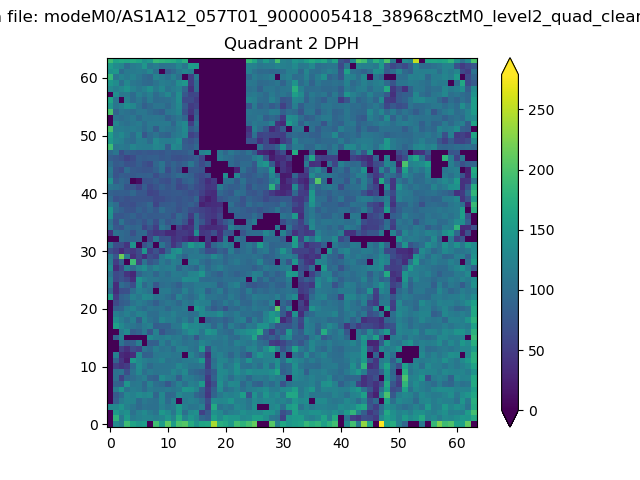
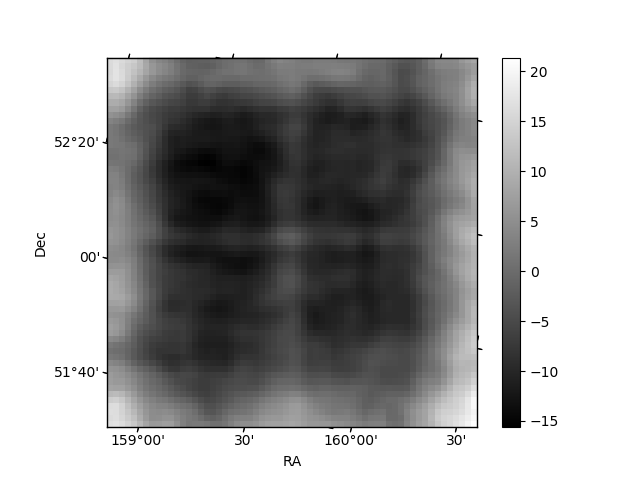
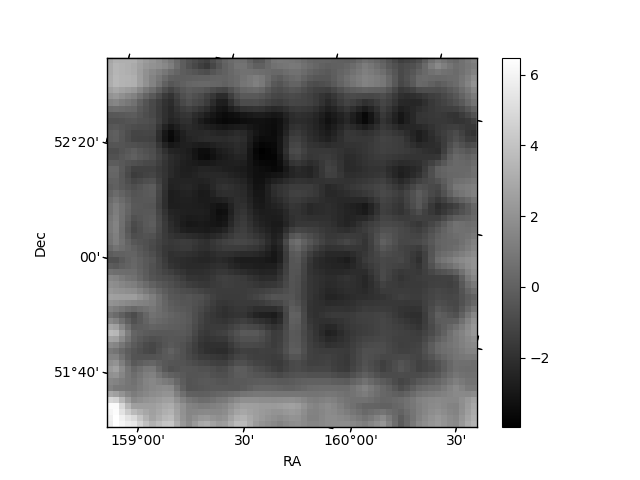
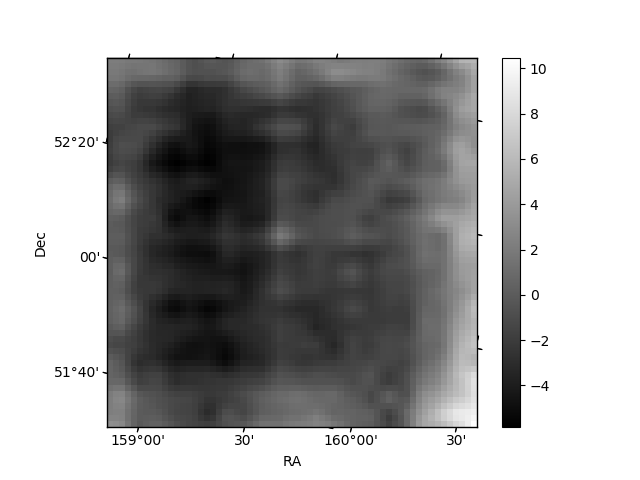
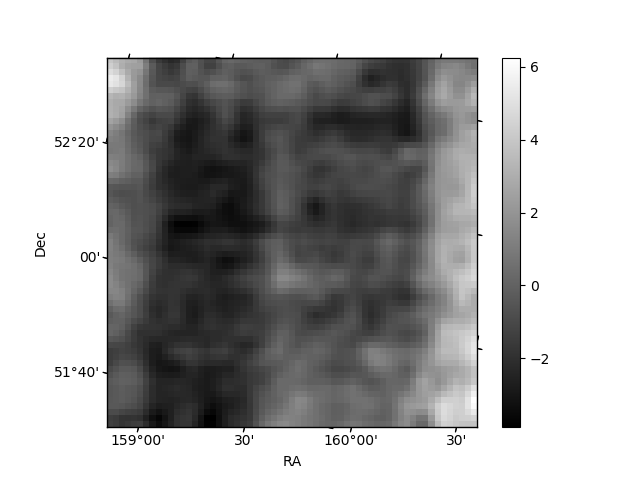
Histogram calculated using DETX and DETY for each event in the final _common_clean file
| Quadrant A | 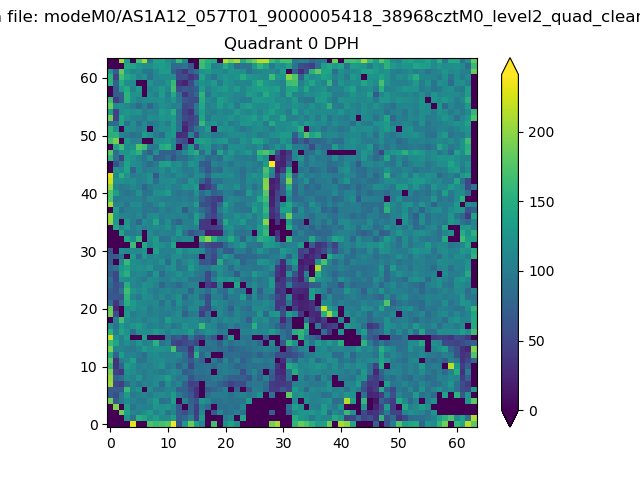 |
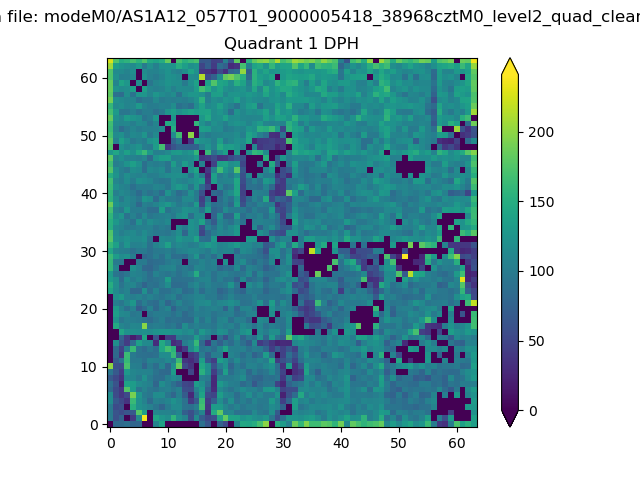 |
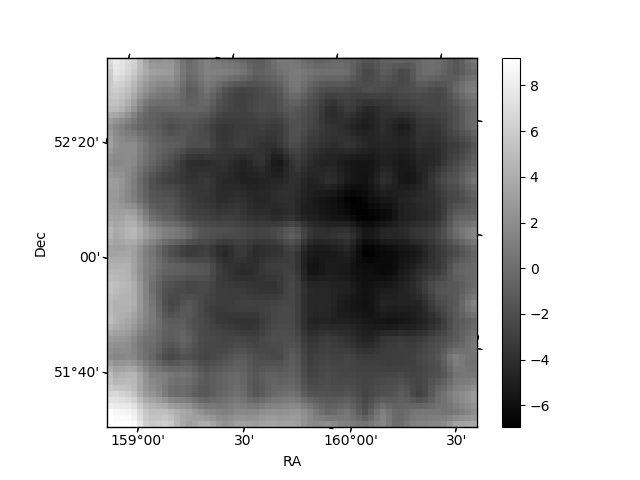
Quadrant B |
|---|---|---|---|
| Quadrant D | 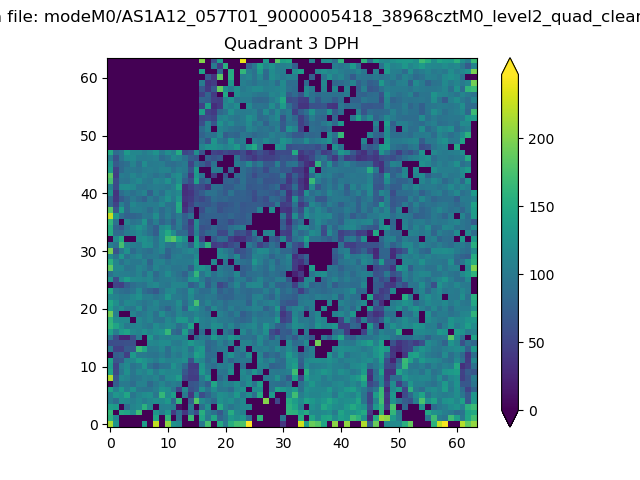 |
 |
Quadrant C |
| Plot type | Count rate plots | Images |
|---|---|---|
| Comparison with Poisson distribution Blue bars denote a histogram of data divided into 1 sec bins. Red curve is a Poisson curve with rate = median count rate of data. |
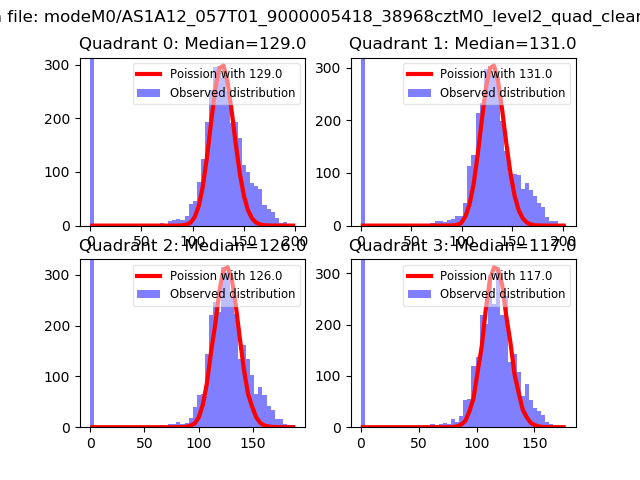 |
 |
| Quadrant-wise count rates Data is divided into 100 sec bins |
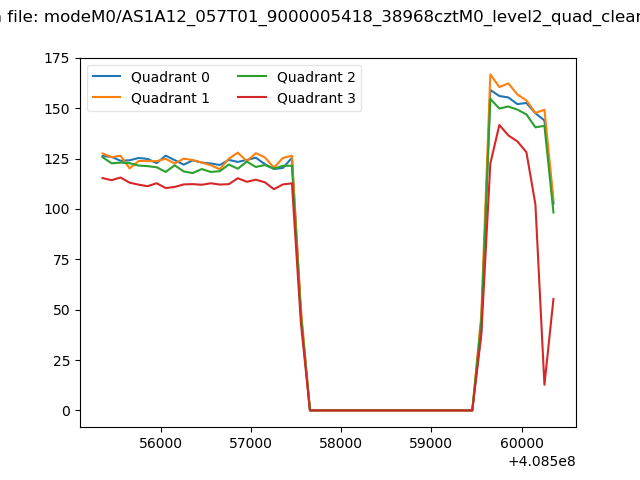 |
|
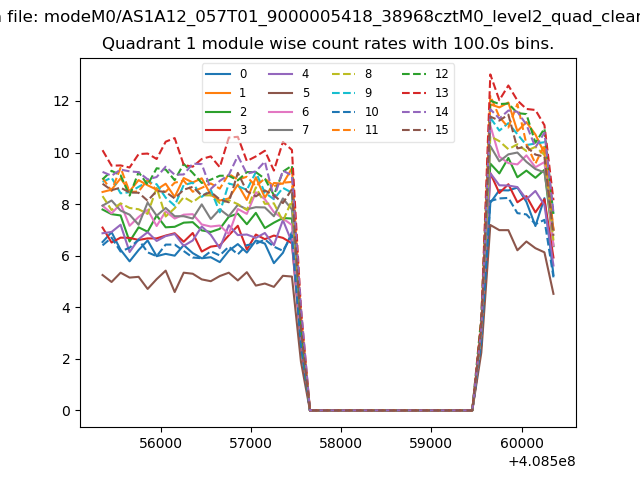
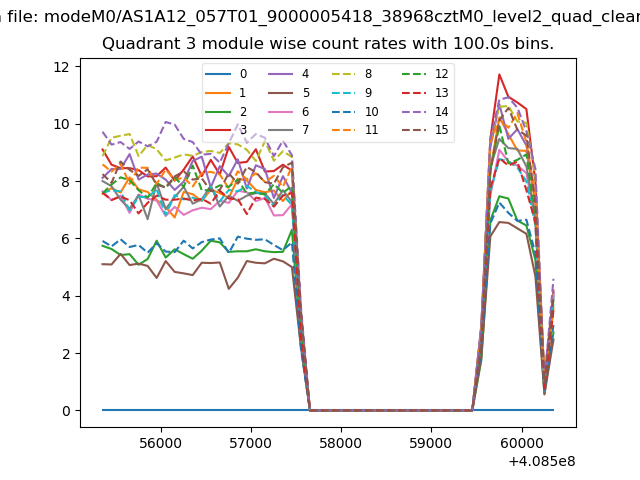
| Module-wise count rates for Quadrant A Data is divided into 100 sec bins |
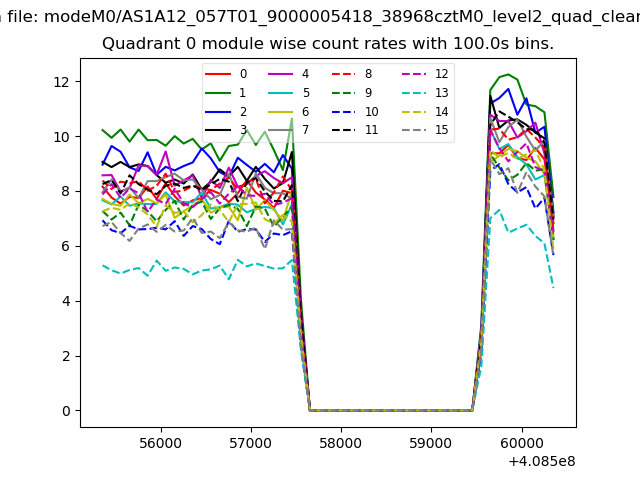 |
 |
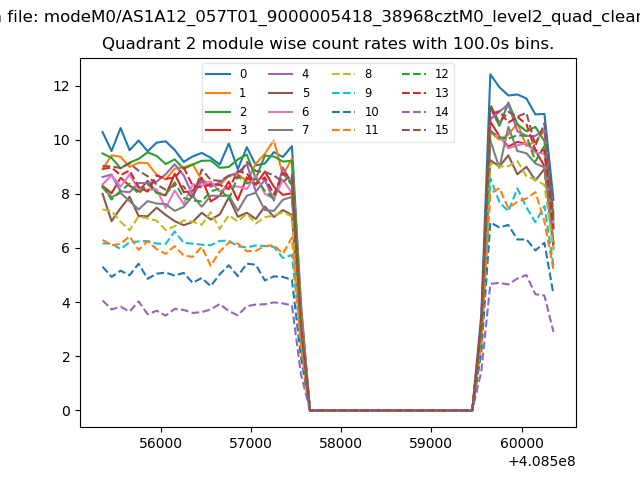
| Module-wise count rates for Quadrant B Data is divided into 100 sec bins |
 |
 |
| Module-wise count rates for Quadrant C Data is divided into 100 sec bins |
 |
 |
| Module-wise count rates for Quadrant D Data is divided into 100 sec bins |
 |
 |
| Parameter | Plot |
|---|---|
| CZT HV Monitor |  |
| D_VDD | 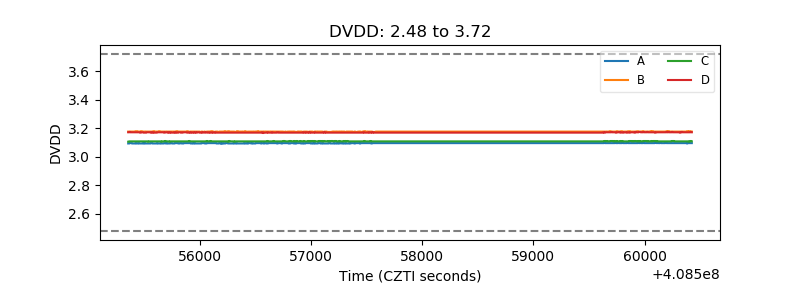 |
| Temperature 1 | 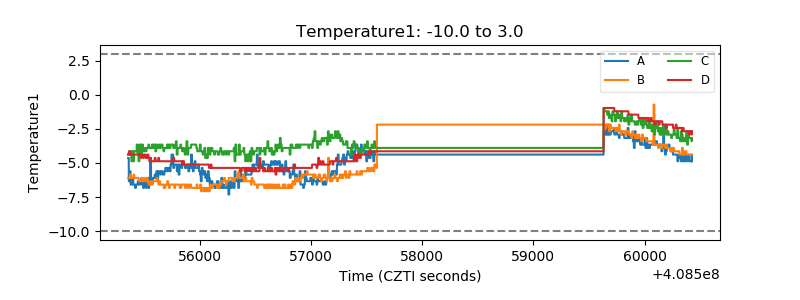 |
| Veto HV Monitor | 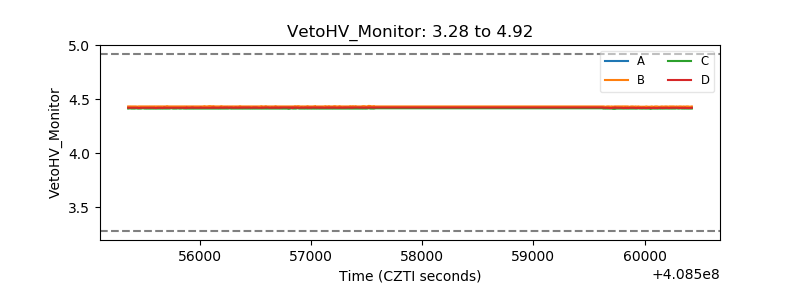 |
| Veto LLD | 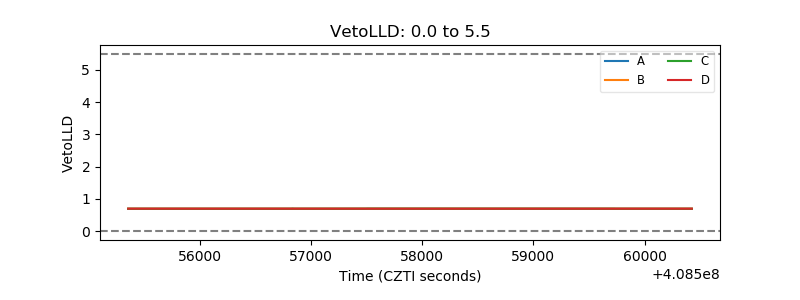 |
| Alpha Counter | 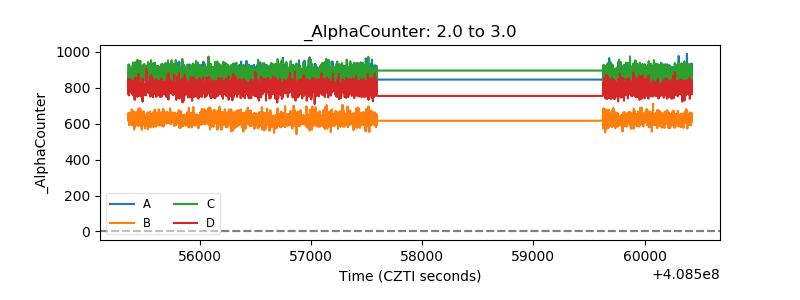 |
| _CPM_Rate | 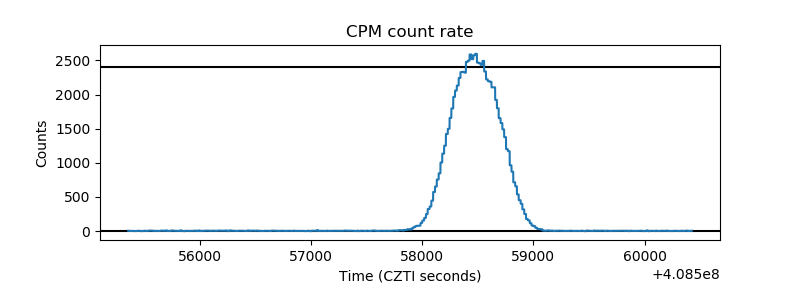 |
| CZT Counter | 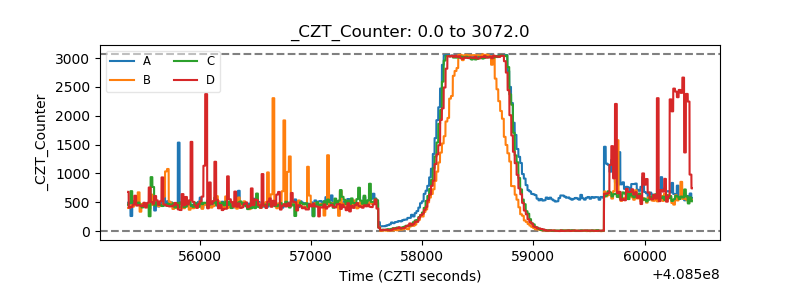 |
| +2.5 Volts monitor | 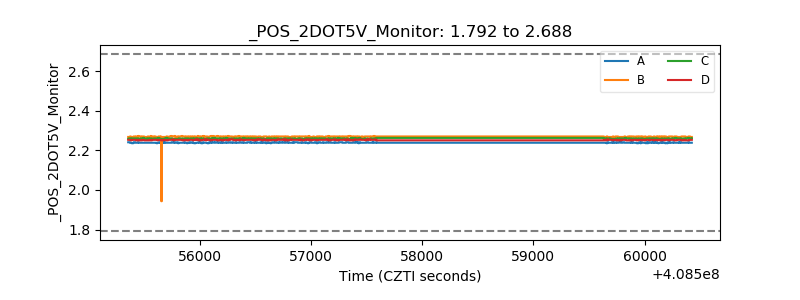 |
| +5 Volts monitor | 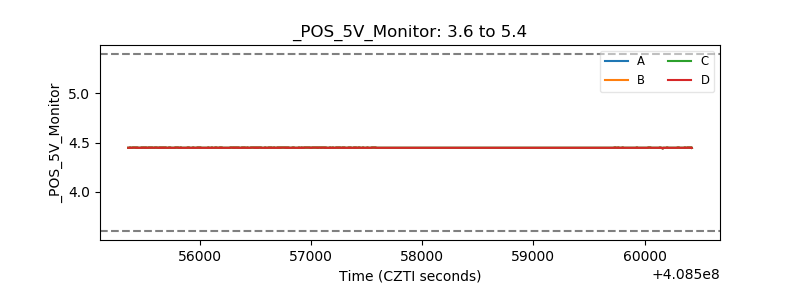 |
| _ROLL_ROT | 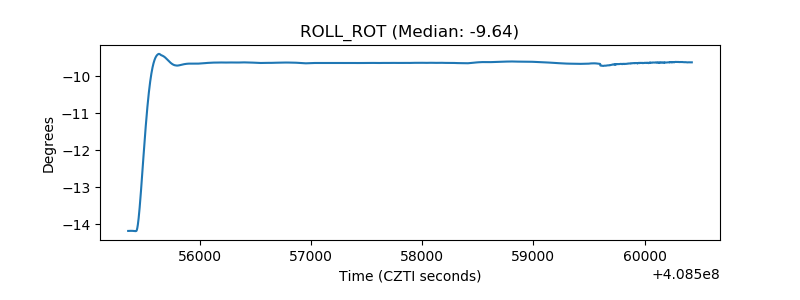 |
| _Roll_DEC | 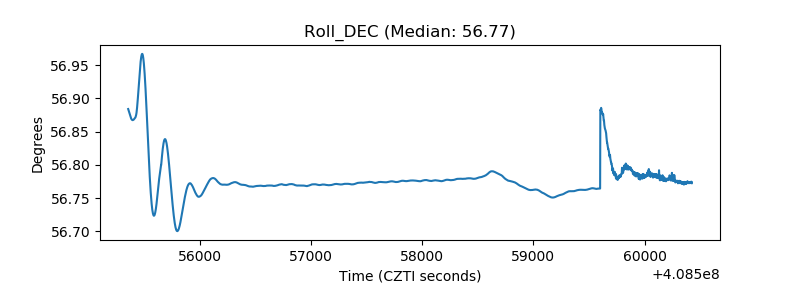 |
| _Roll_RA | 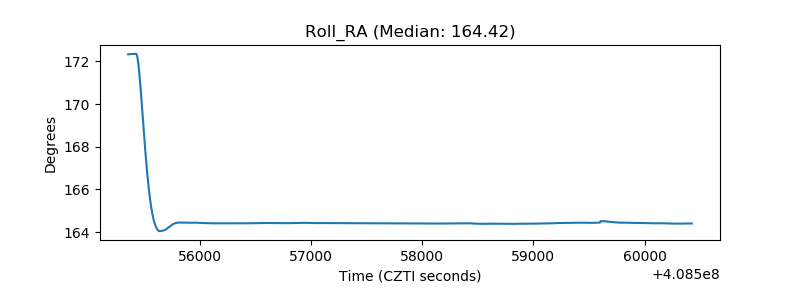 |
| Veto Counter | 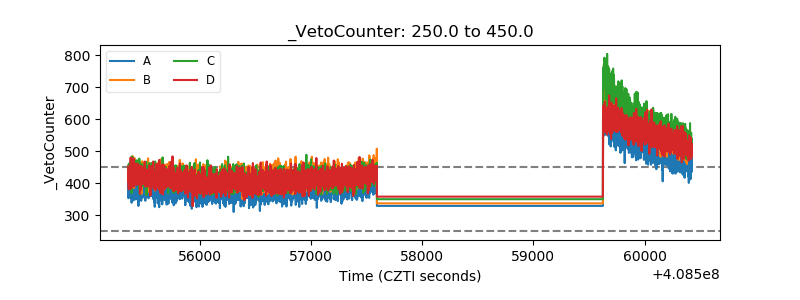 |