| Param | Original file | Final file |
|---|---|---|
| Filename | modeM0/AS1A12_057T01_9000005418_38969cztM0_level2.fits | modeM0/AS1A12_057T01_9000005418_38969cztM0_level2_quad_clean.evt |
| Size (bytes) | 340,606,080 | 95,670,720 |
| Size | 324.8 MB | 91.2 MB |
| Events in quadrant A | 2,811,796 | 661,420 |
| Events in quadrant B | 2,688,021 | 672,088 |
| Events in quadrant C | 2,758,363 | 651,609 |
| Events in quadrant D | 3,964,762 | 565,428 |
| Mode M9 | |||
|---|---|---|---|
| Quadrant | BADHDUFLAG | Total packets | Discarded packets |
| A | 0 | 33 | 0 |
| B | 0 | 33 | 0 |
| C | 0 | 33 | 0 |
| D | 0 | 34 | 0 |
| Mode SS | |||
|---|---|---|---|
| Quadrant | BADHDUFLAG | Total packets | Discarded packets |
| A | 0 | 100 | 0 |
| B | 0 | 100 | 0 |
| C | 0 | 100 | 0 |
| D | 0 | 100 | 0 |
| Mode M0 | |||
|---|---|---|---|
| Quadrant | BADHDUFLAG | Total packets | Discarded packets |
| A | 0 | 11451 | 3 |
| B | 0 | 11054 | 2 |
| C | 0 | 11388 | 2 |
| D | 0 | 15138 | 2 |
| Quadrant | Total seconds | Saturated seconds | Saturation percentage |
|---|---|---|---|
| A | 4947 | 18 | 0.363857% |
| B | 4947 | 81 | 1.637356% |
| C | 4947 | 8 | 0.161714% |
| D | 4947 | 361 | 7.297352% |
Noise dominated data is calculated using 1-second bins in cleaned event files. If a bin has >2000 counts, and if more than 50% of those come from <1% of pixels, then it is considered to be noise-dominated and hence unusable.
| Quadrant | # 1 sec bins | Bins with >0 counts | Bins with >2000 counts | High rate bins dominated by noise | Noise dominated (total time) | Noise dominated (detector-on time) | Marked lightcurve |
|---|---|---|---|---|---|---|---|
| A | 7070 | 4948 | 9 | 9 | 0.13% | 0.18% | 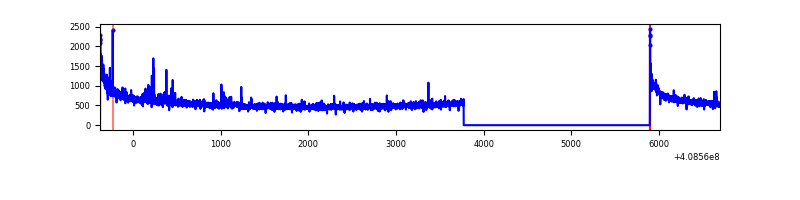 |
| B | 7070 | 4948 | 67 | 67 | 0.95% | 1.35% | 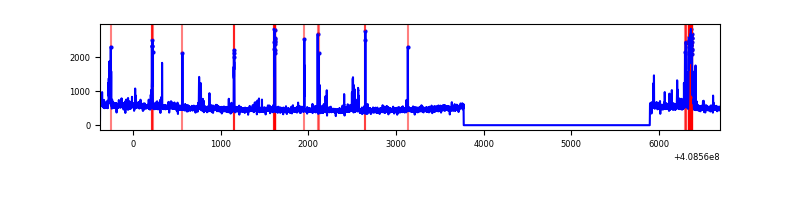 |
| C | 7070 | 4948 | 7 | 7 | 0.10% | 0.14% |  |
| D | 7070 | 4948 | 349 | 349 | 4.94% | 7.05% | 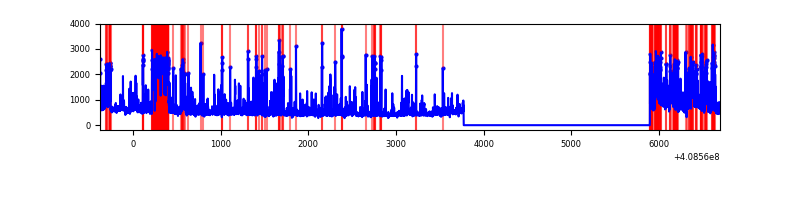 |
Top three noisy pixels from each quadrant. If the there are fewer than three noisy pixels in the level2.evt file, extra rows are filled as -1
| Pixel properties | Quadrant properties | ||||||
|---|---|---|---|---|---|---|---|
| Quadrant | DetID | PixID | Counts | Sigma | Mean | Median | Sigma |
| A | 10 | 83 | 415697 | 3491.04 | 598 | 587 | 118.9 |
| A | 13 | 248 | 57800 | 481.16 | 598 | 587 | 118.9 |
| A | 13 | 6 | 18572 | 151.25 | 598 | 587 | 118.9 |
| B | 5 | 172 | 273750 | 2452.46 | 595 | 580 | 111.4 |
| B | 0 | 230 | 27655 | 243.07 | 595 | 580 | 111.4 |
| B | 5 | 184 | 18250 | 158.64 | 595 | 580 | 111.4 |
| C | 15 | 214 | 220021 | 1614.75 | 593 | 599 | 135.9 |
| C | 14 | 254 | 211736 | 1553.78 | 593 | 599 | 135.9 |
| C | 0 | 10 | 7361 | 49.76 | 593 | 599 | 135.9 |
| D | 2 | 249 | 586149 | 4243.43 | 571 | 557 | 138.0 |
| D | 12 | 227 | 524341 | 3795.55 | 571 | 557 | 138.0 |
| D | 1 | 47 | 230351 | 1665.18 | 571 | 557 | 138.0 |
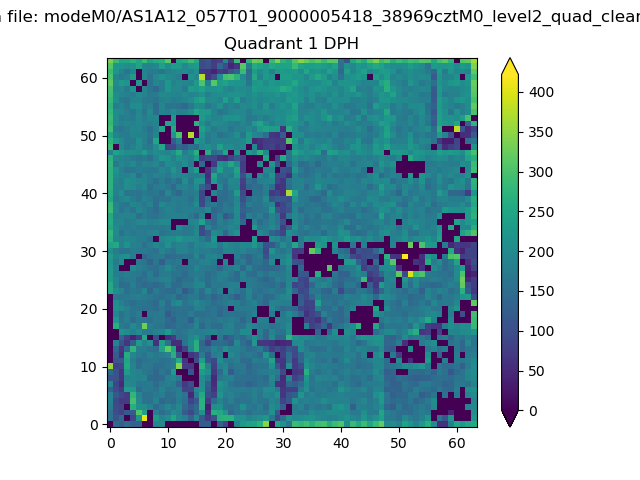
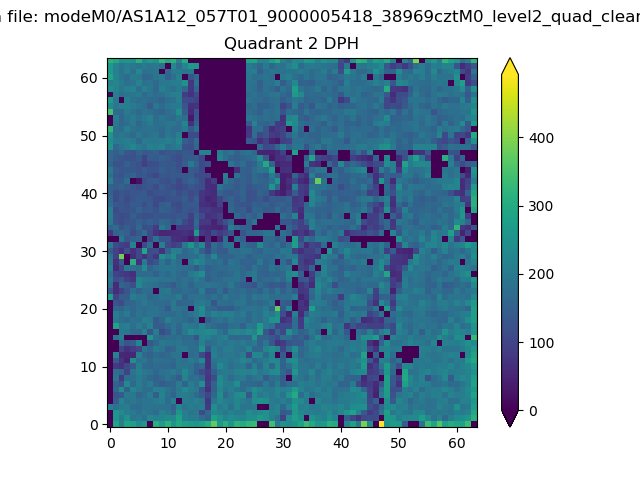
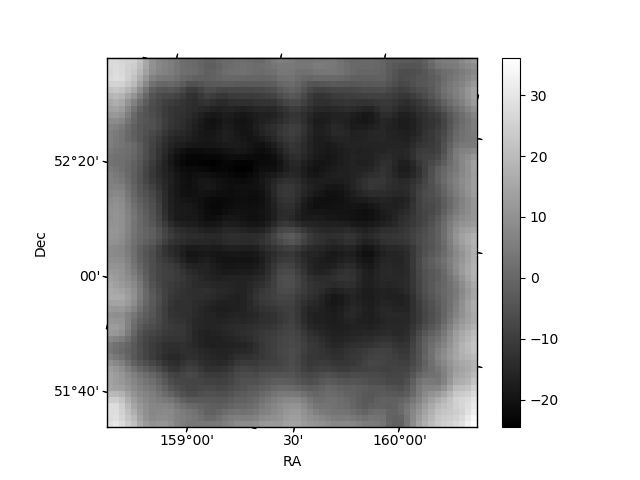
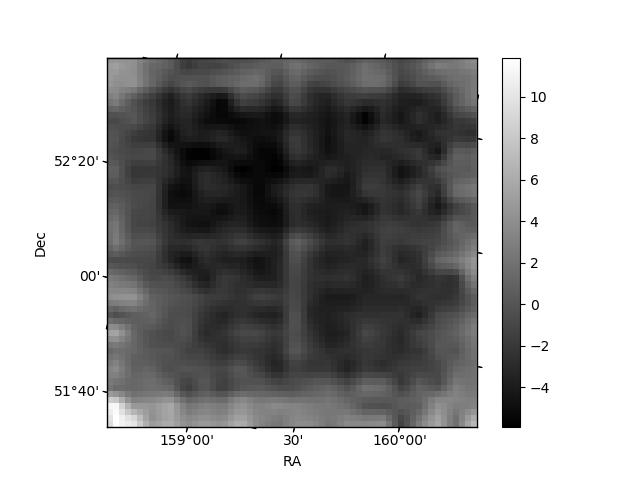
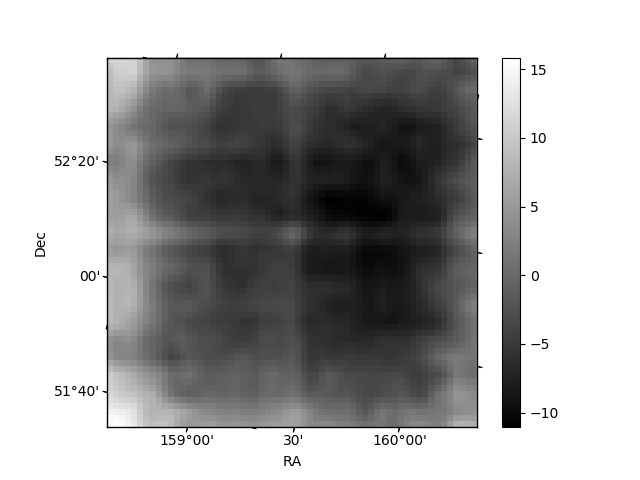
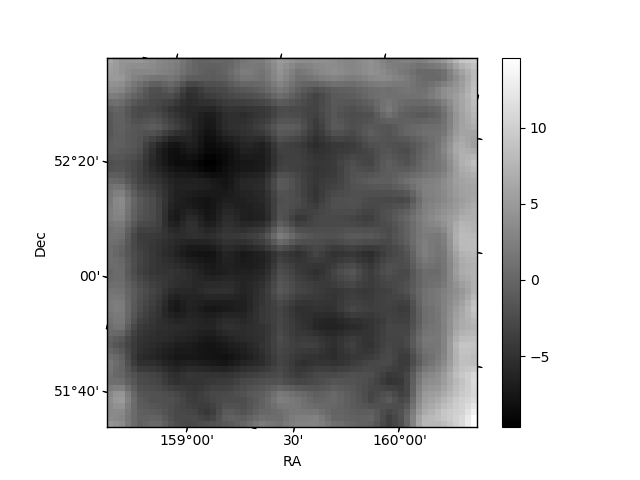
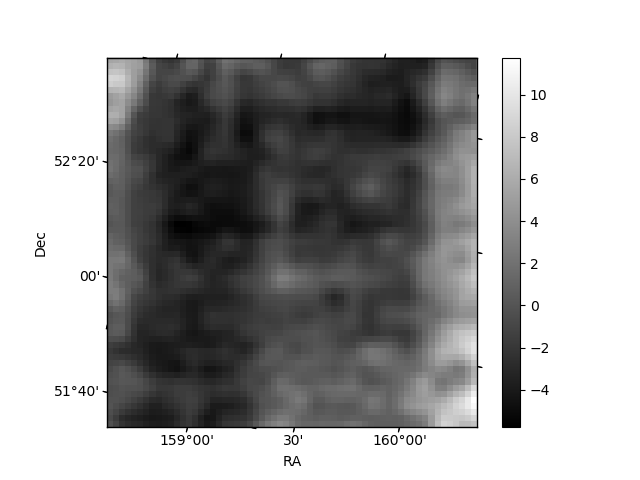
Histogram calculated using DETX and DETY for each event in the final _common_clean file
| Quadrant A | 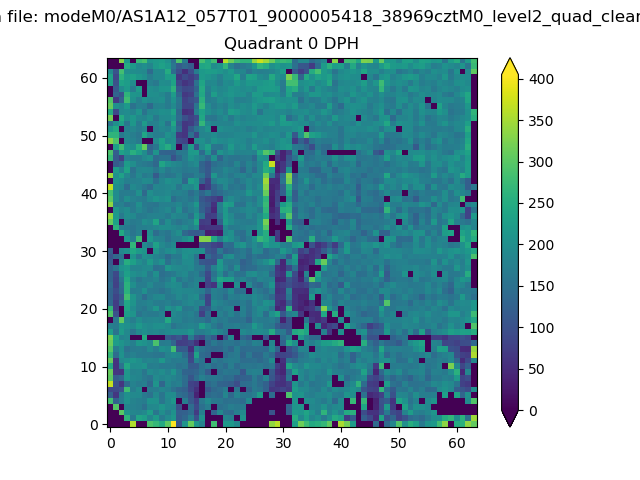 |
 |
Quadrant B |
|---|---|---|---|
| Quadrant D | 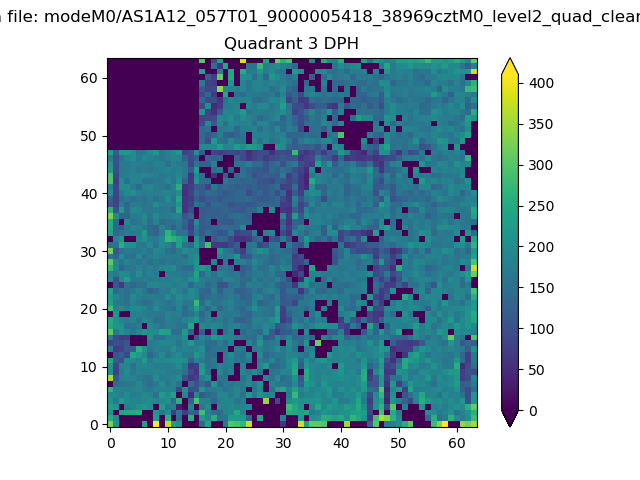 |
 |
Quadrant C |
| Plot type | Count rate plots | Images |
|---|---|---|
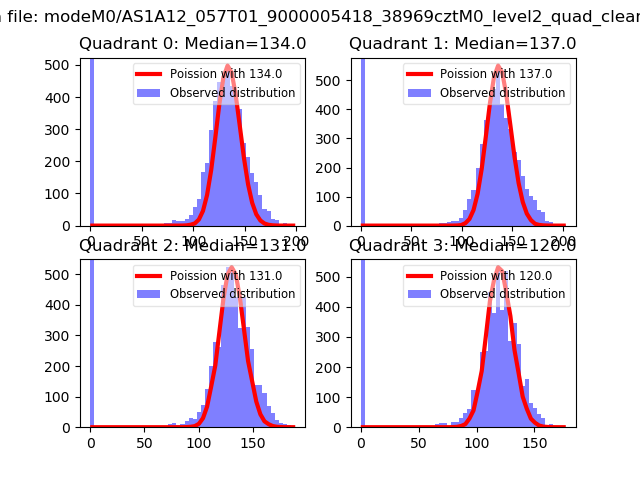
| Comparison with Poisson distribution Blue bars denote a histogram of data divided into 1 sec bins. Red curve is a Poisson curve with rate = median count rate of data. |
 |
 |
| Quadrant-wise count rates Data is divided into 100 sec bins |
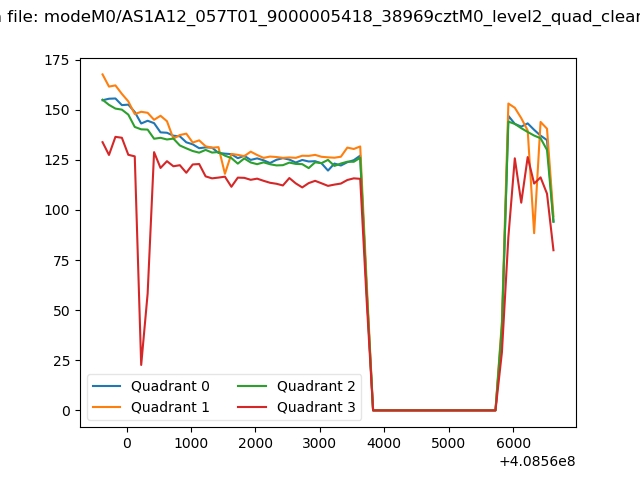 |
|
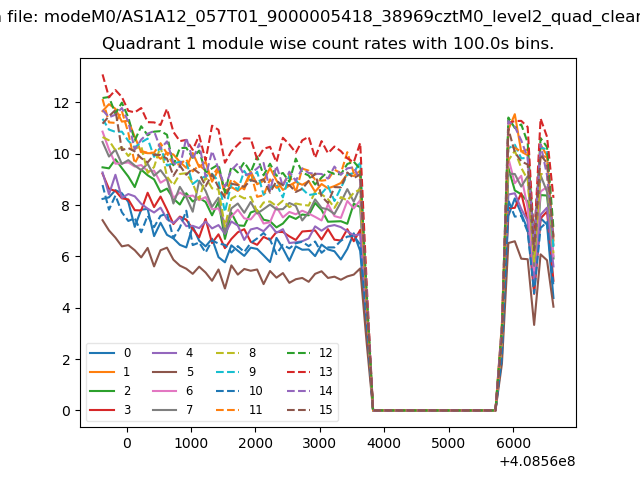
| Module-wise count rates for Quadrant A Data is divided into 100 sec bins |
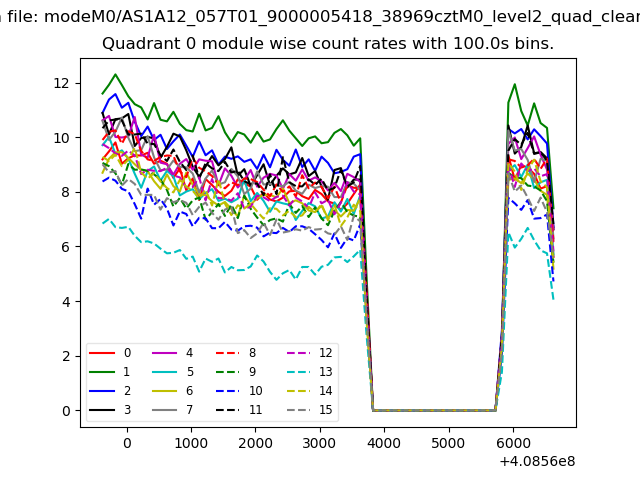 |
 |
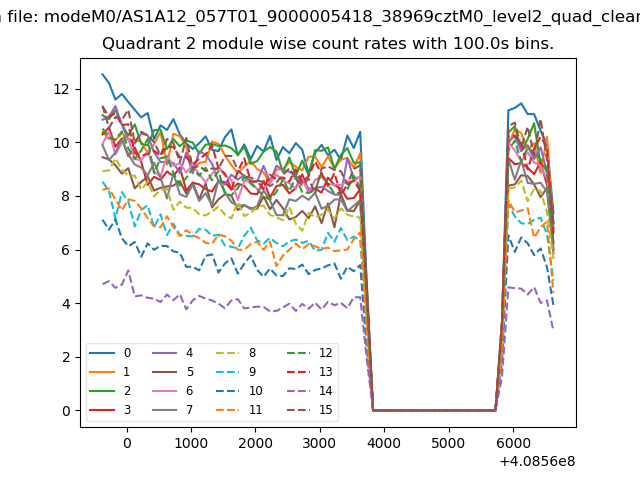
| Module-wise count rates for Quadrant B Data is divided into 100 sec bins |
 |
 |
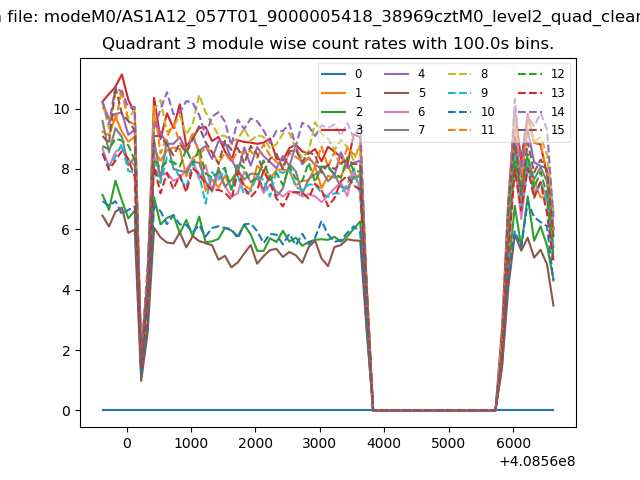
| Module-wise count rates for Quadrant C Data is divided into 100 sec bins |
 |
 |
| Module-wise count rates for Quadrant D Data is divided into 100 sec bins |
 |
 |
| Parameter | Plot |
|---|---|
| CZT HV Monitor | 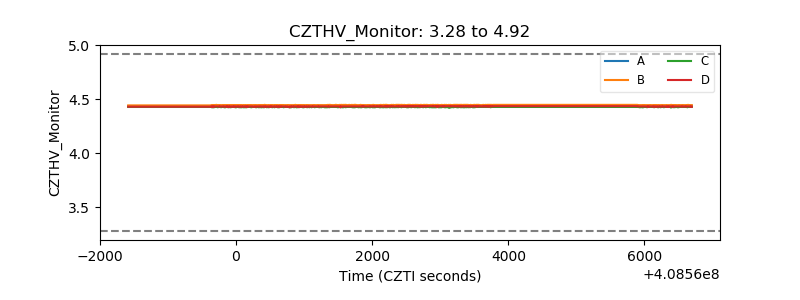 |
| D_VDD | 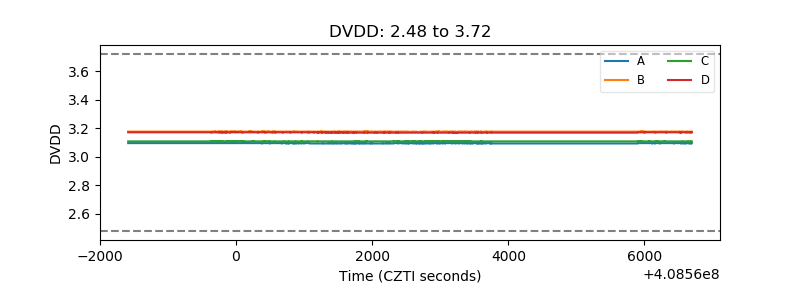 |
| Temperature 1 | 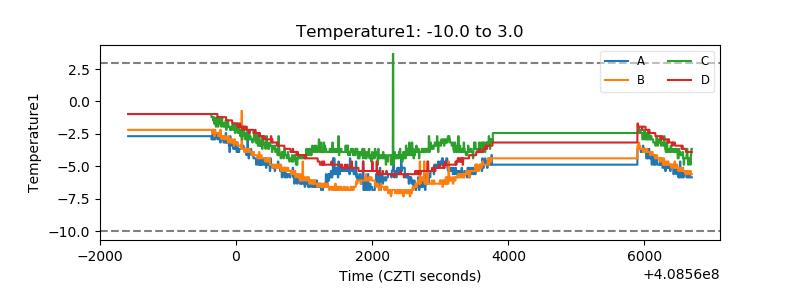 |
| Veto HV Monitor | 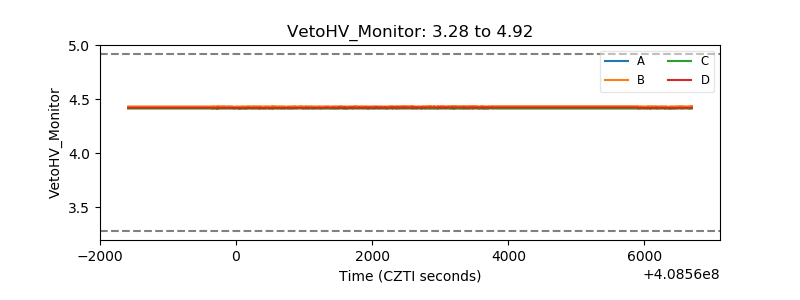 |
| Veto LLD | 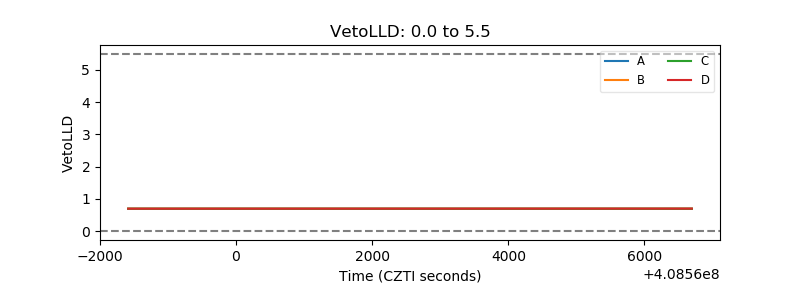 |
| Alpha Counter | 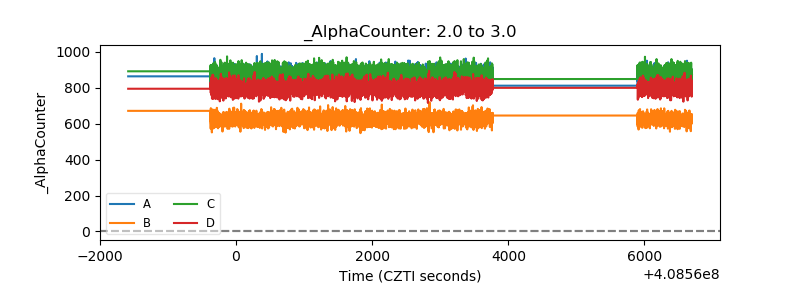 |
| _CPM_Rate | 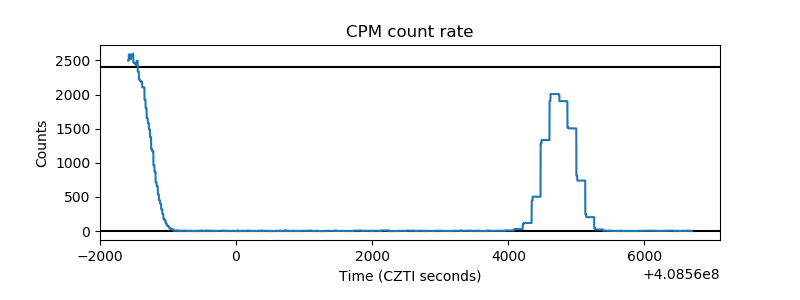 |
| CZT Counter | 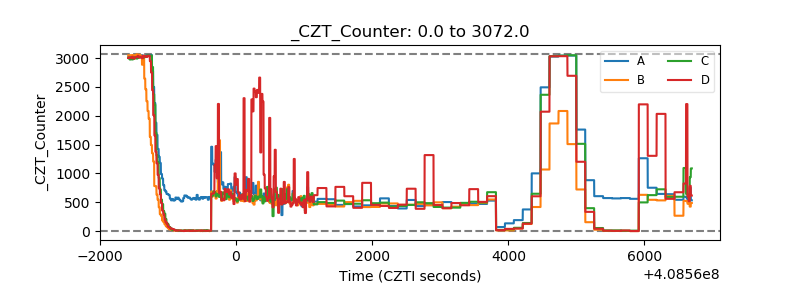 |
| +2.5 Volts monitor | 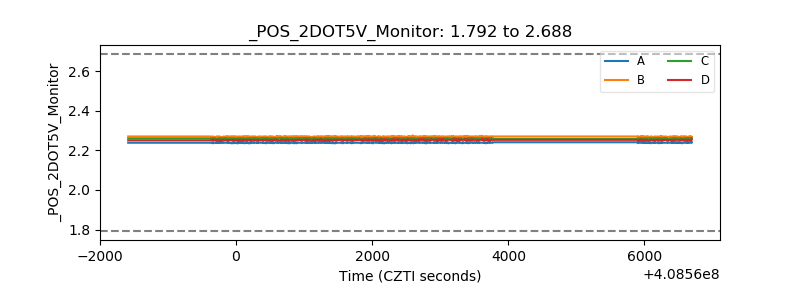 |
| +5 Volts monitor | 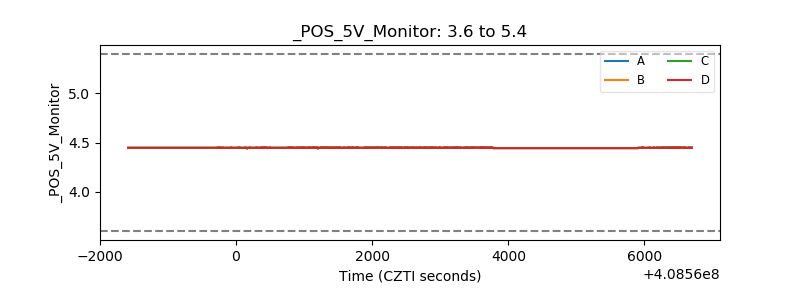 |
| _ROLL_ROT | 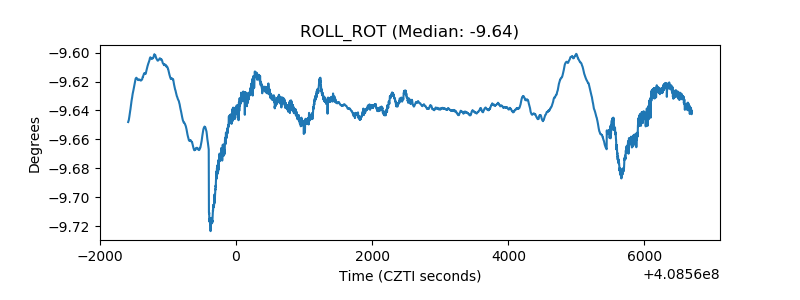 |
| _Roll_DEC | 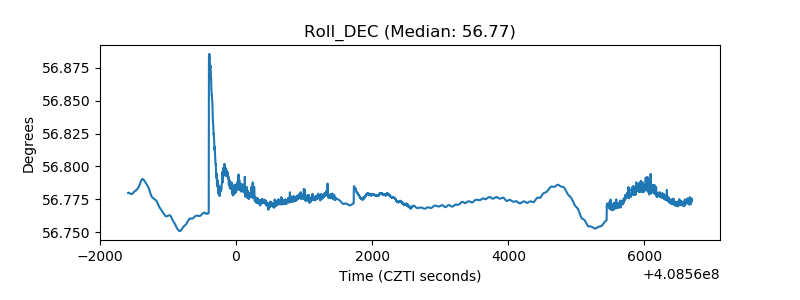 |
| _Roll_RA | 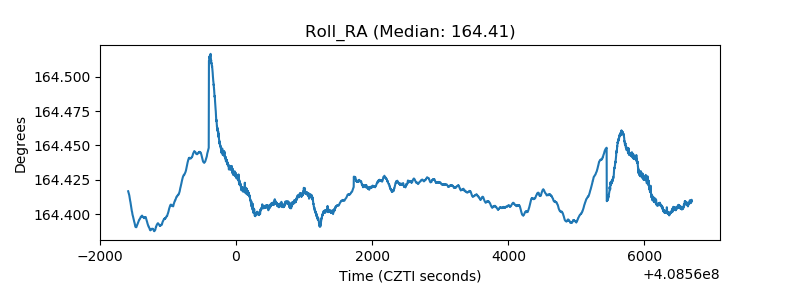 |
| Veto Counter | 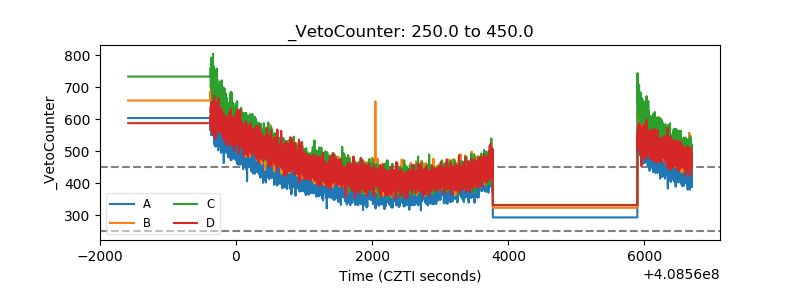 |