| Param | Original file | Final file |
|---|---|---|
| Filename | modeM0/AS1A12_057T01_9000005418_38970cztM0_level2.fits | modeM0/AS1A12_057T01_9000005418_38970cztM0_level2_quad_clean.evt |
| Size (bytes) | 327,337,920 | 89,199,360 |
| Size | 312.2 MB | 85.1 MB |
| Events in quadrant A | 2,565,889 | 609,669 |
| Events in quadrant B | 2,442,940 | 620,052 |
| Events in quadrant C | 2,816,299 | 602,552 |
| Events in quadrant D | 3,917,669 | 531,868 |
| Mode M9 | |||
|---|---|---|---|
| Quadrant | BADHDUFLAG | Total packets | Discarded packets |
| A | 0 | 37 | 0 |
| B | 0 | 37 | 0 |
| C | 0 | 37 | 0 |
| D | 0 | 38 | 0 |
| Mode SS | |||
|---|---|---|---|
| Quadrant | BADHDUFLAG | Total packets | Discarded packets |
| A | 0 | 98 | 0 |
| B | 0 | 98 | 0 |
| C | 0 | 98 | 0 |
| D | 0 | 98 | 0 |
| Mode M0 | |||
|---|---|---|---|
| Quadrant | BADHDUFLAG | Total packets | Discarded packets |
| A | 0 | 10625 | 3 |
| B | 0 | 10391 | 2 |
| C | 0 | 11327 | 2 |
| D | 0 | 14949 | 2 |
| Quadrant | Total seconds | Saturated seconds | Saturation percentage |
|---|---|---|---|
| A | 4802 | 12 | 0.249896% |
| B | 4802 | 73 | 1.520200% |
| C | 4802 | 33 | 0.687214% |
| D | 4802 | 315 | 6.559767% |
Noise dominated data is calculated using 1-second bins in cleaned event files. If a bin has >2000 counts, and if more than 50% of those come from <1% of pixels, then it is considered to be noise-dominated and hence unusable.
| Quadrant | # 1 sec bins | Bins with >0 counts | Bins with >2000 counts | High rate bins dominated by noise | Noise dominated (total time) | Noise dominated (detector-on time) | Marked lightcurve |
|---|---|---|---|---|---|---|---|
| A | 6955 | 4803 | 8 | 8 | 0.12% | 0.17% | 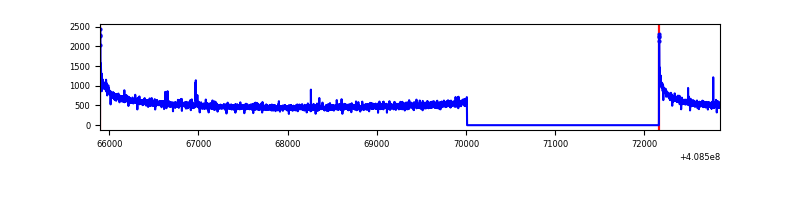 |
| B | 6955 | 4803 | 55 | 55 | 0.79% | 1.15% | 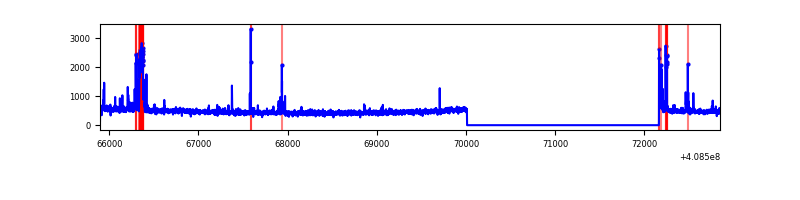 |
| C | 6955 | 4803 | 31 | 31 | 0.45% | 0.65% | 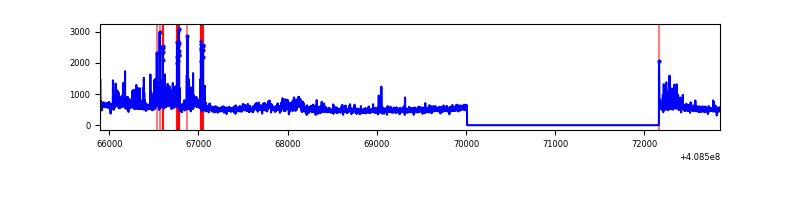 |
| D | 6955 | 4803 | 334 | 334 | 4.80% | 6.95% | 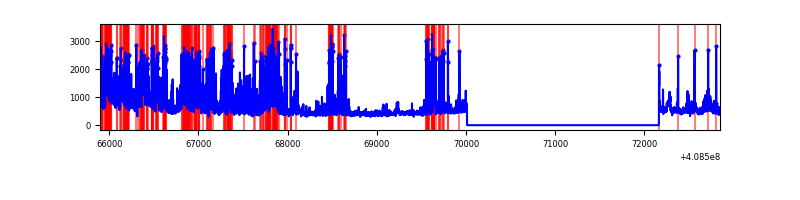 |
Top three noisy pixels from each quadrant. If the there are fewer than three noisy pixels in the level2.evt file, extra rows are filled as -1
| Pixel properties | Quadrant properties | ||||||
|---|---|---|---|---|---|---|---|
| Quadrant | DetID | PixID | Counts | Sigma | Mean | Median | Sigma |
| A | 10 | 83 | 391070 | 3515.43 | 555 | 545 | 111.1 |
| A | 13 | 254 | 9131 | 77.29 | 555 | 545 | 111.1 |
| A | 13 | 248 | 8712 | 73.52 | 555 | 545 | 111.1 |
| B | 5 | 172 | 233669 | 2224.26 | 554 | 540 | 104.8 |
| B | 12 | 111 | 12618 | 115.24 | 554 | 540 | 104.8 |
| B | 0 | 199 | 11796 | 107.39 | 554 | 540 | 104.8 |
| C | 14 | 254 | 251912 | 1981.22 | 550 | 556 | 126.9 |
| C | 15 | 214 | 213405 | 1677.7 | 550 | 556 | 126.9 |
| C | 3 | 233 | 152820 | 1200.16 | 550 | 556 | 126.9 |
| D | 1 | 47 | 798436 | 6154.88 | 534 | 522 | 129.6 |
| D | 12 | 227 | 462962 | 3567.13 | 534 | 522 | 129.6 |
| D | 12 | 6 | 248551 | 1913.22 | 534 | 522 | 129.6 |
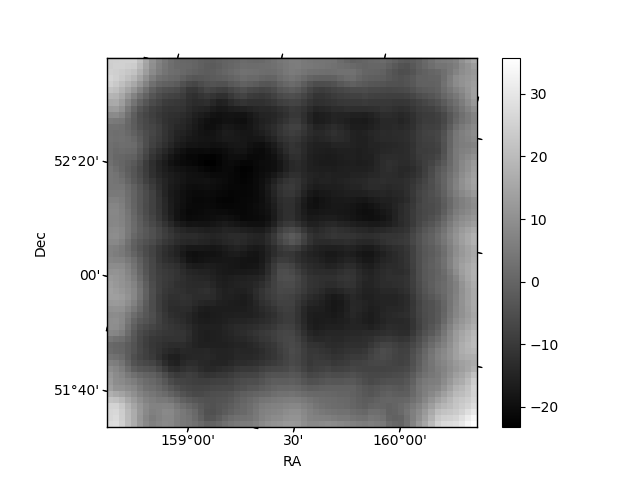
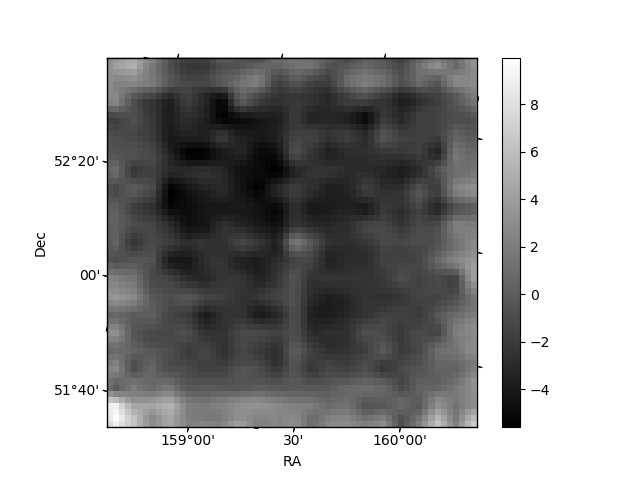
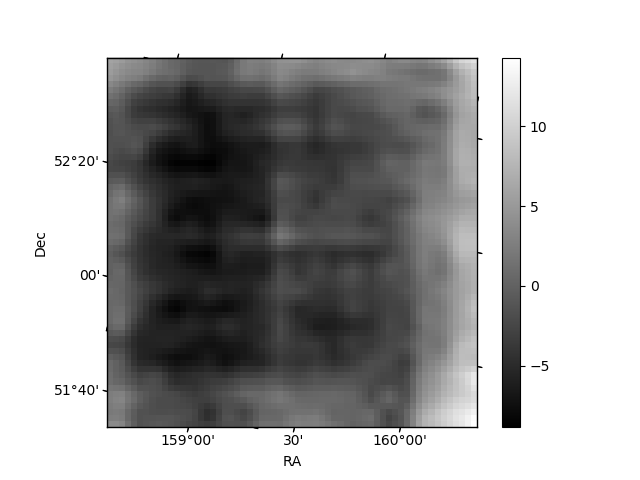
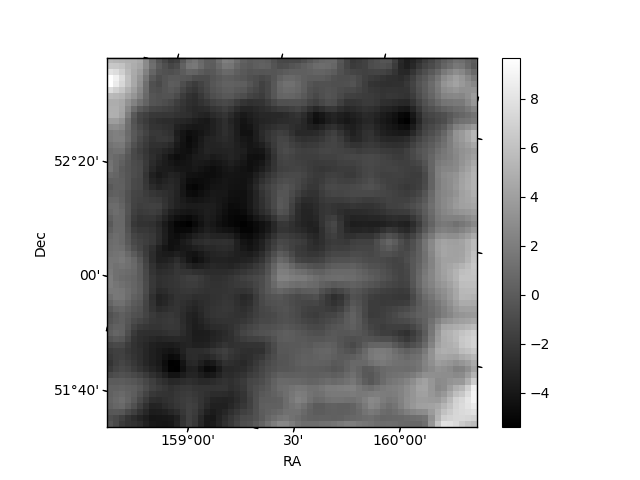
Histogram calculated using DETX and DETY for each event in the final _common_clean file
| Quadrant A | 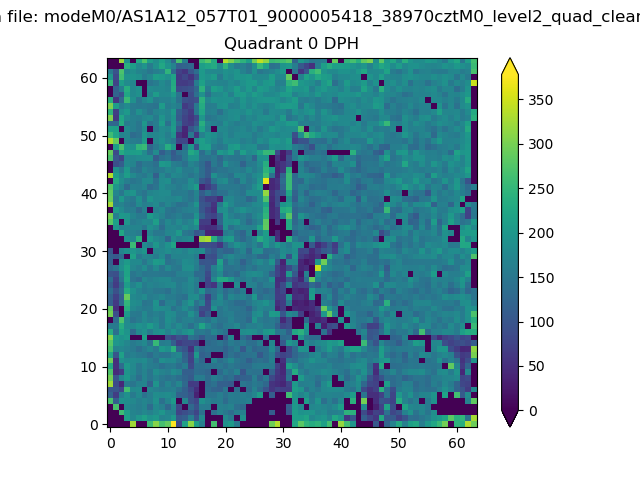 |
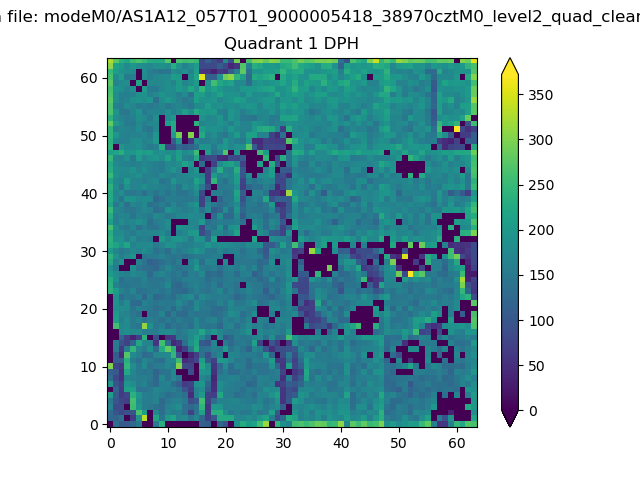 |
Quadrant B |
|---|---|---|---|
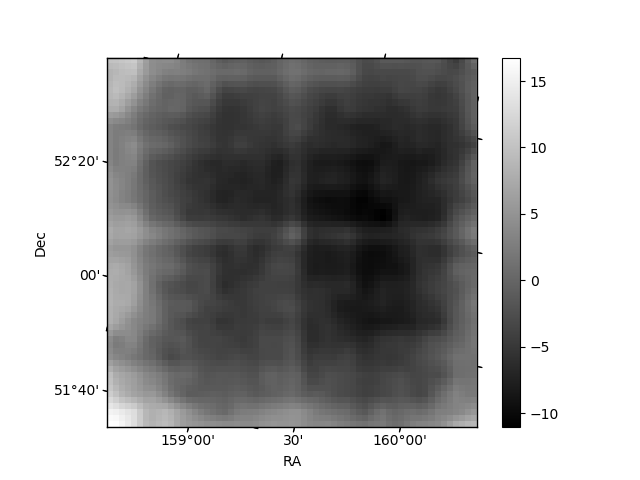
| Quadrant D | 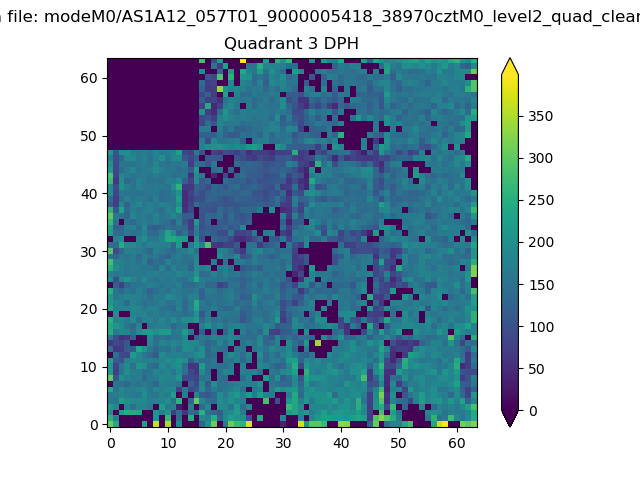 |
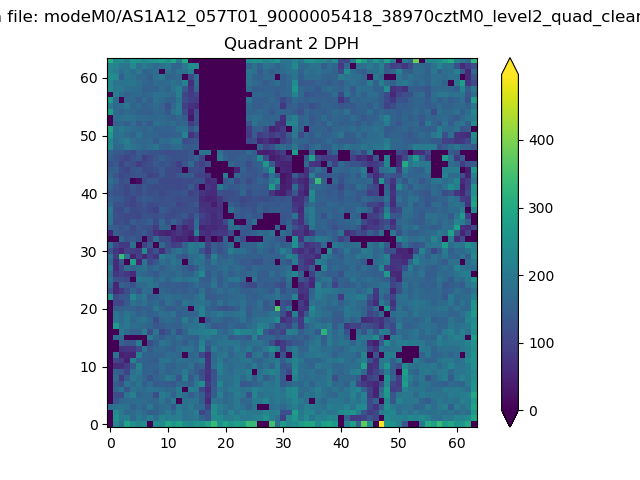 |
Quadrant C |
| Plot type | Count rate plots | Images |
|---|---|---|
| Comparison with Poisson distribution Blue bars denote a histogram of data divided into 1 sec bins. Red curve is a Poisson curve with rate = median count rate of data. |
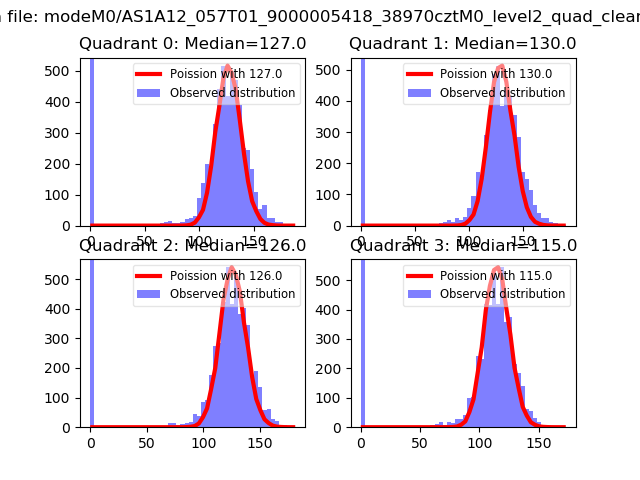 |
 |
| Quadrant-wise count rates Data is divided into 100 sec bins |
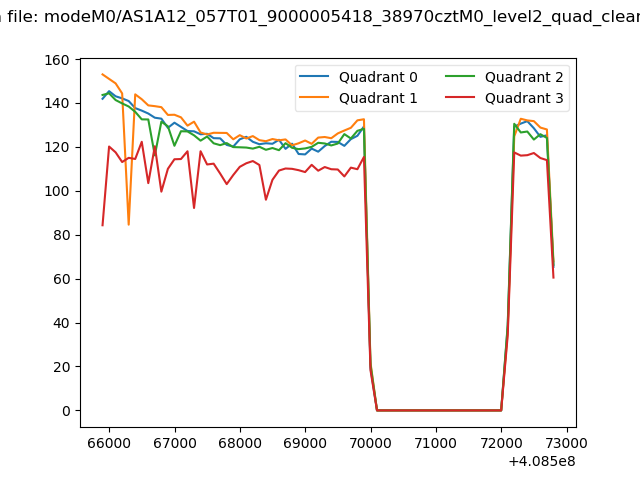 |
|
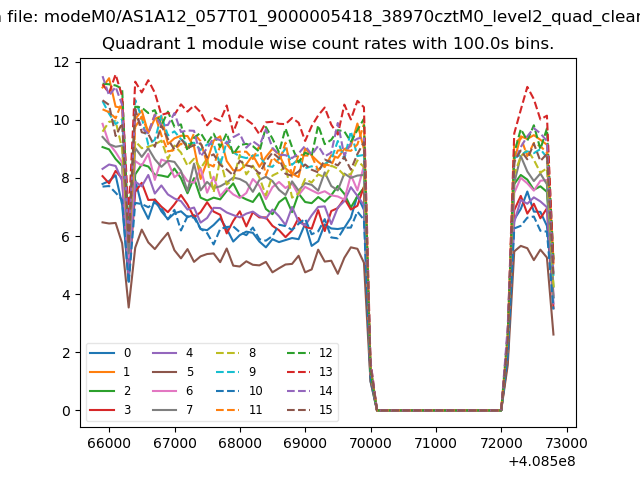
| Module-wise count rates for Quadrant A Data is divided into 100 sec bins |
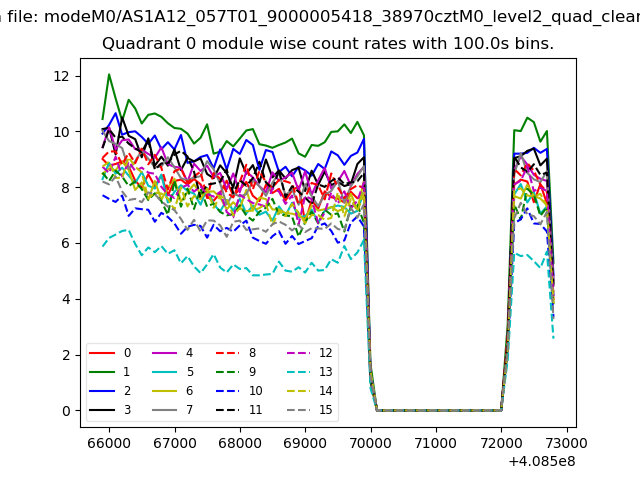 |
 |
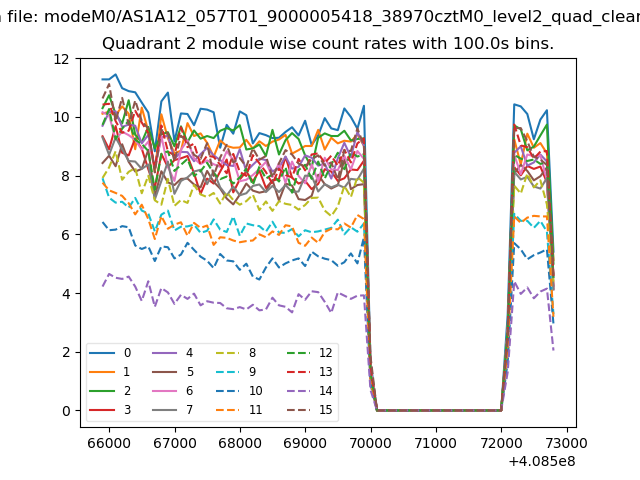
| Module-wise count rates for Quadrant B Data is divided into 100 sec bins |
 |
 |
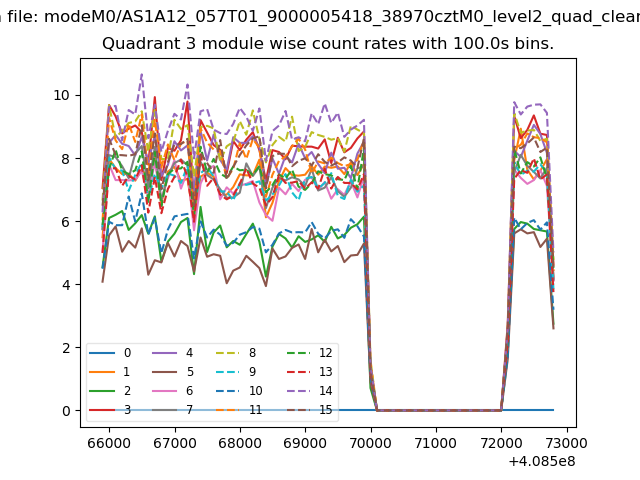
| Module-wise count rates for Quadrant C Data is divided into 100 sec bins |
 |
 |
| Module-wise count rates for Quadrant D Data is divided into 100 sec bins |
 |
 |
| Parameter | Plot |
|---|---|
| CZT HV Monitor | 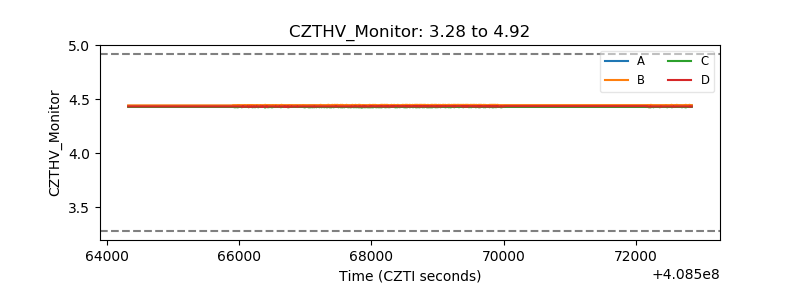 |
| D_VDD | 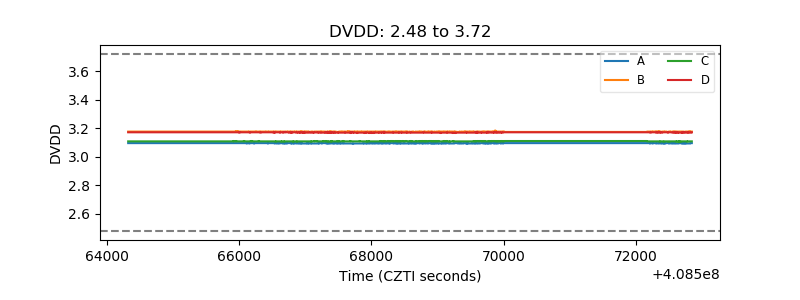 |
| Temperature 1 | 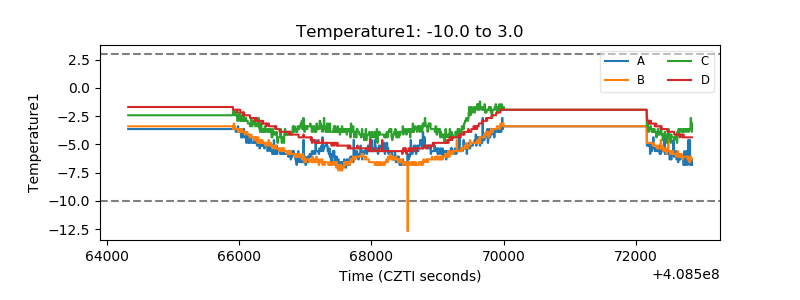 |
| Veto HV Monitor |  |
| Veto LLD | 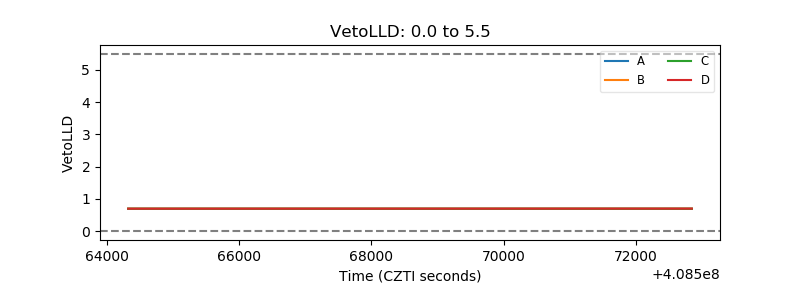 |
| Alpha Counter |  |
| _CPM_Rate | 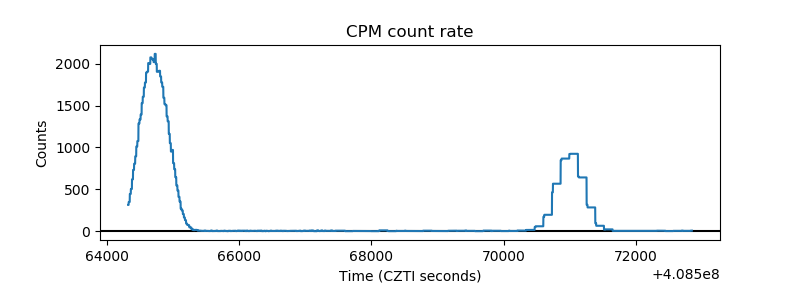 |
| CZT Counter | 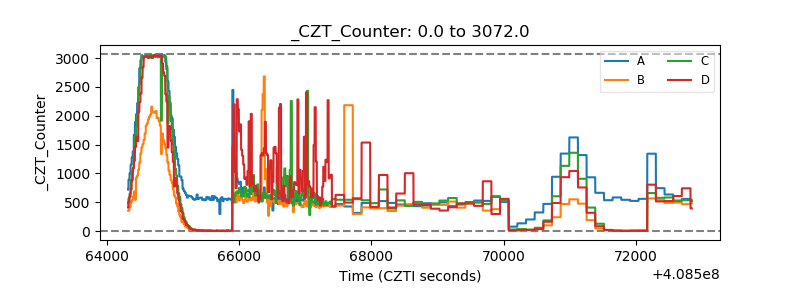 |
| +2.5 Volts monitor | 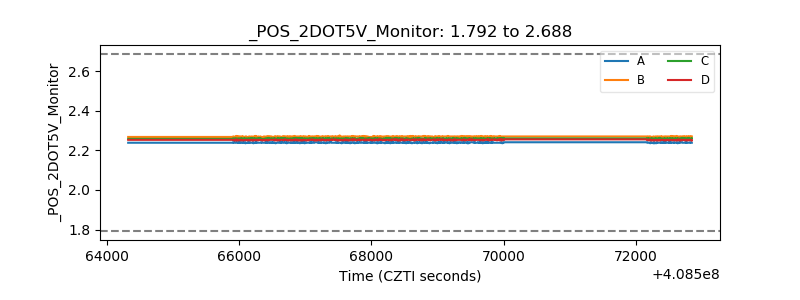 |
| +5 Volts monitor | 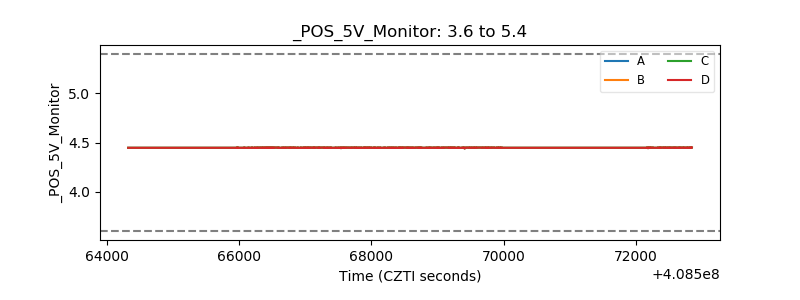 |
| _ROLL_ROT | 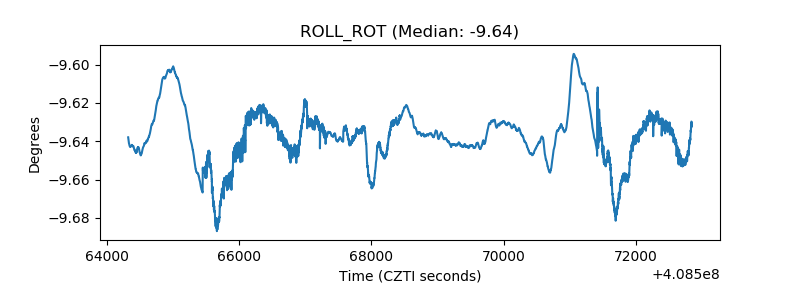 |
| _Roll_DEC | 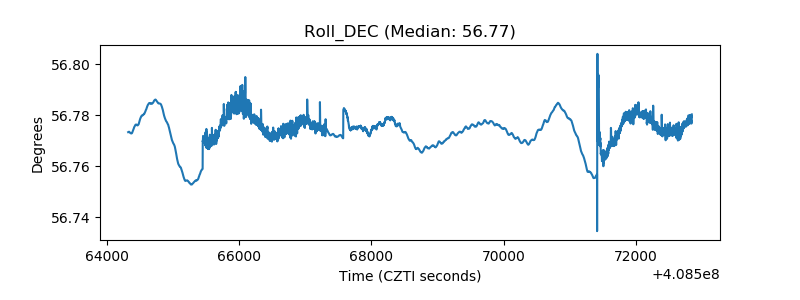 |
| _Roll_RA | 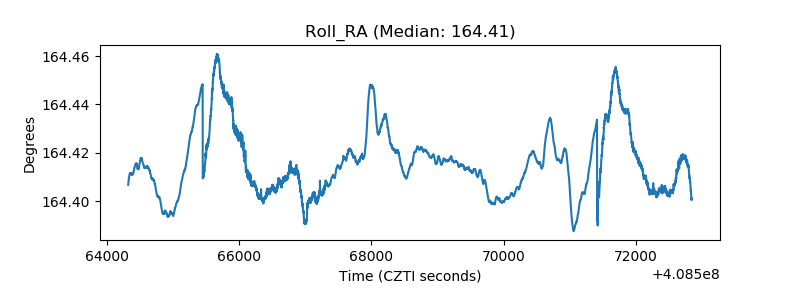 |
| Veto Counter | 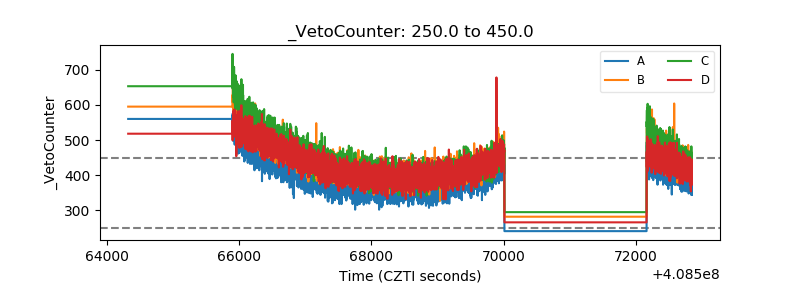 |