| Param | Original file | Final file |
|---|---|---|
| Filename | modeM0/AS1A12_057T01_9000005418_38971cztM0_level2.fits | modeM0/AS1A12_057T01_9000005418_38971cztM0_level2_quad_clean.evt |
| Size (bytes) | 292,230,720 | 89,835,840 |
| Size | 278.7 MB | 85.7 MB |
| Events in quadrant A | 2,679,680 | 600,671 |
| Events in quadrant B | 2,438,924 | 618,886 |
| Events in quadrant C | 2,533,458 | 597,262 |
| Events in quadrant D | 2,769,099 | 547,758 |
| Mode M9 | |||
|---|---|---|---|
| Quadrant | BADHDUFLAG | Total packets | Discarded packets |
| A | 0 | 39 | 0 |
| B | 0 | 39 | 0 |
| C | 0 | 39 | 0 |
| D | 0 | 40 | 0 |
| Mode SS | |||
|---|---|---|---|
| Quadrant | BADHDUFLAG | Total packets | Discarded packets |
| A | 0 | 102 | 0 |
| B | 0 | 102 | 0 |
| C | 0 | 102 | 0 |
| D | 0 | 102 | 0 |
| Mode M0 | |||
|---|---|---|---|
| Quadrant | BADHDUFLAG | Total packets | Discarded packets |
| A | 0 | 11181 | 3 |
| B | 0 | 10698 | 2 |
| C | 0 | 10670 | 2 |
| D | 0 | 11787 | 2 |
| Quadrant | Total seconds | Saturated seconds | Saturation percentage |
|---|---|---|---|
| A | 5081 | 42 | 0.826609% |
| B | 5081 | 30 | 0.590435% |
| C | 5081 | 7 | 0.137768% |
| D | 5081 | 60 | 1.180870% |
Noise dominated data is calculated using 1-second bins in cleaned event files. If a bin has >2000 counts, and if more than 50% of those come from <1% of pixels, then it is considered to be noise-dominated and hence unusable.
| Quadrant | # 1 sec bins | Bins with >0 counts | Bins with >2000 counts | High rate bins dominated by noise | Noise dominated (total time) | Noise dominated (detector-on time) | Marked lightcurve |
|---|---|---|---|---|---|---|---|
| A | 7114 | 5082 | 28 | 28 | 0.39% | 0.55% | 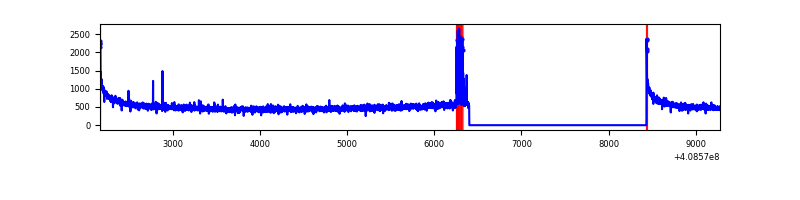 |
| B | 7114 | 5082 | 16 | 16 | 0.22% | 0.31% | 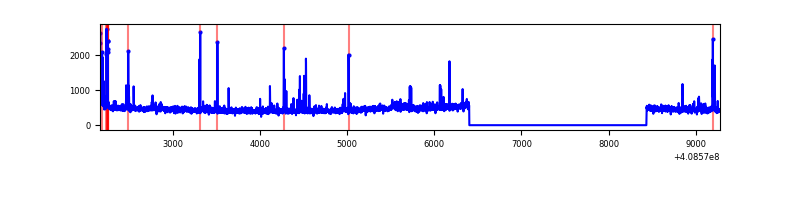 |
| C | 7114 | 5082 | 3 | 3 | 0.04% | 0.06% | 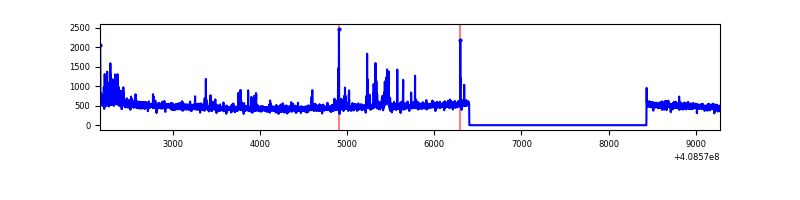 |
| D | 7114 | 5082 | 65 | 65 | 0.91% | 1.28% | 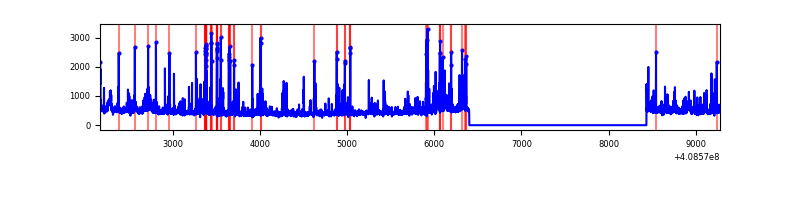 |
Top three noisy pixels from each quadrant. If the there are fewer than three noisy pixels in the level2.evt file, extra rows are filled as -1
| Pixel properties | Quadrant properties | ||||||
|---|---|---|---|---|---|---|---|
| Quadrant | DetID | PixID | Counts | Sigma | Mean | Median | Sigma |
| A | 10 | 83 | 399680 | 3511.96 | 562 | 552 | 113.6 |
| A | 13 | 248 | 91139 | 797.08 | 562 | 552 | 113.6 |
| A | 13 | 6 | 9203 | 76.12 | 562 | 552 | 113.6 |
| B | 5 | 172 | 170952 | 1565.61 | 564 | 548 | 108.8 |
| B | 0 | 230 | 37553 | 339.99 | 564 | 548 | 108.8 |
| B | 12 | 111 | 13412 | 118.19 | 564 | 548 | 108.8 |
| C | 15 | 214 | 224020 | 1719.34 | 557 | 561 | 130.0 |
| C | 15 | 208 | 125152 | 958.63 | 557 | 561 | 130.0 |
| C | 0 | 10 | 6742 | 47.56 | 557 | 561 | 130.0 |
| D | 12 | 227 | 197226 | 1467.92 | 548 | 534 | 134.0 |
| D | 12 | 6 | 152187 | 1131.79 | 548 | 534 | 134.0 |
| D | 2 | 249 | 87744 | 650.85 | 548 | 534 | 134.0 |
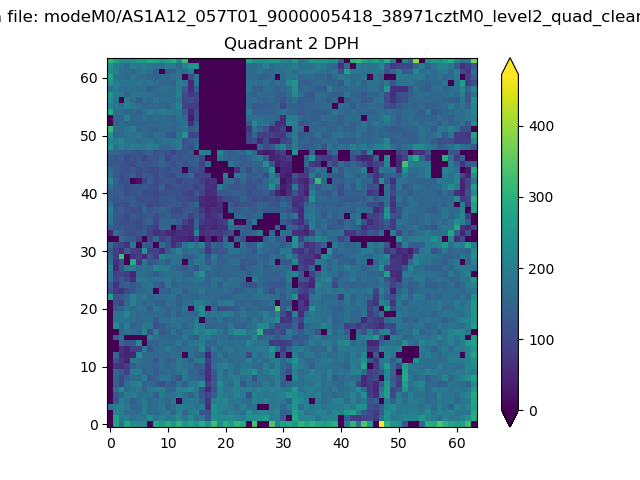
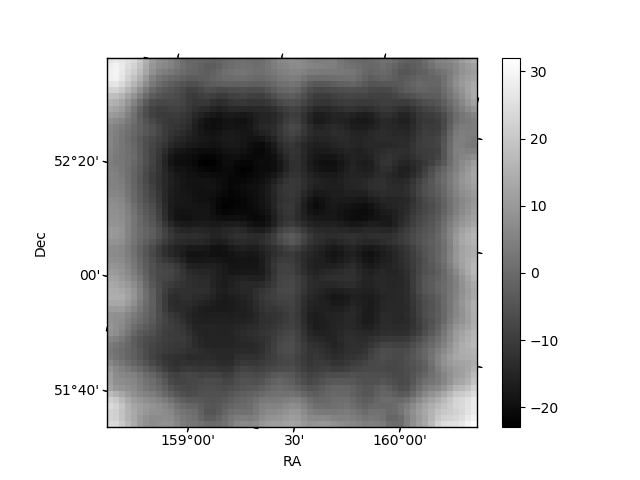
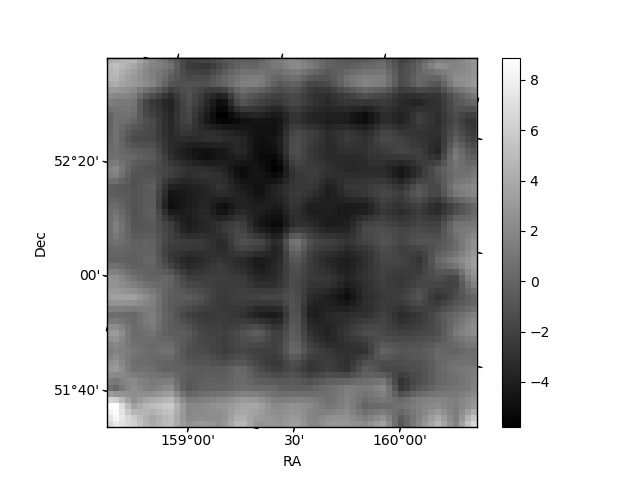
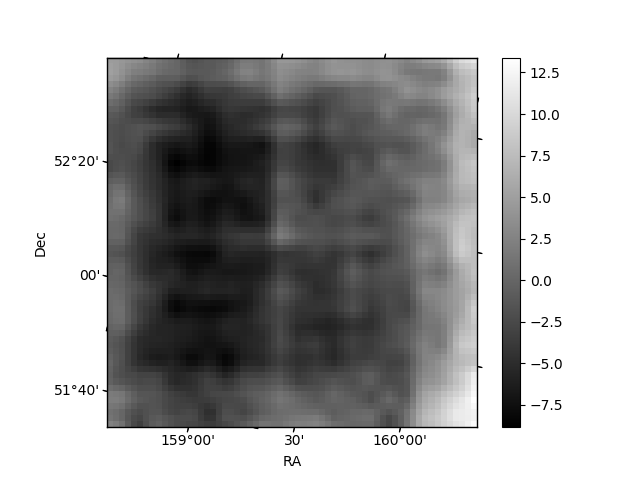
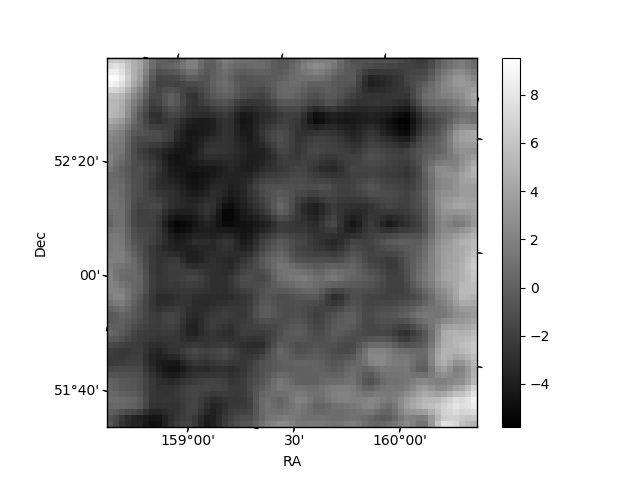
Histogram calculated using DETX and DETY for each event in the final _common_clean file
| Quadrant A | 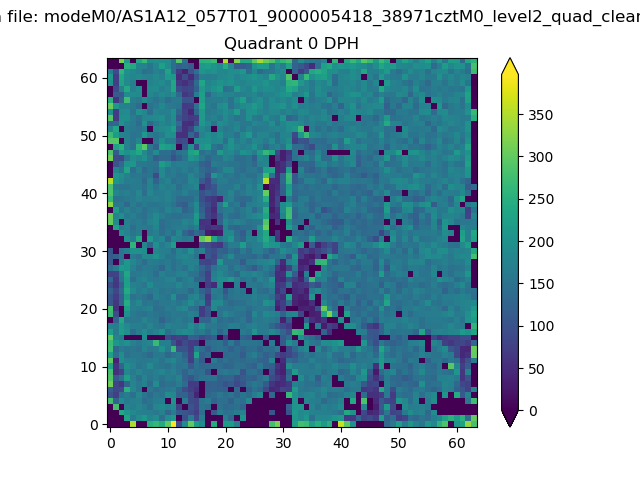 |
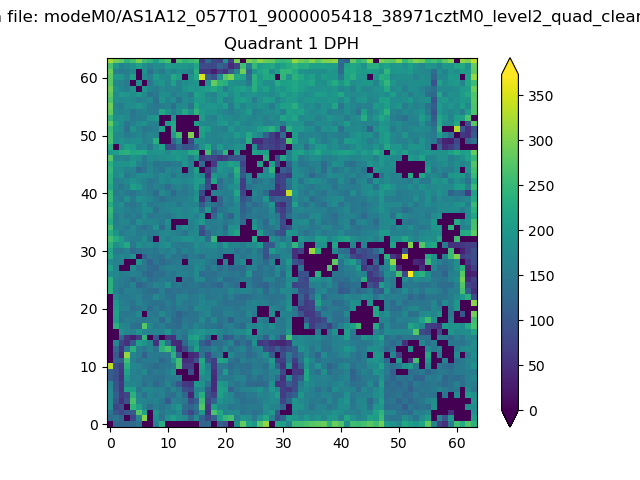 |
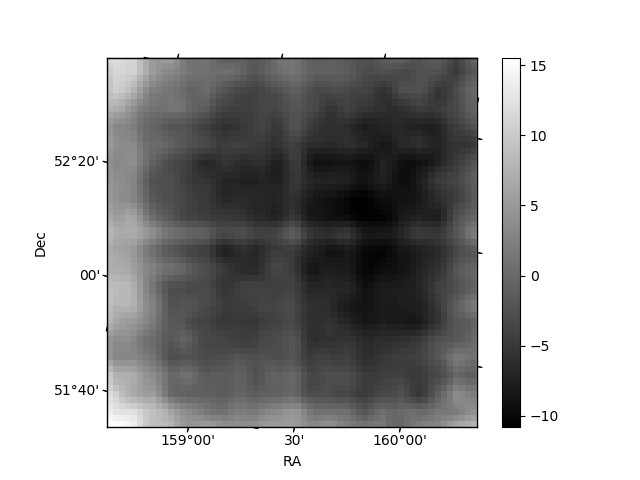
Quadrant B |
|---|---|---|---|
| Quadrant D | 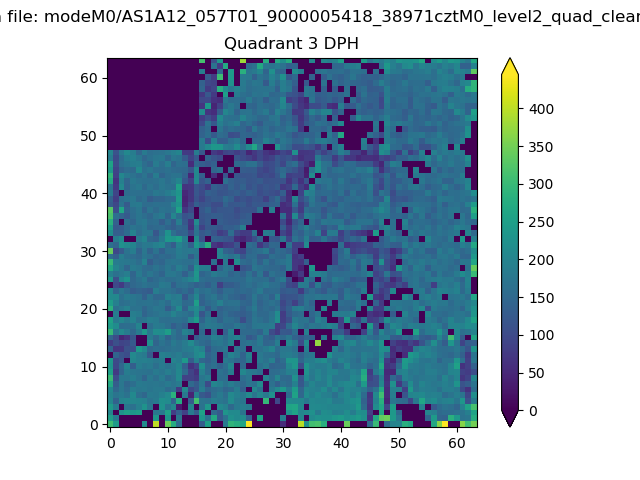 |
 |
Quadrant C |
| Plot type | Count rate plots | Images |
|---|---|---|
| Comparison with Poisson distribution Blue bars denote a histogram of data divided into 1 sec bins. Red curve is a Poisson curve with rate = median count rate of data. |
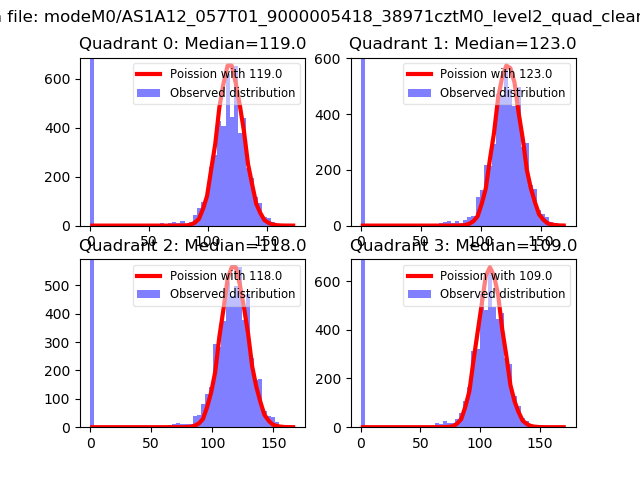 |
 |
| Quadrant-wise count rates Data is divided into 100 sec bins |
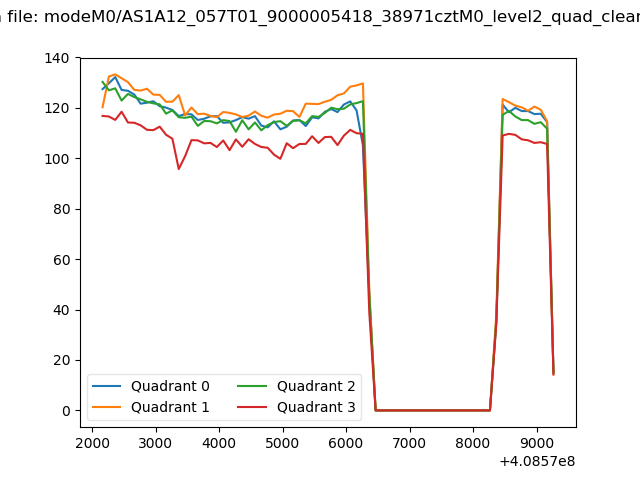 |
|
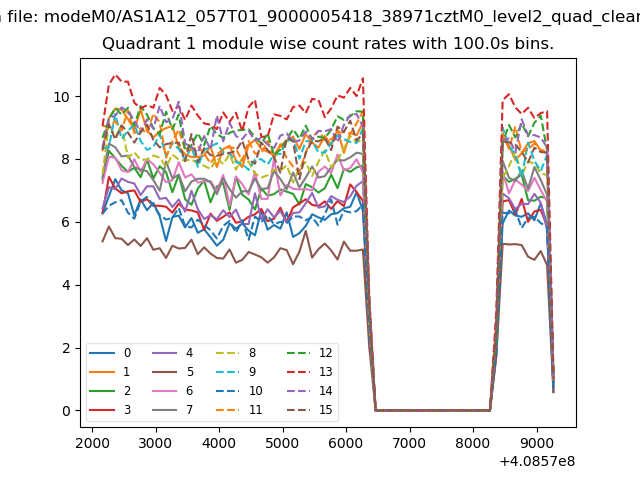
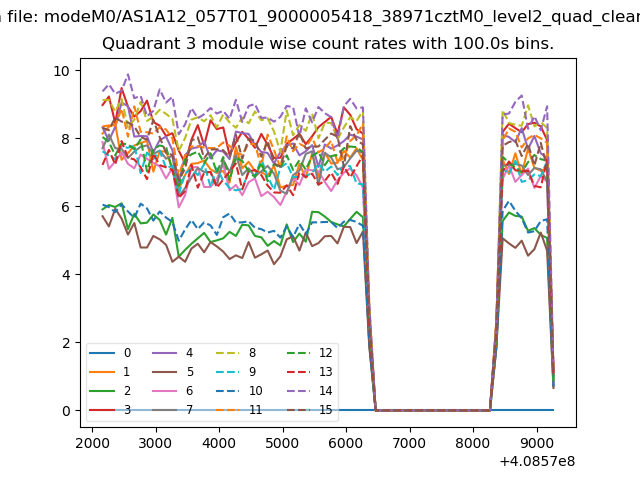
| Module-wise count rates for Quadrant A Data is divided into 100 sec bins |
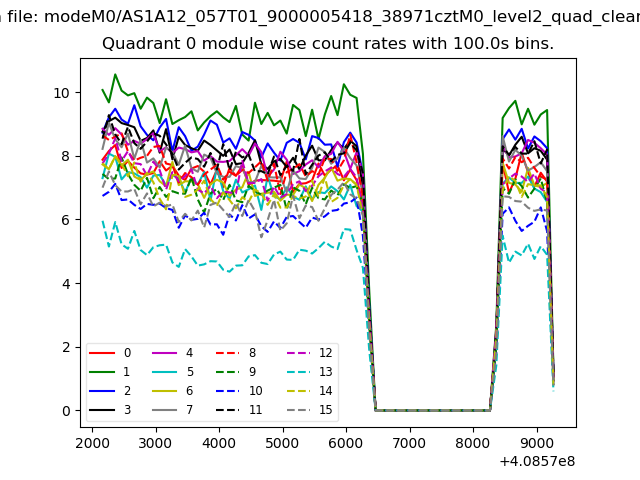 |
 |
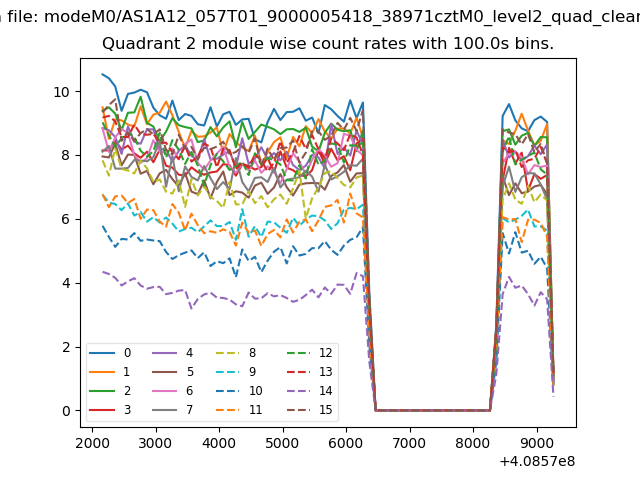
| Module-wise count rates for Quadrant B Data is divided into 100 sec bins |
 |
 |
| Module-wise count rates for Quadrant C Data is divided into 100 sec bins |
 |
 |
| Module-wise count rates for Quadrant D Data is divided into 100 sec bins |
 |
 |
| Parameter | Plot |
|---|---|
| CZT HV Monitor | 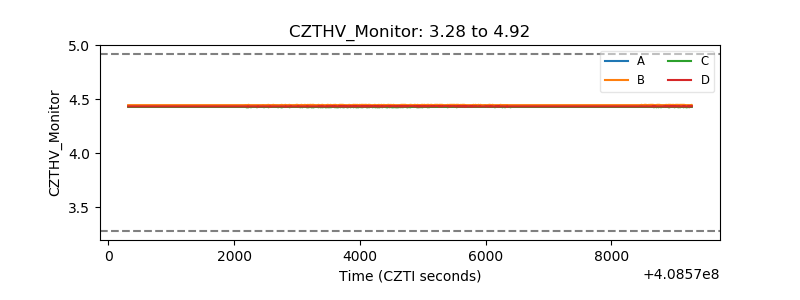 |
| D_VDD | 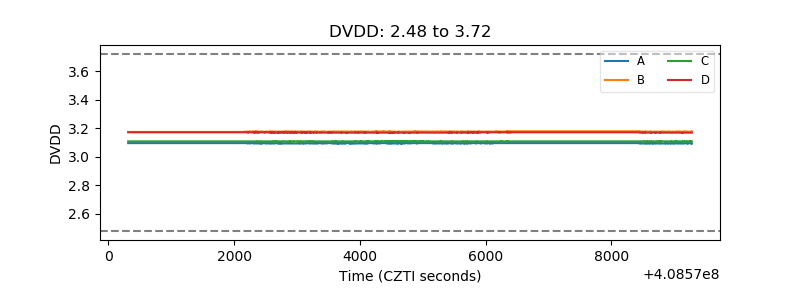 |
| Temperature 1 | 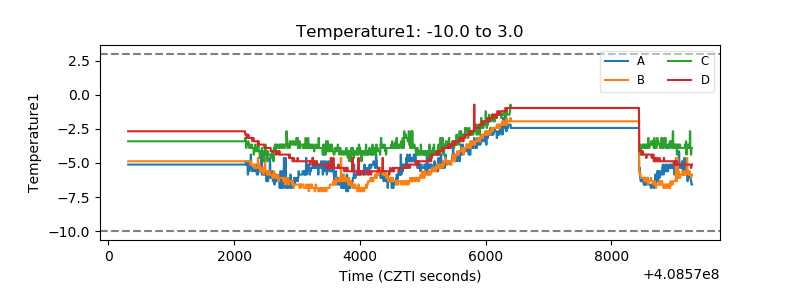 |
| Veto HV Monitor | 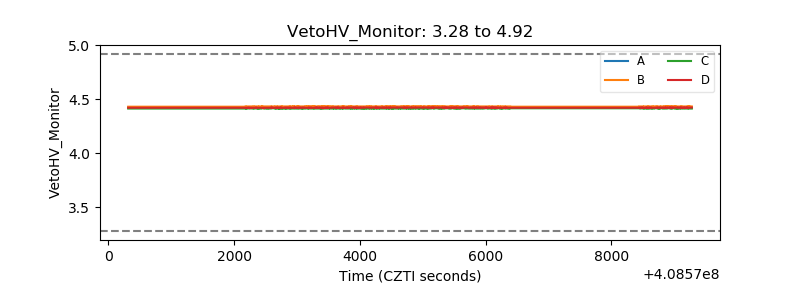 |
| Veto LLD | 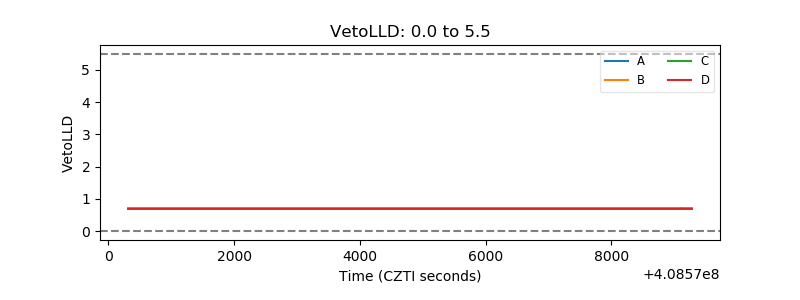 |
| Alpha Counter | 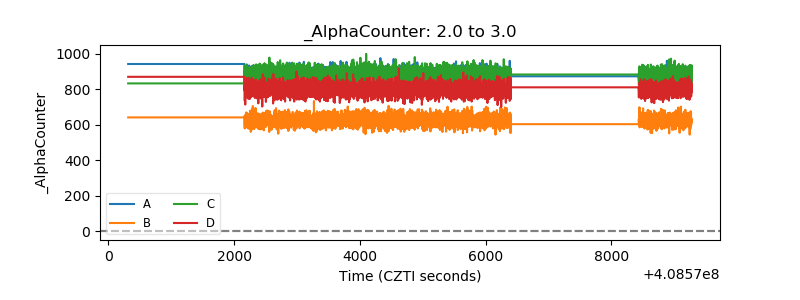 |
| _CPM_Rate | 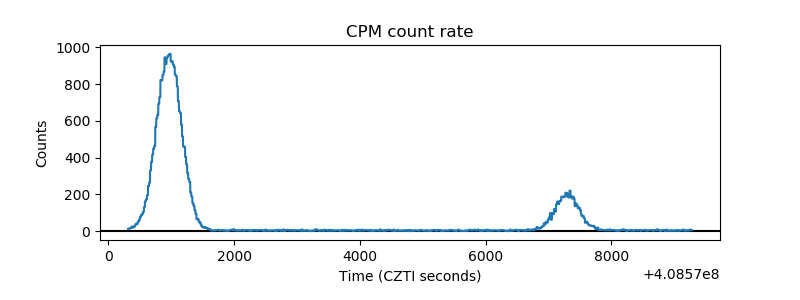 |
| CZT Counter | 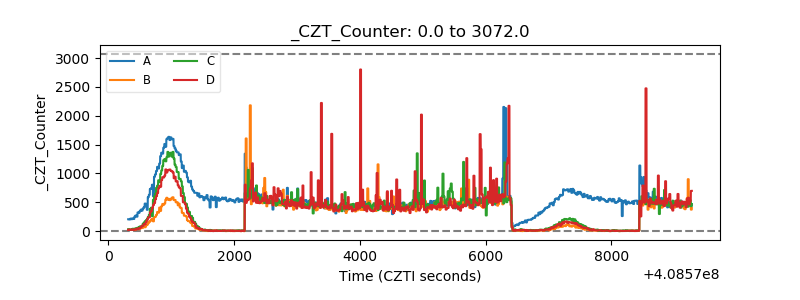 |
| +2.5 Volts monitor | 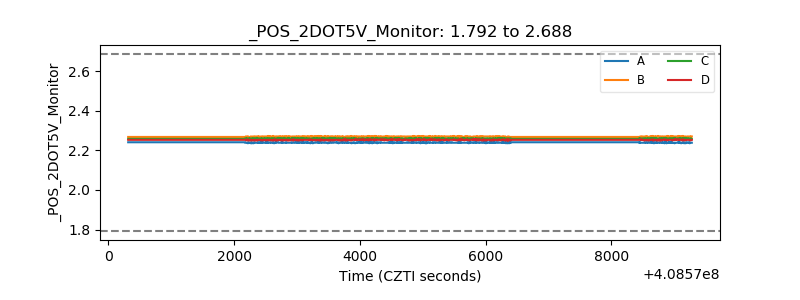 |
| +5 Volts monitor | 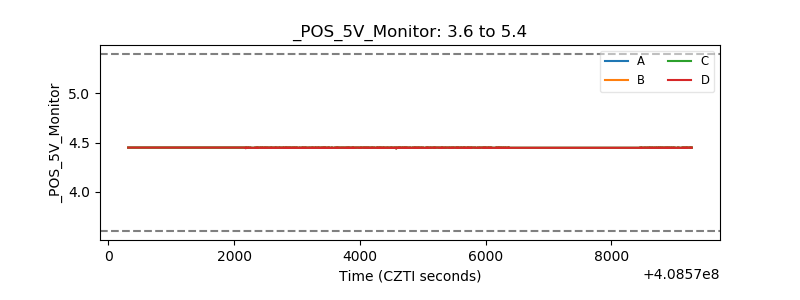 |
| _ROLL_ROT | 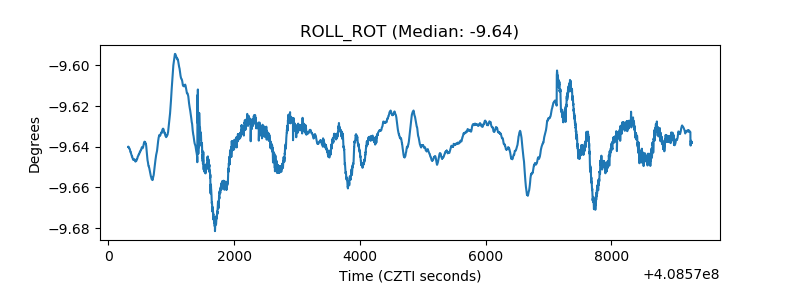 |
| _Roll_DEC | 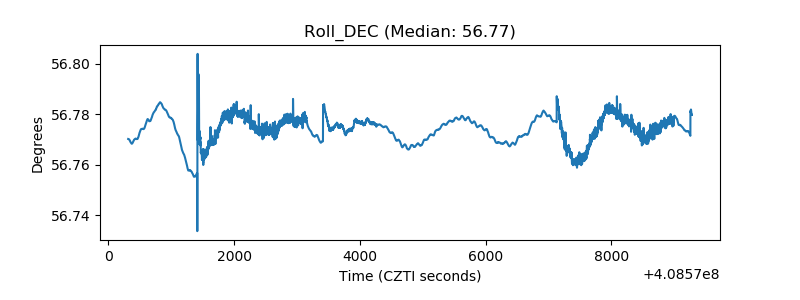 |
| _Roll_RA | 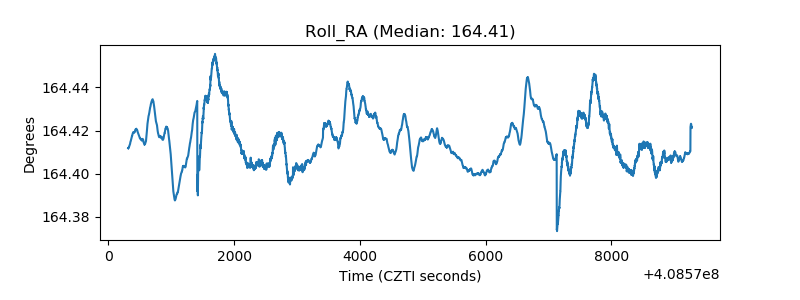 |
| Veto Counter | 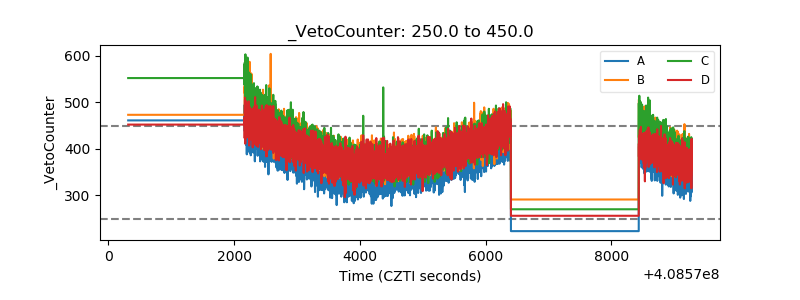 |